


Introduction
Pancreatic adenocarcinoma (PAAD) is the most commonly occurring pancreatic cancer, and the seventh leading cause of tumor-related death in both men and women worldwide [1]. It is often asymptomatic during the early stages. Although the treatment of PAAD has improved in recent years, thanks to the availability of newer chemotherapeutic drugs and advances in surgical techniques, the survival rates of PAAD patients remain very low. The majority of the patients are diagnosed with advanced stage PAAD, which is not amenable for surgical therapy [2]. Moreover, the 5-year survival rates of patients that have undergone successful surgery remain below 8% because of disease recurrence [3]. In addition, high rates of drug resistance to several chemotherapeutic drugs, including gemcitabine also contribute to low survival rates [4]. Therefore, reliable biomarkers useful for accurate early diagnoses are needed to improve survival rates in patients with PAAD.
Previous studies have revealed several protein-coding genes, miRNAs or long non-coding RNAs (lncRNAs) that regulate PAAD. For example, upregulation of miR-222 promotes tumor cell proliferation and invasiveness in PAAD by decreasing the nuclear levels of the p27 tumor suppressor protein [5]. In addition, silencing LINC00958 prevents initiation of pancreatic tumorigenesis by inhibiting PAX8 via miR-330-5p [6]. Circular RNAs (circRNAs) are a novel class of endogenous small non-coding RNAs that form covalently closed-loop structures and lack a 5′ cap or 3′ poly-A tail [7]. Although previously thought to be generated as a result of splicing errors [8], recent advances in RNA sequencing technologies have revealed that they play a key role in regulating gene expression by sponging miRNAs [9]. Aberrant expression of circRNAs has been documented in several human diseases, including cancers [10].
The exosomes secreted by PAAD cells contain circular aminoacyl-tRNA synthetases (circ-IARS), which promote tumor invasion and metastasis by enhancing endothelial monolayer permeability [11]. A competing endogenous RNA (ceRNA) network that includes circRNAs and miRNAs plays a critical role in posttranscriptional regulation of key proteins, and dysregulation of ceRNAs is associated with tumor development and progression [12]. However, the role of circRNAs in the growth and progression of PAAD is not fully understood [13]. The immune system plays a crucial role in PAAD growth and progression [14]. For that reason, we investigated the relationship between ceRNAs and tumor-infiltrated immune cells in the development and progression of PAAD.
Results
Identification of DEcircRNAs, DEmiRNAs, and DEmRNAs in PAAD tissues
We normalized the expression of circRNAs (Supplementary Figures 1A and 1B), microRNAs and mRNAs (Supplementary Figures 1C and 1D) in PAAD and normal pancreatic tissues. We identified 457 differentially expressed circRNAs (DEcircRNAs), which included 174 in the GSE69362 dataset [15] and 283 in the GSE79634 dataset [16], based on a threshold of P value < 0.05 and |log FC| ≥ 1. We generated volcano plots and heatmaps of the DEcircRNAs (Figures 1A and 1B), 19 DEmiRNAs (7 up-regulated and 12 down-regulated; Figure 1C) and 1993 DEmRNAs (1012 up-regulated and 981 down-regulated; Figure 1D) to demonstrate their aberrant expression in PAAD tissues. We compared the DEcircRNAs from the two datasets and identified 19 up-regulated and 8 down-regulated DEcircRNAs for further analysis (Figure 1E).
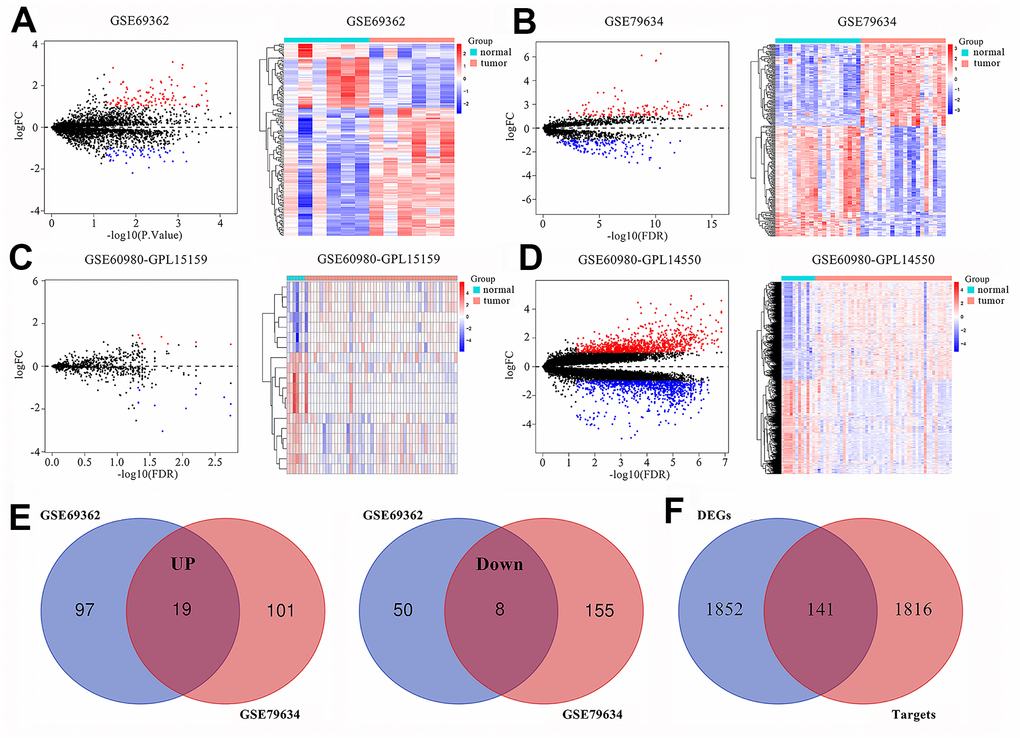
Figure 1. Differentially expressed circRNAs, miRNAs and mRNAs in pancreatic adenocarcinomas (PAAD). Volcano plots and heatmaps show identification of (A) DEcircRNAs in GSE69362, (B) DEcircRNAs in GSE79634, (C) DEmiRNAs in GSE60980 (GPL15159) and (D) DEmRNAs in GSE60980 (GPL14550) between PAAD tissues and adjacent normal pancreatic tissue. The red color indicates upregulated genes in the PAAD tissues and blue color indicates downregulated genes, while black color indicates genes with no significant differences between the PAAD and normal pancreatic tissues. Heatmaps show the expression patterns of DEcircRNAs, DEmiRNAs and DEmRNAs. The PAAD and adjacent normal pancreatic tissues are represented by red and blue color, respectively. (E) Venn diagrams show commonly upregulated DEcircRNAs and downregulated DEcircRNAs in the PAAD tissues in both GSE69362 and GSE79634. Purple and orange circles indicate the number of DEcircRNAs in the GSE69362 and GSE79634 datasets, respectively. The red circles in the middle indicate the overlapping circRNAs between the two datasets. (F) Venn diagram shows the intersection between DEmiRNA-predicted targets obtained from miRDB, miRTarBase and TargetScan databases and DEmRNAs in GSE60980 (GPL14550).
Construction of the circRNA-miRNA-mRNA network
We analyzed the DEcircRNAs, DEmiRNAs and DEmRNAs using the CSCD database and identified circRNA-miRNA pairs. We also identified miRNA-mRNA pairs by analyzing the miRDB, miRTarBase and TargetScan databases (Figure 1F). Finally, we generated a ceRNA network that consisted of 4 DEcircRNAs (circ-HIBADH, circ-UBAP2, circ-TADA2A and circ-CLEC17A), 3 DEmiRNAs (has-miR-214, has-mir-324-3pandhas-miR-494) and 149 DEmRNAs using the Cytoscape software as shown in Figure 2. The basic characteristics of the 4 DEcircRNAs are shown in Table 1 and Figure 3. Furthermore, we found that circ-CLEC17A is aberrantly overexpressed in PAAD tissues from females compared to males (Supplementary Figures 2A–2D).
Table 1. Basic characteristics of the 4 differently expressed circRNAs.
| CircRNA | Log2FC | Regulation | Type | Chromosome | Strand | Gene symbol | |||||||||||||||||||||||||||||||||||||||||||||||||||||||||||||||||||||||||||||||||||||||||||||
| hsa_circ_0049783 | 1.35 | UP | exonic | chr19 | + | CLEC17A | |||||||||||||||||||||||||||||||||||||||||||||||||||||||||||||||||||||||||||||||||||||||||||||
| hsa_circ_0007367 | 1.34 | UP | exonic | chr9 | - | UBAP2 | |||||||||||||||||||||||||||||||||||||||||||||||||||||||||||||||||||||||||||||||||||||||||||||
| hsa_circ_0003958 | 1.01 | DOWN | exonic | chr7 | - | HIBADH | |||||||||||||||||||||||||||||||||||||||||||||||||||||||||||||||||||||||||||||||||||||||||||||
| hsa_circ_0043278 | 1.19 | UP | exonic | chr17 | + | TADA2A | |||||||||||||||||||||||||||||||||||||||||||||||||||||||||||||||||||||||||||||||||||||||||||||
| Log2FC means that log2 transformation to fold changes of circRNA expression between PAAD tissues and normal tissues. UP means upregulated circRNA in PAAD tissues. DOWN means downregulated circRNA in PAAD tissues. | |||||||||||||||||||||||||||||||||||||||||||||||||||||||||||||||||||||||||||||||||||||||||||||||||||
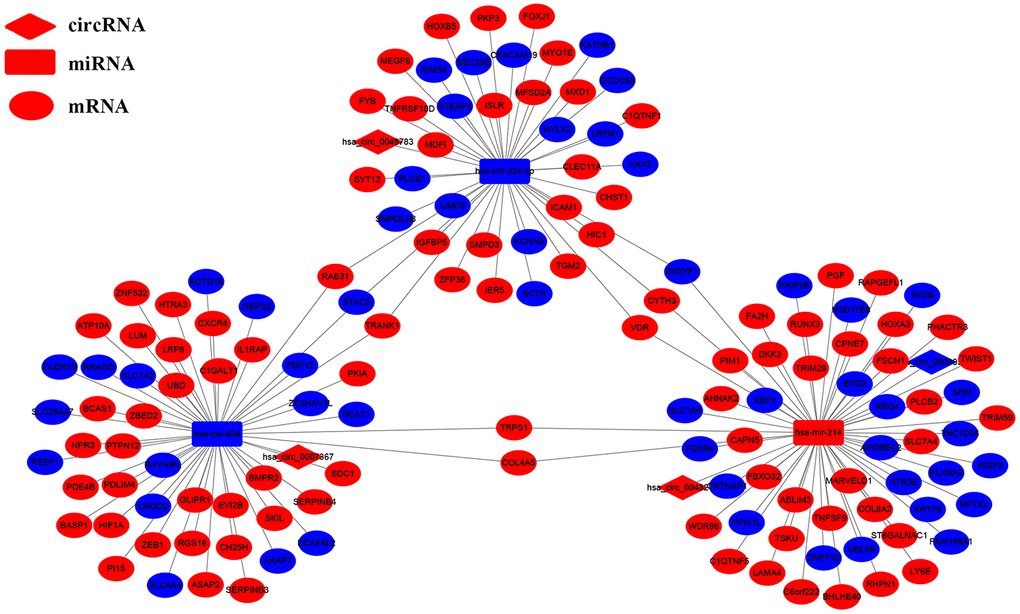
Figure 2. The circRNA-miRNA-mRNA interaction network in the PAAD tissues. The circRNA-miRNA-mRNA interaction network consists of 4 circRNAs (hsa_circ_0007367, hsa_circ_0003958, hsa_circ_0043278 and hsa-circ-0049783), 3 miRNAs (hsa-mir-324-3p, hsa-miR-214 and hsa-miR-494), and 149 mRNAs. The diamond nodes indicate the circRNAs; rectangle nodes indicate the miRNAs; the elliptical nodes indicate the mRNAs. The edges indicate a possible connection between the circRNAs, miRNAs, and the mRNAs. The red and blue color indicates high and low expression of the ceRNAs in the PAAD tissues, respectively.
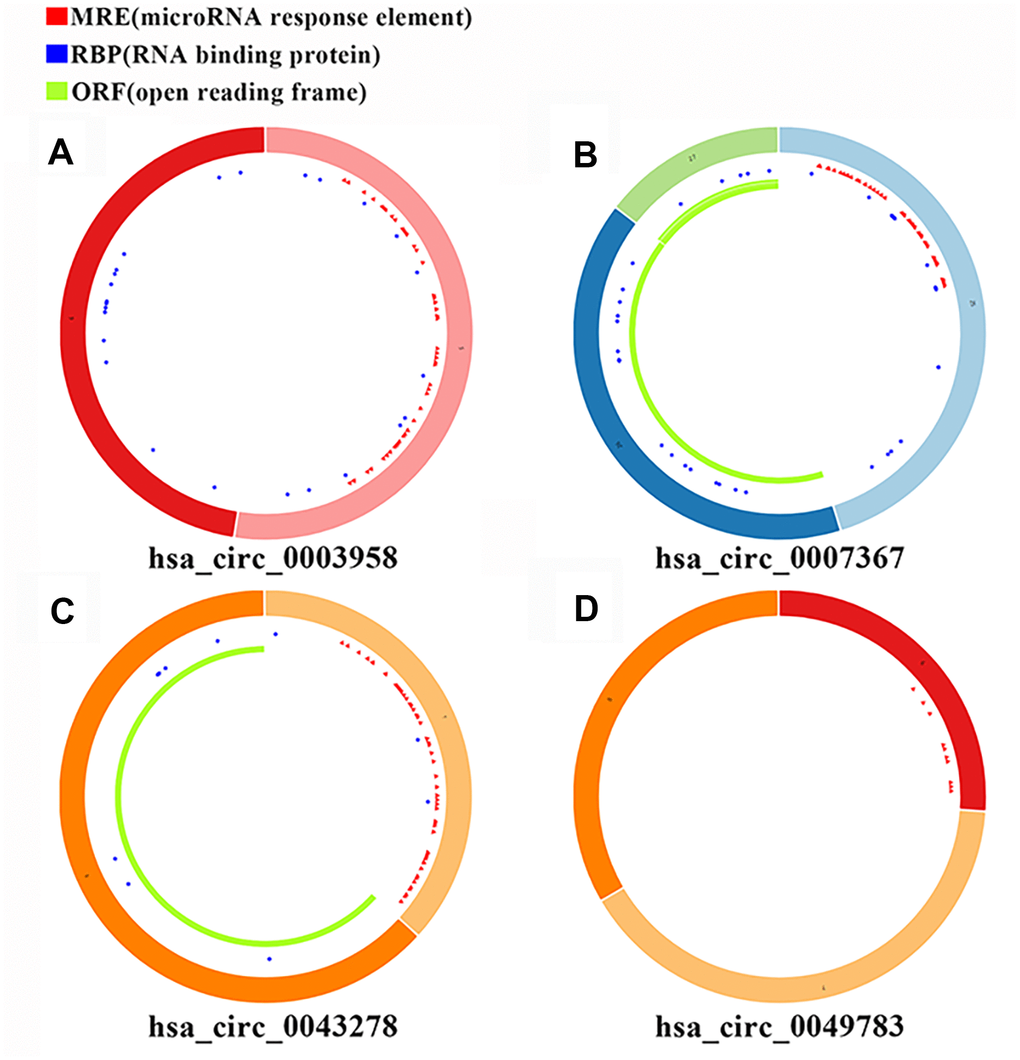
Figure 3. Basic structural features of the 4 PAAD-specific circRNAs. The structural features of (A) hsa_circRNA_0003958, (B) hsa_circRNA_0007367, (C) hsa_circRNA_0043278, and (D) hsa_circRNA_0049783 downloaded from the Cancer-Specific CircRNA Database (CSCD) are shown. The microRNA response element (MRE) is shown in red; The RNA binding protein (RBP) is shown in blue; The open reading frame (ORF) is shown in green.
Analysis of DEmRNAs
We performed Gene ontology (GO) and Kyoto Encyclopedia of Genes and Genomes (KEGG) analyses of the DEmRNAs to identify aberrantly regulated biological processes and signaling pathways in PAAD. The Gene Ontology analyses suggested that biological processes such as cell proliferation, angiogenesis and negative regulation of transcription from RNA polymerase II promoter were dysregulated (Figure 4A). KEGG pathway analysis of DEmRNAs highlighted the involvement of the NF-kappa B, PI3K-Akt, and Wnt signaling pathways, and cancer-related dysregulation of transcription (Figure 4B). The NF-kappa B, PI3K-Akt, and Wnt signaling pathways have previously been implicated in the growth and progression of PAAD [17–19]. The Sankey plots for all the enriched GO terms and KEGG pathways with a P value < 0.05 were shown, further highlighting the genes and the pathways involved in PAAD.
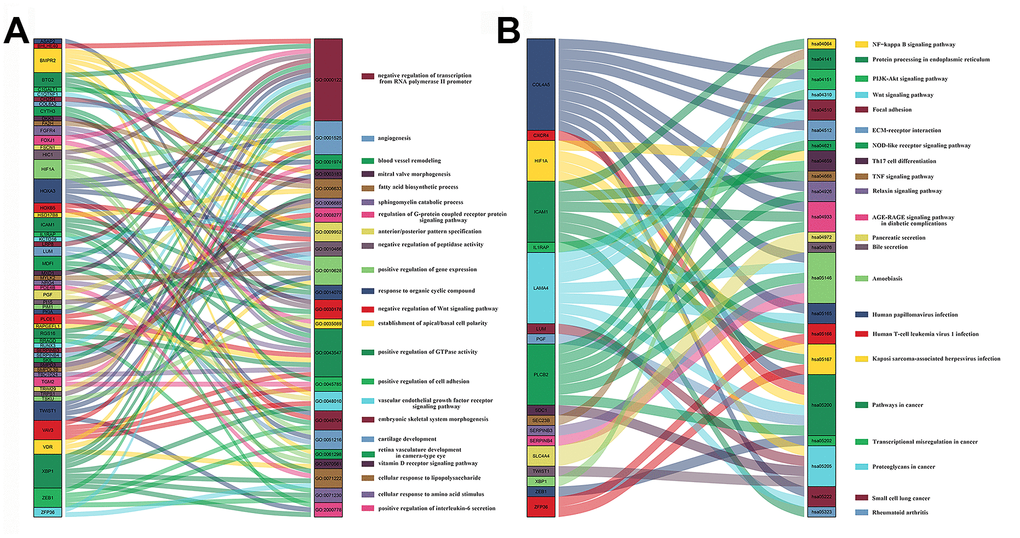
Figure 4. Sankey plots of signaling pathways and biological processes related to differentially expressed mRNAs in PAAD tissues. Sankey plots show (A) signaling pathways and (B) biological processes (BP) related to DEmRNAs involved in PAAD based on Kyoto Encyclopedia of Genes and Genomes (KEGG) enrichment and Gene Ontology_Biological Process (GO_BP) analyses, respectively.
Identification and validation of the hub genes
We analyzed the DEmRNAs using the Search Tool for the Retrieval of Interacting Genes database (STRING) and constructed a protein-protein interaction (PPI) network consisting of 141 nodes and 50 edges (Figure 5). We identified the top 15 genes, which were found in at least 6/11 topological algorithms and had a high-ranking score. After integrating the results of the GO, KEGG and PPI network analyses, we identified 5 hub genes that were closely related to PAAD tumorigenesis, namely, C-X-C Motif Chemokine Receptor 4 (CXCR4), Hypoxia-Inducible Factor 1 Subunit Alpha (HIF1A), Zinc Finger E-Box Binding Homeobox 1 (ZEB1), Syndecan 1 (SDC1) and Twist Family BHLH Transcription Factor 1 (TWIST1).
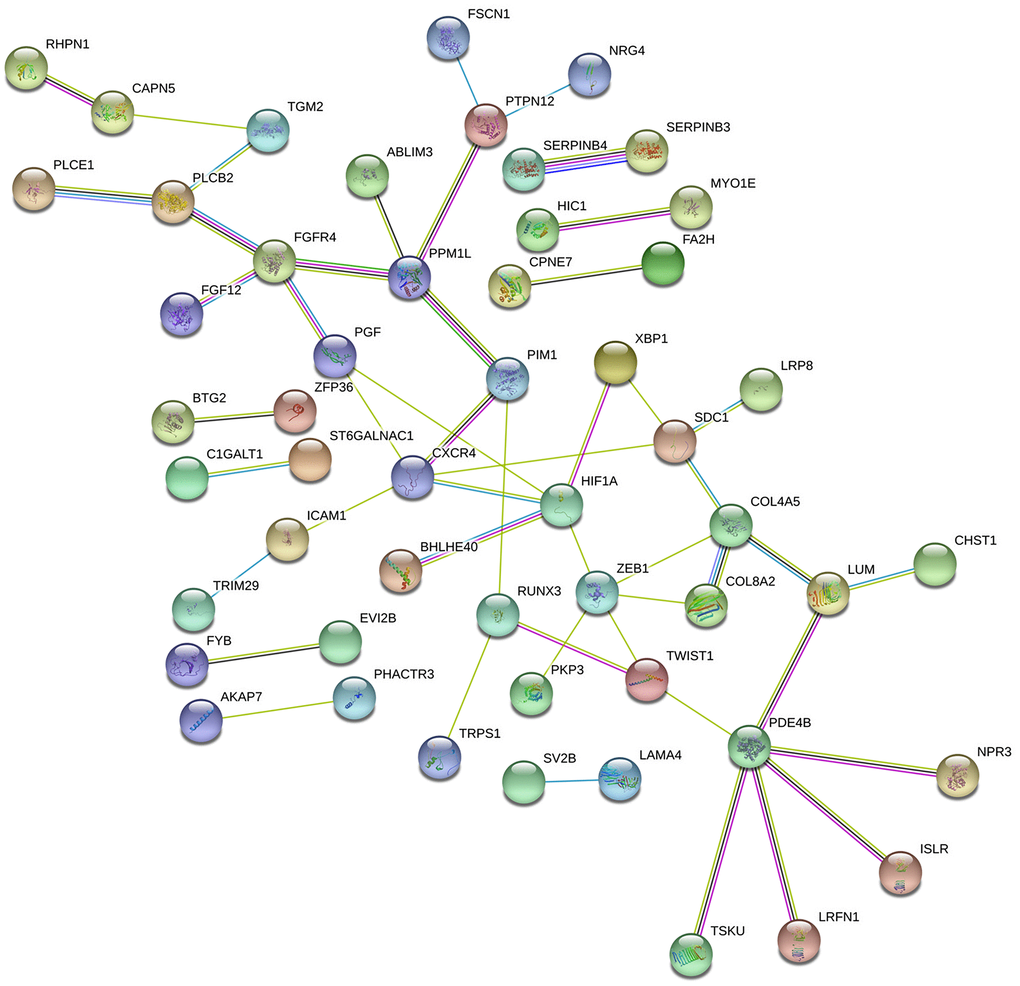
Figure 5. Protein-protein intersection (PPI) network analyses of the DEmRNAs involved in the ceRNA network. The PPI network consists of 141 edges and 50 nodes representing proteins and interactions, respectively. The relative thickness of the edges represents the degree of relationship (weak, moderate, or strong) between the nodes.
The transcription levels of the 5 hub genes in GSE60980 (GPL14550), 3 related miRNAs in GSE60980 (GPL15159), and 4 circRNAs in GSE79634 (Figure 6) and GSE69362 (Supplementary Figure 3) were shown. We further validated the 5 hub genes by analyzing their mRNA expression in the Gene Expression Profiling Interactive Analysis (GEPIA) and the protein expression in The Human Protein Atlas (THPA) database as shown in Figures 7A and 7B, respectively. The transcription levels of these 5 hub genes in GEPIA were similar to the results in Figure 6. The protein expression data in the THPA database showed that SDC1 and ZEB1 were aberrantly overexpressed in PAAD compared to normal pancreatic tissues, which were in accordance with our transcription results in Figure 6. However, HIF1A protein levels were low in both PAAD and normal pancreatic tissues, and the protein levels of the remaining two hub proteins, CXCR4 and TWIST1 were not found in the THPA database.
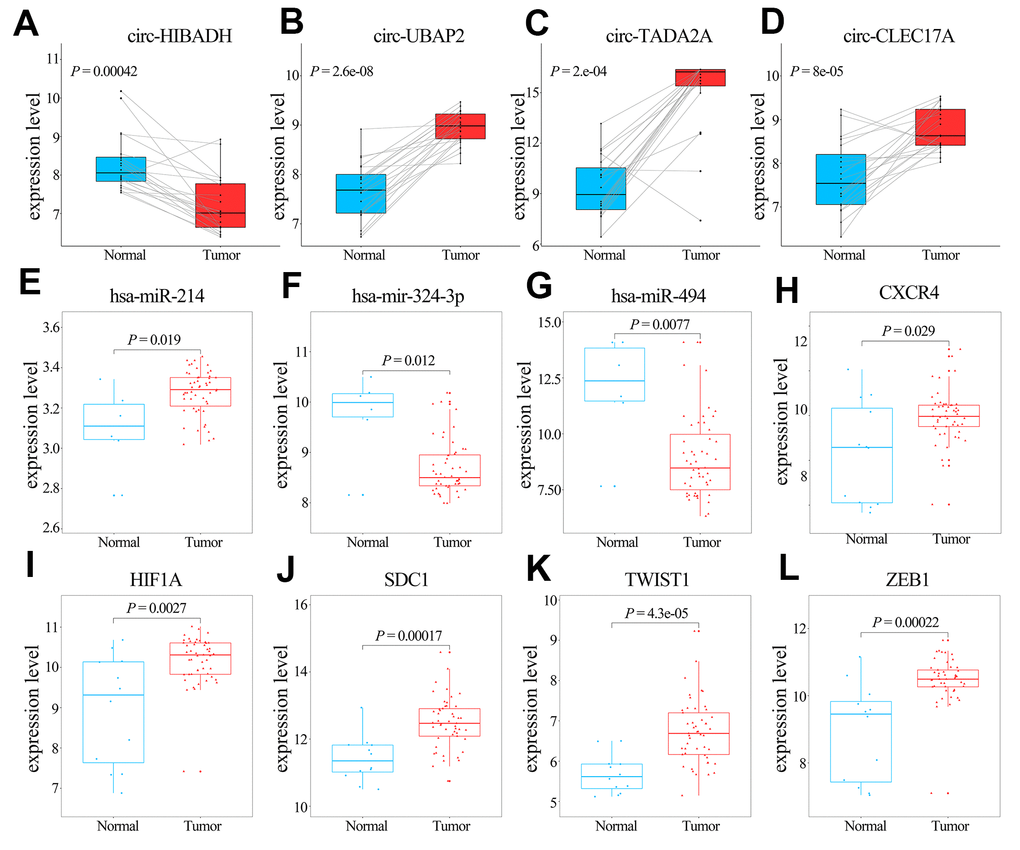
Figure 6. Comparative analyses of the transcription levels of hub genes in GSE60980 (GPL14550), and related miRNAs in GSE60980 (GPL15159) and circRNAs in GSE79634 between PAAD and normal pancreatic tissues. (A–K) Transcription levels of circ-HIBADH, circ-UBAP2, circ-TADA2A, circ-CLEC17A, hsa-miR-214, hsa-mir-324-3p, hsa-miR-494, CXCR4, HIF1A, SDC1, TWIST1 and ZEB1 between PAAD (red) and normal pancreatic tissues (blue).
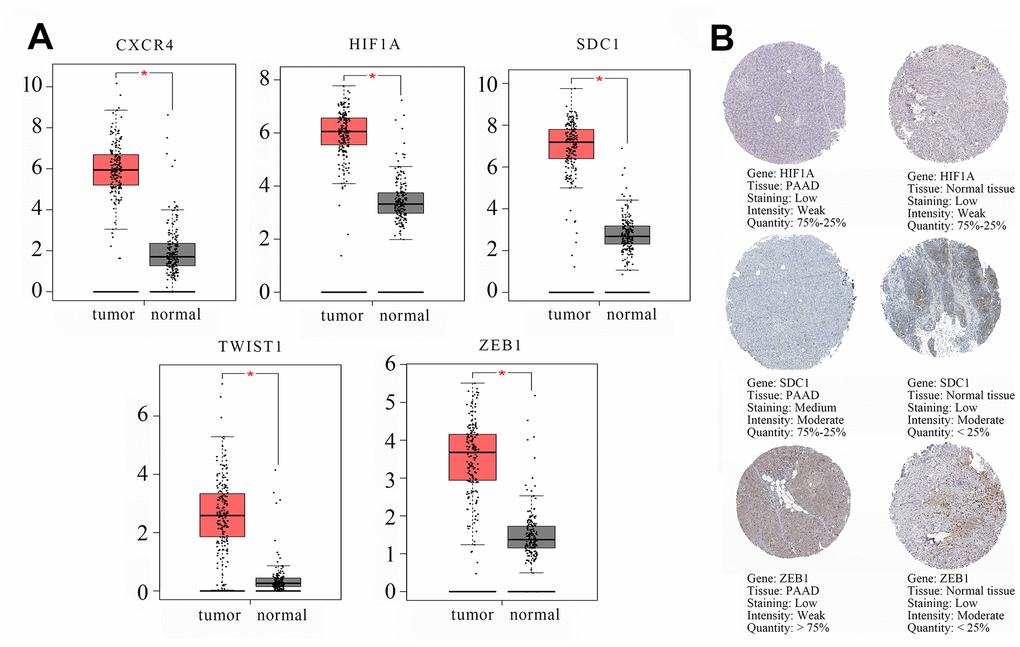
Figure 7. Validation of the transcript (mRNA) and protein levels of the hub genes using the Gene Expression Profiling Interactive Analysis (GEPIA) and The Human Protein Atlas database. (A) The transcript (mRNA) of the hub genes, namely, CXCR4, HIF1A, SDC1, TWIST1, and ZEB1 in PAAD and normal pancreatic tissues are shown. (B) Immunohistochemical (IHC) staining data of hub genes as follows: HIF1A protein expression in a PAAD tumor tissue (Staining: low; Intensity: weak; Quantity: 75%-25%; Location: cytoplasmic/membrane); HIF1A protein expression in a representative normal pancreatic tissue (Staining: low; Intensity: weak; Quantity: 75%-25%; Location: nuclear); SDC1 protein expression in a PAAD tumor tissue (Staining: medium; Intensity: moderate; Quantity: 75%-25%; Location: cytoplasmic/membrane). SDC1 protein expression in a representative normal pancreatic tissue (Staining: low; Intensity: moderate; Quantity: < 25%; Location: cytoplasmic/membrane). ZEB1 protein expression in a PAAD tumor tissue (Staining: low; Intensity: weak; Quantity: > 75%; Location: cytoplasmic/membrane). ZEB1 protein expression in a representative normal pancreatic tissue (Staining: low; Intensity: moderate; Quantity: < 25%; Location: cytoplasmic/membrane). The database lacked information regarding CXCR4 and TWIST1 protein expression in PAAD tumor tissues and normal pancreatic tissues. IHC results consistent with changed trend of transcript (mRNA) of hub genes in GSE60980 (GPL14550) and GEPIA were displayed.
Analysis of prognosis and tumor infiltration of immune cells
We analyzed the overall survival (OS) using the Kaplan-Meier Plotter database (KM plotter database) to determine the prognostic value of hub genes and miRNAs. Prognosis based on their high and low expression in PAAD tissues is shown in Figure 8. High expression of SDC1 and TWIST1 was associated with poorer OS (HR = 2.23, P = 0.0030 and HR = 1.66, P = 0.018). High expression of hsa-miR-494 and hsa-miR-324 was associated with increased OS (HR = 0.64, P = 0.033 and HR = 0.50, P = 0.00095).
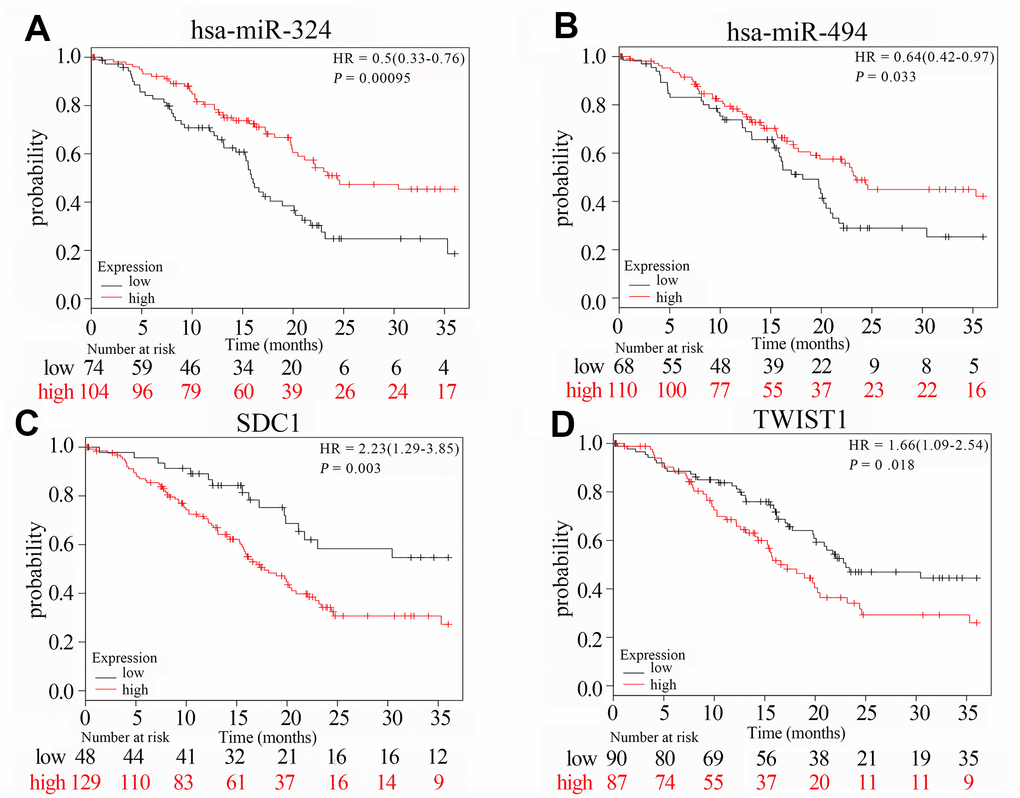
Figure 8. The survival curves of hub genes and their related miRNAs based on Kaplan Meier. (A–D) Transcription levels of hsa-miR-324, hsa-miR-494, SDC1 and TWIST1 are significantly related to the overall survival of patients with PAAD (P < 0.05). Red curve indicates high expression in PAAD tumor tissues; black curve indicates low expression in PAAD tumor tissues; P value < 0.05 indicates statistical significance; HR: hazard ratio.
Since several studies have shown that immune cell infiltration and the tumor microenvironment plays a critical role in the development of cancers, we analyzed the relationship between the expression of the hub genes and the status of immune cell infiltration in PAAD tumors using the Tumor Immune Estimation Resource (TIMER) database. As shown in Supplementary Figure 4, CXCR4 expression positively correlated with the infiltration levels of B cells (Cor = 0.401, P = 5.40e-08), CD4+ T cells (Cor = 0.435, P = 3.56e-09), neutrophils (Cor = 0.496, P = 5.46e-12), macrophages (Cor = 0.467, P = 1.20e-10), and dendritic cells or DCs (Cor = 0.503, P = 2.40e-12). ZEB1 expression positively correlated with infiltration levels of CD8+ T cells (Cor = 0.525, P = 1.59e-13), neutrophils (Cor = 0.519, P = 3.44e-13), macrophages (Cor = 0.693, P = 8.68e-26), and DCs (Cor = 0.572, P = 3.09e-16). However, SDC1 expression showed no significant correlation with immune cell infiltration in the PAAD tumors. These results suggested that the circRNA-mediated ceRNAs might modulate tumorigenesis by regulating the infiltration of immune cells in PAAD.
Correlation analysis between the hub genes and the immune cell markers
Next, to further characterize the role of the different subsets of immune cells with PAAD tumorigenesis, we analyzed the correlation between the expression of hub genes and various immune cell markers, including markers specific for CD8+ T cells, T cells (general), B cells, monocytes, tumor-associated macrophages (TAMs), M1 and M2 macrophages, neutrophils, natural killer cells (NKs) and DCs. We also analyzed the data for different subsets of T cells, such as T-helper 1 (Th1) cells, T-helper 2 (Th2) cells, follicular helper T cells (Tfhs), T-helper 17 cells (Th17s), regulatory T cells (Tregs) and exhausted T cells. After adjusting for purity, we found that the expression of most of the immune cell markers positively correlated with the expression of CXCR4 and ZEB1 and negatively correlated with SDC1 expression in PAAD tissues (Table 2).
Table 2. Correlation analyses between 5 hub genes and the corresponding markers of immune cells in TIMER.
| Description | Gene makers | CXCR4 | HIF1A | SDC1 | TWIST1 | ZEB1 | |||||||||||||||||||||||||||||||||||||||||||||||||||||||||||||||||||||||||||||||||||||||||||||
| Purity | Purity | Purity | Purity | Purity | |||||||||||||||||||||||||||||||||||||||||||||||||||||||||||||||||||||||||||||||||||||||||||||||
| Cor | P | Cor | P | Cor | P | Cor | P | Cor | P | ||||||||||||||||||||||||||||||||||||||||||||||||||||||||||||||||||||||||||||||||||||||||||
| CD8+ T cell | CD8A | 0.667 | *** | 0.265 | *** | -0.423 | *** | -0.025 | 0.749 | 0.259 | *** | ||||||||||||||||||||||||||||||||||||||||||||||||||||||||||||||||||||||||||||||||||||||||
| CD8B | 0.549 | *** | 0.188 | * | -0.273 | *** | -0.039 | 0.609 | 0.419 | *** | |||||||||||||||||||||||||||||||||||||||||||||||||||||||||||||||||||||||||||||||||||||||||
| T cell (general) | CD3D | 0.727 | *** | 0.119 | 0.120 | -0.304 | *** | 0.080 | 0.299 | 0.367 | *** | ||||||||||||||||||||||||||||||||||||||||||||||||||||||||||||||||||||||||||||||||||||||||
| CD3E | 0.739 | *** | 0.181 | * | -0.344 | *** | 0.051 | 0.510 | 0.447 | *** | |||||||||||||||||||||||||||||||||||||||||||||||||||||||||||||||||||||||||||||||||||||||||
| CD2 | 0.711 | *** | 0.207 | ** | -0.377 | *** | 0.028 | 0.718 | 0.465 | *** | |||||||||||||||||||||||||||||||||||||||||||||||||||||||||||||||||||||||||||||||||||||||||
| B cell | CD19 | 0.612 | *** | 0.020 | 0.800 | -0.135 | 0.077 | 0.126 | 0.100 | 0.352 | *** | ||||||||||||||||||||||||||||||||||||||||||||||||||||||||||||||||||||||||||||||||||||||||
| CD79A | 0.610 | *** | 0.102 | 0.184 | -0.147 | 0.056 | 0.122 | 0.112 | 0.344 | *** | |||||||||||||||||||||||||||||||||||||||||||||||||||||||||||||||||||||||||||||||||||||||||
| Monocyte | CD86 | 0.665 | *** | 0.425 | *** | -0.273 | *** | 0.321 | *** | 0.552 | *** | ||||||||||||||||||||||||||||||||||||||||||||||||||||||||||||||||||||||||||||||||||||||||
| CD115 (CSF1R) | 0.592 | *** | 0.360 | *** | -0.415 | *** | 0.107 | 0.163 | 0.598 | *** | |||||||||||||||||||||||||||||||||||||||||||||||||||||||||||||||||||||||||||||||||||||||||
| TAM | CCL2 | 0.394 | *** | 0.320 | *** | -0.384 | *** | 0.037 | 0.629 | 0.335 | *** | ||||||||||||||||||||||||||||||||||||||||||||||||||||||||||||||||||||||||||||||||||||||||
| CD68 | 0.386 | *** | 0.319 | *** | -0.019 | 0.805 | 0.280 | *** | 0.253 | *** | |||||||||||||||||||||||||||||||||||||||||||||||||||||||||||||||||||||||||||||||||||||||||
| IL10 | 0.527 | *** | 0.297 | *** | -0.230 | ** | 0.250 | *** | 0.501 | *** | |||||||||||||||||||||||||||||||||||||||||||||||||||||||||||||||||||||||||||||||||||||||||
| M1 macrophage | INOS (NOS2) | 0.193 | * | 0.128 | 0.095 | -0.091 | 0.237 | 0.177 | * | 0.191 | * | ||||||||||||||||||||||||||||||||||||||||||||||||||||||||||||||||||||||||||||||||||||||||
| IRF5 | 0.307 | *** | -0.152 | * | 0.081 | 0.291 | 0.201 | ** | 0.047 | 0.540 | |||||||||||||||||||||||||||||||||||||||||||||||||||||||||||||||||||||||||||||||||||||||||
| COX2(PTGS2) | 0.030 | 0.699 | 0.292 | *** | 0.226 | ** | 0.281 | *** | 0.224 | ** | |||||||||||||||||||||||||||||||||||||||||||||||||||||||||||||||||||||||||||||||||||||||||
| M2 macrophage | CD163 | 0.541 | *** | 0.424 | *** | -0.351 | *** | 0.179 | * | 0.594 | *** | ||||||||||||||||||||||||||||||||||||||||||||||||||||||||||||||||||||||||||||||||||||||||
| VSIG4 | 0.484 | *** | 0.321 | *** | -0.349 | *** | 0.213 | ** | 0.472 | *** | |||||||||||||||||||||||||||||||||||||||||||||||||||||||||||||||||||||||||||||||||||||||||
| MS4A4A | 0.602 | *** | 0.355 | *** | -0.393 | *** | 0.202 | ** | 0.579 | *** | |||||||||||||||||||||||||||||||||||||||||||||||||||||||||||||||||||||||||||||||||||||||||
| Neutrophils | CD66b (CEACAM8) | 0.189 | * | 0.079 | 0.303 | -0.085 | 0.269 | 0.022 | 0.772 | 0.099 | 0.196 | ||||||||||||||||||||||||||||||||||||||||||||||||||||||||||||||||||||||||||||||||||||||||
| CD11b (ITGAM) | 0.490 | *** | 0.238 | ** | -0.208 | ** | 0.261 | *** | 0.409 | *** | |||||||||||||||||||||||||||||||||||||||||||||||||||||||||||||||||||||||||||||||||||||||||
| CCR7 | 0.701 | *** | 0.151 | * | -0.314 | *** | 0.035 | 0.647 | 0.424 | *** | |||||||||||||||||||||||||||||||||||||||||||||||||||||||||||||||||||||||||||||||||||||||||
| Natural killer cell | KIR2DL1 | 0.235 | ** | 0.103 | 0.180 | -0.058 | 0.450 | 0.118 | 0.123 | 0.147 | 0.055 | ||||||||||||||||||||||||||||||||||||||||||||||||||||||||||||||||||||||||||||||||||||||||
| KIR2DL3 | 0.279 | *** | 0.108 | 0.158 | -0.043 | 0.577 | 0.111 | 0.149 | 0.185 | * | |||||||||||||||||||||||||||||||||||||||||||||||||||||||||||||||||||||||||||||||||||||||||
| KIR2DL4 | 0.056 | 0.469 | 0.099 | 0.197 | -0.081 | 0.290 | 0.056 | 0.469 | 0.001 | 0.990 | |||||||||||||||||||||||||||||||||||||||||||||||||||||||||||||||||||||||||||||||||||||||||
| KIR3DL1 | 0.305 | *** | 0.168 | * | -0.253 | *** | 0.029 | 0.708 | 0.226 | ** | |||||||||||||||||||||||||||||||||||||||||||||||||||||||||||||||||||||||||||||||||||||||||
| KIR3DL2 | 0.239 | ** | 0.032 | 0.679 | -0.120 | 0.119 | 0.184 | * | 0.181 | * | |||||||||||||||||||||||||||||||||||||||||||||||||||||||||||||||||||||||||||||||||||||||||
| KIR3DL3 | -0.074 | 0.334 | 0.056 | 0.464 | 0.043 | 0.577 | 0.052 | 0.500 | 0.115 | 0.135 | |||||||||||||||||||||||||||||||||||||||||||||||||||||||||||||||||||||||||||||||||||||||||
| KIR2DS4 | 0.073 | 0.340 | 0.070 | 0.360 | -0.116 | 0.132 | -0.026 | 0.733 | 0.030 | 0.702 | |||||||||||||||||||||||||||||||||||||||||||||||||||||||||||||||||||||||||||||||||||||||||
| Dendritic cell | HLA-DPB1 | 0.721 | *** | 0.244 | ** | -0.306 | *** | 0.146 | 0.056 | 0.466 | *** | ||||||||||||||||||||||||||||||||||||||||||||||||||||||||||||||||||||||||||||||||||||||||
| HLA-DQB1 | 0.457 | *** | 0.171 | * | -0.245 | ** | 0.092 | 0.231 | 0.295 | *** | |||||||||||||||||||||||||||||||||||||||||||||||||||||||||||||||||||||||||||||||||||||||||
| HLA-DRA | 0.685 | *** | 0.341 | *** | -0.298 | *** | 0.209 | ** | 0.513 | *** | |||||||||||||||||||||||||||||||||||||||||||||||||||||||||||||||||||||||||||||||||||||||||
| HLA-DPA1 | 0.671 | *** | 0.303 | *** | -0.320 | *** | 0.147 | 0.055 | 0.513 | *** | |||||||||||||||||||||||||||||||||||||||||||||||||||||||||||||||||||||||||||||||||||||||||
| BDCA-1(CD1C) | 0.618 | *** | 0.220 | ** | -0.304 | *** | 0.002 | 0.987 | 0.460 | *** | |||||||||||||||||||||||||||||||||||||||||||||||||||||||||||||||||||||||||||||||||||||||||
| BDCA-4(NRP1) | 0.376 | *** | 0.645 | *** | -0.393 | *** | 0.041 | 0.594 | 0.660 | *** | |||||||||||||||||||||||||||||||||||||||||||||||||||||||||||||||||||||||||||||||||||||||||
| CD11c (ITGAX) | 0.617 | *** | 0.266 | ** | -0.151 | * | 0.388 | *** | 0.379 | *** | |||||||||||||||||||||||||||||||||||||||||||||||||||||||||||||||||||||||||||||||||||||||||
| Th1 | T-bet (TBX21) | 0.662 | *** | 0.174 | * | -0.386 | *** | -0.017 | 0.829 | 0.372 | *** | ||||||||||||||||||||||||||||||||||||||||||||||||||||||||||||||||||||||||||||||||||||||||
| STAT4 | 0.602 | *** | 0.229 | ** | -0.492 | *** | -0.116 | 0.132 | 0.413 | *** | |||||||||||||||||||||||||||||||||||||||||||||||||||||||||||||||||||||||||||||||||||||||||
| STAT1 | 0.164 | * | 0.369 | *** | 0.004 | 0.961 | 0.115 | 0.135 | 0.299 | *** | |||||||||||||||||||||||||||||||||||||||||||||||||||||||||||||||||||||||||||||||||||||||||
| IFN-γ (IFNG) | 0.360 | *** | 0.193 | * | -0.096 | 0.213 | 0.127 | 0.098 | 0.223 | ** | |||||||||||||||||||||||||||||||||||||||||||||||||||||||||||||||||||||||||||||||||||||||||
| TNF-α (TNF) | 0.409 | *** | 0.106 | 0.168 | -0.155 | * | 0.265 | *** | 0.168 | * | |||||||||||||||||||||||||||||||||||||||||||||||||||||||||||||||||||||||||||||||||||||||||
| Th2 | GATA3 | 0.175 | * | 0.064 | 0.407 | 0.180 | * | 0.224 | ** | 0.098 | 0.204 | ||||||||||||||||||||||||||||||||||||||||||||||||||||||||||||||||||||||||||||||||||||||||
| STAT6 | -0.039 | 0.610 | -0.013 | 0.869 | 0.092 | 0.232 | -0.133 | 0.084 | -0.085 | 0.271 | |||||||||||||||||||||||||||||||||||||||||||||||||||||||||||||||||||||||||||||||||||||||||
| STAT5A | 0.573 | *** | -0.064 | 0.402 | -0.134 | 0.079 | 0.036 | 0.638 | 0.243 | ** | |||||||||||||||||||||||||||||||||||||||||||||||||||||||||||||||||||||||||||||||||||||||||
| IL13 | 0.144 | 0.060 | -0.008 | 0.915 | -0.123 | 0.109 | 0.012 | 0.888 | 0.144 | 0.060 | |||||||||||||||||||||||||||||||||||||||||||||||||||||||||||||||||||||||||||||||||||||||||
| Tfh | BCL6 | 0.264 | *** | 0.447 | *** | -0.001 | 0.992 | 0.223 | ** | 0.260 | *** | ||||||||||||||||||||||||||||||||||||||||||||||||||||||||||||||||||||||||||||||||||||||||
| IL21 | 0.343 | *** | 0.152 | * | -0.176 | * | 0.082 | 0.284 | 0.224 | ** | |||||||||||||||||||||||||||||||||||||||||||||||||||||||||||||||||||||||||||||||||||||||||
| Th17 | STAT3 | 0.341 | *** | 0.526 | *** | -0.305 | *** | -0.003 | 0.966 | 0.563 | *** | ||||||||||||||||||||||||||||||||||||||||||||||||||||||||||||||||||||||||||||||||||||||||
| IL17A | 0.108 | 0.161 | 0.202 | ** | -0.259 | *** | -0.184 | * | 0.119 | 0.122 | |||||||||||||||||||||||||||||||||||||||||||||||||||||||||||||||||||||||||||||||||||||||||
| Treg | FOXP3 | 0.612 | *** | 0.227 | ** | -0.218 | ** | 0.249 | ** | 0.483 | *** | ||||||||||||||||||||||||||||||||||||||||||||||||||||||||||||||||||||||||||||||||||||||||
| CCR8 | 0.545 | *** | 0.391 | *** | -0.242 | ** | 0.182 | * | 0.585 | *** | |||||||||||||||||||||||||||||||||||||||||||||||||||||||||||||||||||||||||||||||||||||||||
| STAT5B | 0.450 | *** | 0.209 | ** | -0.469 | *** | -0.042 | 0.586 | 0.580 | *** | |||||||||||||||||||||||||||||||||||||||||||||||||||||||||||||||||||||||||||||||||||||||||
| TGFβ (TGFB1) | 0.260 | *** | 0.057 | 0.458 | 0.213 | ** | 0.504 | *** | 0.135 | 0.078 | |||||||||||||||||||||||||||||||||||||||||||||||||||||||||||||||||||||||||||||||||||||||||
| T cell exhaustion | PD-1 (PDCD1) | 0.631 | *** | 0.207 | ** | -0.225 | ** | 0.085 | 0.269 | 0.327 | *** | ||||||||||||||||||||||||||||||||||||||||||||||||||||||||||||||||||||||||||||||||||||||||
| CTLA4 | 0.728 | *** | 0.209 | ** | -0.276 | *** | 0.194 | * | 0.394 | *** | |||||||||||||||||||||||||||||||||||||||||||||||||||||||||||||||||||||||||||||||||||||||||
| LAG3 | 0.426 | *** | 0.033 | 0.673 | -0.237 | ** | 0.120 | 0.118 | 0.170 | * | |||||||||||||||||||||||||||||||||||||||||||||||||||||||||||||||||||||||||||||||||||||||||
| TIM-3 (HAVCR2) | 0.654 | *** | 0.316 | *** | -0.239 | ** | 0.330 | *** | 0.492 | *** | |||||||||||||||||||||||||||||||||||||||||||||||||||||||||||||||||||||||||||||||||||||||||
| GZMB | 0.484 | *** | 0.214 | ** | -0.260 | *** | 0.121 | 0.114 | 0.277 | *** | |||||||||||||||||||||||||||||||||||||||||||||||||||||||||||||||||||||||||||||||||||||||||
| The following categories were used to define correlation strength based on the absolute values : “0.00–0.19” indicates very weak; “0.20–0.39” indicates weak; “0.40–0.59” indicates moderate; “0.60–0.79” indicates strong; “0.80–1.0” indicates very strong; P value < 0.05 was defined as statistically significant; Tfh, Follicular helper T cell; Tregs, regulatory T cells; Th, T helper cells; TAM, tumor-associated macrophages; Purity, correlation adjusted by purity; Cor, R-value of Spearman’s correlation; * P < 0.05; ** P < 0.01; *** P < 0.001. | |||||||||||||||||||||||||||||||||||||||||||||||||||||||||||||||||||||||||||||||||||||||||||||||||||
The expression of specific markers for TAMs, M2 macrophages, monocytes and Tregs show a moderate to strong positive correlation with the expression of CXCR4 and ZEB1 (Table 2). These include TAM markers such as CCL-2, CD68 and IL10, and M2 phenotype markers such as CD163, VSIG4 and MS4A4A (Figure 9A–9H). Furthermore, the expression of specific markers for CD8+ T cells, T cells (general) and B cells show a strong positive correlation with the expression of CXCR4 (Table 2). The high expression of DC markers, HLA-DPB1, HLA-DQB1, HLA-DRA, HLA-DPA1, BDCA-1, BDCA-4 and CD11c correlates with increased expression of CXCR4 (P <0.001) and ZEB1 (P <0.001) (Table 2). This suggests that PAAD cells expressing high levels of CXCR4 and ZEB1 proteins might promote DC infiltration. We also observed positive correlation between CXCR4 and markers of T cell exhaustion, such as programmed cell death protein 1 (PD-1), cytotoxic T lymphocyte-associated antigen-4 (CTLA4), lymphocyte-activation gene 3 (LAG3), T cell immunoglobulin domain and mucin domain-3 (TIM-3), and Granzyme B (GZMB) (P <0.001) (Table 2).
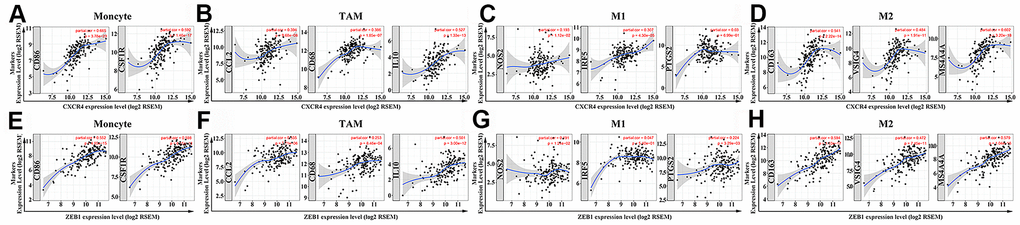
Figure 9. The two hub genes positively correlate with macrophage polarization in PAAD tissues. (A–D) The relationship between CXCR4 expression and biomarkers of monocytes, TAMs, M1 and M2 macrophages is shown. (E–H) The relationship between ZEB1 expression and biomarkers of monocytes, TAMs, M1 and M2 macrophages is shown. Note: Monocyte markers: CD86 and CSF1R; TAM markers: CCL2, CD68 and IL10; M1 macrophage markers: NOS2, IRF5 and PTGS2; M2 macrophage markers: CD163, VSIG4 and MS4A4A. Hub genes are shown on the x-axis, and the corresponding marker genes are shown on the y-axis.
Discussion
Complex mechanisms involving several genes and pathways are involved in the growth and progression of PAAD. The ceRNA network has emerged a novel method of posttranscriptional gene regulation. In the present study, we identified a total of 457 DEcircRNAs in GSE69362 and GSE79634, 19 DEmiRNAs in GSE60980 (GPL15159) and 1993 DEmRNAs in GSE60980 (GPL14550). We generated a circRNA-mediated ceRNA network that included 4 circRNAs, 3 miRNAs and 149 mRNAs. We then constructed a PPI network and identified 5 hub genes, including CXCR4, HIF1A, ZEB1, SDC1 and TWIST1, by performing functional enrichment using GO and KEGG pathway analyses. We further analyzed the relationship between the protein expression of the hub genes and the prognosis and the status of immune cell infiltration in PAAD.
We identified 4 circRNAs, circ-UBAP2, circ-CLEC17A, circ-HIBADH and circ-TADA2A, as part of the ceRNA network from among 457 DEcircRNAs. Previous studies have shown that circ-UBAP2 plays an important role in many cancers by acting as a sponge for miRNAs. In triple-negative breast cancer (TNBC), upregulated circ-UBAP2 binds to and inhibits miR-661, which promotes high expression of the MTA1 oncogene that activates TNBC cell proliferation and migration [20]. In osteosarcoma cells, circ-UBAP2 acts as an miR-143 sponge and suppresses apoptosis by upregulating Bcl-2 [21]. The role of circ-UBAP2 in PAAD has not been reported. Our study suggests that up-regulated circ-UBAP2 inhibits the expression of hsa-miR-494 to promote pancreatic tumorigenesis. The roles of circ-CLEC17A, circ-HIBADH and circ-TADA2A in tumorigenesis have not been previously reported. Our results indicate that the circ-CLEC17A/hsa-mir-324-3p, circ-HIBADH/hsa-miR-214 and circ-TADA2A/hsa-miR-214 axis modulate the biogenesis, growth and progression of PAAD. Nevertheless, our data require further experimental confirmation.
We identified 5 hub genes that have previously been associated with PAAD tumorigenesis. Artemin promotes metastasis and invasiveness of PAAD cells by inducing CXCR4 expression via the activation of the NF-κB signaling [22]. Moreover, miR-494 inhibits proliferation, invasion and metastasis of prostate and breast cancer cells by suppressing CXCR4 expression [23, 24]. Furthermore, miR-494 suppresses epithelial-mesenchymal transition (EMT), metastasis and invasiveness of PAAD cells by downregulating SDC1 [25]. Liu H et al. reported that downregulation of TWIST1 suppresses PAAD cell invasiveness and metastasis [26]. TWIST1 may be a direct target of hsa-miR-214, which is part of the ceRNA network we constructed in this study. Cao et al. reported that down-regulation of mir-214-5p promotes the proliferation, invasion and migration of PAAD cells in a JAG1-dependent manner, which is consistent with the effect of TWIST1 knockdown [27]. We therefore speculate that the hsa-miR-214/TWIST1 axis plays a critical role in PAAD progression. When exposed to hypoxic conditions, PAAD cells generate exosomes that are rich in mir-301a-3p which induces M2 polarization of the tumor-associated macrophages (TAMs) via the activation of PTEN/PI3Kγ in a HIF1A- or HIF2A-dependent manner, thereby promoting tumor cell EMT, invasiveness, and metastasis [28]. In hypoxic conditions, activated KRAS upregulates carbonic anhydrase 9 modulates pH and glycolysis via HIF1A or HIF2A and promotes aggressive growth of PAAD cells [29]. Notably, 4 out of the 5 hub genes, namely, CXCR4, SDC1, ZEB1 and HIF1A, are potential targets of the circ-UBAP2/hsa-miR-494 ceRNA network. This suggests that circ-UBAP2/hsa-miR-494 ceRNA network plays a critical role in the initiation, growth, and progression of PAAD.
To address the potential regulatory roles of the hub genes in the recruitment of tumor-infiltrating lymphocytes, we assessed the correlation between the expression of hub genes and the status of immune infiltration levels in PAAD using the TIMER database. Our data suggest that high expression of both CXCR4 and ZEB1 correlates moderately or strongly with the markers of immune cell types such as M2 macrophages, CD163, VSIG4 and MS4A4A, but shows a weak correlation with M1 macrophage markers. A previous study confirmed that high expression of ZEB1 induces polarization of TAMs and promotes ovarian tumor growth [30]. We hypothesize that up-regulated CXCR4 and ZEB1 promotes M2 polarization of TAMs and promotes growth and progression of PAAD. Earlier studies have shown that activated Tregs suppress antitumor immunity and promote tumor survival [31]. In this study, Treg markers such as FOXP3, CCR8 and STAT5B show a positive correlation with the mRNA levels of CXCR4 and ZEB1. This suggests that CXCR4 and ZEB1 expression levels may indicate Treg activity in the tumor microenvironment. Santagata S et al. reported that the tumor suppressive activity of Tregs could be reversed by CXCR4 inhibition in renal cancer cells [32]. Our results suggest that the high expression level of these two hub genes may contribute to recruitment and activation of Tregs in the PAAD microenvironment.
High expression of CXCR4 and ZEB1 correlates positively with critical immune checkpoint proteins such as PD-1, CTLA4 and TIM-3. This suggests that high expression of CXCR4 and ZEB1 may induce T cell exhaustion and promote immune escape. Consistent with this hypothesis, Seo et al. reported that dual blockade of the PD-1 and CXCR4 pathways facilitates PAAD cell apoptosis via CD8+ T cells [33]. Garg et al. reported that NF-κB activity in pancreatic stellate cells induces high expression of CXCL12, a ligand of CXCR4, and this prevents the tumor infiltration of cytotoxic T cells and impairs their ability to kill tumor cells [34]. Furthermore, CXCR4 inhibitor in combination with an immune-activating fusion protein called VIC-008 suppresses mesothelioma growth by inhibiting PD-1 expression in CD8+ T cells and promotes transition of Tregs into T helper cells [35]. The upregulation of PD-1 and TIM-3 on CD4+ and CD8+ T cells restricts T cell responses in patients with PAAD [36].
In summary, our study demonstrates that circRNAs regulate PAAD by modulating the expression of the hub genes via the ceRNA network. Furthermore, the ceRNA network involving circ-UBAP2, hsa-miR-494 and the 5 hub genes, especially for CXCR4 and ZEB1, regulates PAAD by modulating the tumor infiltration of immune cells.
Materials and Methods
Microarray data
In this study, the microarray data of circRNA was obtained from the GSE79634 and GSE69362 datasets. The GSE79634 dataset was based on the GPL19978 platform and included 20 PAAD and adjacent normal tissue samples each. The GSE69362 dataset was based on the GPL19978 platform and contained 6 PAAD and adjacent normal tissue samples each. The microarray data of miRNA was obtained from the GSE60980 (GPL15159) dataset and included 51 PAAD and 6 normal samples. The microarray data of mRNA was obtained from the GSE60980 (GPL14550) dataset and included 49 PAAD and 12 normal samples.
Identification of DEcircRNAs, DEmiRNAs and DEmRNAs
The expression of cicrRNAs in the GSE79634 and GSE69362 datasets was normalized in quantile method, and the DEcircRNAs were determined using the "limma" package [37]. P values < 0.05 and |log FC| ≥ 1 were defined as statistically significant. Furthermore, to enhance the accuracy of the results, the DEcircRNAs were analyzed using the Venn diagram software (http://bioinformatics.psb.ugent.be/webtools/Venn/), and the intersections between the various DEcircRNAs were calculated. We used a similar strategy to analyze the differential expression of the miRNAs in GSE60980 (GPL15159) and the mRNAs in GSE60980 (GPL14550).
Construction of the circRNA-miRNA-mRNA network
To construct the circRNA-miRNA-mRNA network, we obtained basic information regarding the circRNAs, including their chromosomal locations from the circBase (http://www.circbase.org) [38]. We then used the cancer-specific circRNA database (CSCD) [39] to establish a circRNA-miRNA network associated with pancreatic tumorigenesis based on the intersection between the circRNA-miRNA pairs and the DEmiRNAs. We also downloaded all the available information of the circRNAs from the CSCD, including the number and the position of the microRNA response element (MRE), the RNA binding protein (RBP) and the open reading frame (ORF). Next, we obtained the miRNA-predicted mRNA pairs from the miRDB, miRTarBase and TargetScan databases, and made an intersection between the predicted mRNAs and the DEmRNAs to construct a miRNA-mRNA network related to pancreatic tumorigenesis. In the three databases, these predicted miRNA-mRNA pairs are validated experimentally by reporter assay, western blot, microarray and next-generation sequencing experiments. Only pairs existed in at least 2 out of 3 databases mentioned before were thought stable and would be included in the present study [40–42]. Finally, we constructed a visual display of the circRNA-miRNA-mRNA network using the Cytoscape software [43].
Analysis of DEmRNAs
We performed GO enrichment analysis of the DEmRNAs to identify biological processes involved in pancreatic tumorigenesis using DAVID (version 6.8, Database for Annotation, Visualization and Integrated Discovery, https://david.ncifcrf.gov/) [44].
KEGG enrichment analysis was performed by the Gene Set Enrichment Analysis (GSEA) method using the "clusterprofiler" package [45]. Biological processes (BP) and KEGG pathways with a P value < 0.05 were considered statistically significant and visualized as a Sankey plot using the "ggalluvial" package [46].
Identification and validation of the hub genes
We analyzed the relative importance of the DEmRNAs using the STRING database (https://string-db.org/) [47], which contains 9,643,763 proteins from 2,031 organisms and 1,380,838,440 interactions. We constructed the PPI network using the Cytoscape software. The genes were ranked using the cytoHubba plug-in in Cytoscape [48]. We identified the hub genes by integrating the results of the GO, KEGG and PPI network analyses. The expression of 4 circRNAs (circ-HIBADH, circ-UBAP2, circ-TADA2A, and circ-CLEC17A), 3 miRNAs (has-miR-214, has-mir-324-3p, and has-miR-494) and 5 hub genes (CXCR4,HIF1A, ZEB1, SDC1 and TWIST1) were compared between the PAAD and the normal pancreatic tissues from the GEO dataset. The GEPIA (http://gepia.cancer-pku.cn/) [49] and THPA database (https://www.proteinatlas.org) [50] were used to validate the transcript (mRNA) and the protein levels of the hub genes. Differentially expressed genes were identified by applying the criteria of |log 2 FC| > 1 and P value < 0.05. Moreover, we compared the expression of the four circRNAs in men and women using the GSE79634 database that provides gender-based information for PAAD patients.
Analysis of the hub genes
We plotted survival curve in KM plotter database (http://kmplot.com/analysis/) [51] to explore connections between overall survival (OS) and 5 hub genes (CXCR4, HIF1A, ZEB1, SDC1 and TWIST1) as well as 3 miRNAs (has-miR-214, has-mir-324-3p, and has-miR-494) in the ceRNA network. Parameters as follows: split patients by “auto select best cutoff”, follow up threshold = 36 months, cancer type: pancreatic ductal adenocarcinoma. Significant results with P value < 0.05 were recoded.
The hub genes in the ceRNA network were then analyzed by the TIMER database (https://cistrome.shinyapps.io/ timer/) [52] to detect immune cell infiltration using various immune markers. The gene modules identified tumor-infiltrating immune cells such as B cells, CD4+ T cells, CD8+ T cells, neutrophils, macrophages, and DCs. The correlation modules identified the gene markers for CD8+ T cells, T cells (general), B cells, monocytes, TAMs, M1 and M2 macrophages, neutrophils, NK cells, DCs cells, Th1 cells, Th2 cells, Tfhs, Th17s cells, Tregs, and exhausted T cells that were previously reported [53]. The power of the correlation was determined as follows: “0.00–0.19” indicated very weak, “0.20–0.39” indicated weak, “0.40–0.59” indicated moderate, “0.60–0.79” indicated strong, and “0.80–1.0” indicated very strong.
Supplementary Materials
Author Contributions
Conceptualization: WD. H, HM. P; Experiments: RJ. Z, JJ. N, S. L, LK. Y, JW. S, CY. Z, W. Z, SP. S; Data analysis: RJ. Z, SJ. J, H. L; Original draft writing: RJ. Z, WD. H; Review, editing, and final approval: RJ. Z, WD. H; Research supervision: WD. H, HM.P.
Conflicts of Interest
The authors declare that there are no conflicts of interest.
Funding
This work was supported by the grants from the Zhejiang Natural Sciences Foundation (LQ18H160008, LQ17H160011, and LY17H160029), the Ten Thousand Plan Youth Talent Support Program of Zhejiang Province, the Zhejiang Medical and Health Science and Technology Project (2016KYB290, 2016ZDB007, and 2017ZD021), the Zhejiang Medical Innovative Discipline Construction Project-2016, and the Hangzhou Health and Family planning and Science and Technology Project (OO20190347).
References
- 1. Bray F, Ferlay J, Soerjomataram I, Siegel RL, Torre LA, Jemal A. Global cancer statistics 2018: GLOBOCAN estimates of incidence and mortality worldwide for 36 cancers in 185 countries. CA Cancer J Clin. 2018; 68:394–424. https://doi.org/10.3322/caac.21492 [PubMed]
- 2. Aier I, Semwal R, Sharma A, Varadwaj PK. A systematic assessment of statistics, risk factors, and underlying features involved in pancreatic cancer. Cancer Epidemiol. 2019; 58:104–10. https://doi.org/10.1016/j.canep.2018.12.001 [PubMed]
- 3. Mahmood J, Shukla HD, Soman S, Samanta S, Singh P, Kamlapurkar S, Saeed A, Amin NP, Vujaskovic Z. Immunotherapy, Radiotherapy, and Hyperthermia: A Combined Therapeutic Approach in Pancreatic Cancer Treatment. Cancers (Basel). 2018; 10:469. https://doi.org/10.3390/cancers10120469 [PubMed]
- 4. Biancur DE, Kimmelman AC. The plasticity of pancreatic cancer metabolism in tumor progression and therapeutic resistance. Biochim Biophys Acta Rev Cancer. 2018; 1870:67–75. https://doi.org/10.1016/j.bbcan.2018.04.011 [PubMed]
- 5. Li Z, Tao Y, Wang X, Jiang P, Li J, Peng M, Zhang X, Chen K, Liu H, Zhen P, Zhu J, Liu X, Liu X. Tumor-Secreted Exosomal miR-222 Promotes Tumor Progression via Regulating P27 Expression and Re-Localization in Pancreatic Cancer. Cell Physiol Biochem. 2018; 51:610–29. https://doi.org/10.1159/000495281 [PubMed]
- 6. Chen S, Chen JZ, Zhang JQ, Chen HX, Qiu FN, Yan ML, Tian YF, Peng CH, Shen BY, Chen YL, Wang YD. Silencing of long noncoding RNA LINC00958 prevents tumor initiation of pancreatic cancer by acting as a sponge of microRNA-330-5p to down-regulate PAX8. Cancer Lett. 2019; 446:49–61. https://doi.org/10.1016/j.canlet.2018.12.017 [PubMed]
- 7. Bolha L, Ravnik-Glavač M, Glavač D. Circular RNAs: Biogenesis, Function, and a Role as Possible Cancer Biomarkers. Int J Genomics. 2017; 2017:6218353. https://doi.org/10.1155/2017/6218353 [PubMed]
- 8. Sanger HL, Klotz G, Riesner D, Gross HJ, Kleinschmidt AK. Viroids are single-stranded covalently closed circular RNA molecules existing as highly base-paired rod-like structures. Proc Natl Acad Sci USA. 1976; 73:3852–56. https://doi.org/10.1073/pnas.73.11.3852 [PubMed]
- 9. Wang Y, Mo Y, Gong Z, Yang X, Yang M, Zhang S, Xiong F, Xiang B, Zhou M, Liao Q, Zhang W, Li X, Li X, et al. Circular RNAs in human cancer. Mol Cancer. 2017; 16:25. https://doi.org/10.1186/s12943-017-0598-7 [PubMed]
- 10. Chen S, Zhao Y. Circular RNAs: Characteristics, function, and role in human cancer. Histol Histopathol. 2018; 33:887–93. https://doi.org/10.14670/HH-11-969 [PubMed]
- 11. Li J, Li Z, Jiang P, Peng M, Zhang X, Chen K, Liu H, Bi H, Liu X, Li X. Circular RNA IARS (circ-IARS) secreted by pancreatic cancer cells and located within exosomes regulates endothelial monolayer permeability to promote tumor metastasis. J Exp Clin Cancer Res. 2018; 37:177. https://doi.org/10.1186/s13046-018-0822-3 [PubMed]
- 12. Zhong Y, Du Y, Yang X, Mo Y, Fan C, Xiong F, Ren D, Ye X, Li C, Wang Y, Wei F, Guo C, Wu X, et al. Circular RNAs function as ceRNAs to regulate and control human cancer progression. Mol Cancer. 2018; 17:79. https://doi.org/10.1186/s12943-018-0827-8 [PubMed]
- 13. Feng C, Li Y, Lin Y, Cao X, Li D, Zhang H, He X. CircRNA-associated ceRNA network reveals ErbB and Hippo signaling pathways in hypopharyngeal cancer. Int J Mol Med. 2019; 43:127–42. https://doi.org/10.3892/ijmm.2018.3942 [PubMed]
- 14. Gardian K, Janczewska S, Durlik M. Microenvironment elements involved in the development of pancreatic cancer tumor. Gastroenterol Res Pract. 2012; 2012:585674. https://doi.org/10.1155/2012/585674 [PubMed]
- 15. Qu S, Song W, Yang X, Wang J, Zhang R, Zhang Z, Zhang H, Li H. Microarray expression profile of circular RNAs in human pancreatic ductal adenocarcinoma. Genom Data. 2015; 5:385–87. https://doi.org/10.1016/j.gdata.2015.07.017 [PubMed]
- 16. Guo S, Xu X, Ouyang Y, Wang Y, Yang J, Yin L, Ge J, Wang H. Microarray expression profile analysis of circular RNAs in pancreatic cancer. Mol Med Rep. 2018; 17:7661–71. https://doi.org/10.3892/mmr.2018.8827 [PubMed]
- 17. Fujioka S, Sclabas GM, Schmidt C, Niu J, Frederick WA, Dong QG, Abbruzzese JL, Evans DB, Baker C, Chiao PJ. Inhibition of constitutive NF-kappa B activity by I kappa B alpha M suppresses tumorigenesis. Oncogene. 2003; 22:1365–70. https://doi.org/10.1038/sj.onc.1206323 [PubMed]
- 18. Xue R, Meng Q, Lu D, Liu X, Wang Y, Hao J. Mitofusin2 Induces Cell Autophagy of Pancreatic Cancer through Inhibiting the PI3K/Akt/mTOR Signaling Pathway. Oxid Med Cell Longev. 2018; 2018:2798070. https://doi.org/10.1155/2018/2798070 [PubMed]
- 19. Garg B, Giri B, Majumder K, Dudeja V, Banerjee S, Saluja A. Modulation of post-translational modifications in β-catenin and LRP6 inhibits Wnt signaling pathway in pancreatic cancer. Cancer Lett. 2017; 388:64–72. https://doi.org/10.1016/j.canlet.2016.11.026 [PubMed]
- 20. Wang S, Li Q, Wang Y, Li X, Wang R, Kang Y, Xue X, Meng R, Wei Q, Feng X. Upregulation of circ-UBAP2 predicts poor prognosis and promotes triple-negative breast cancer progression through the miR-661/MTA1 pathway. Biochem Biophys Res Commun. 2018; 505:996–1002. https://doi.org/10.1016/j.bbrc.2018.10.026 [PubMed]
- 21. Zhang H, Wang G, Ding C, Liu P, Wang R, Ding W, Tong D, Wu D, Li C, Wei Q, Zhang X, Li D, Liu P, et al. Increased circular RNA UBAP2 acts as a sponge of miR-143 to promote osteosarcoma progression. Oncotarget. 2017; 8:61687–97. https://doi.org/10.18632/oncotarget.18671 [PubMed]
- 22. Wang J, Wang H, Cai J, Du S, Xin B, Wei W, Zhang T, Shen X. Artemin regulates CXCR4 expression to induce migration and invasion in pancreatic cancer cells through activation of NF-κB signaling. Exp Cell Res. 2018; 365:12–23. https://doi.org/10.1016/j.yexcr.2018.02.008 [PubMed]
- 23. Shen PF, Chen XQ, Liao YC, Chen N, Zhou Q, Wei Q, Li X, Wang J, Zeng H. MicroRNA-494-3p targets CXCR4 to suppress the proliferation, invasion, and migration of prostate cancer. Prostate. 2014; 74:756–67. https://doi.org/10.1002/pros.22795 [PubMed]
- 24. Song L, Liu D, Wang B, He J, Zhang S, Dai Z, Ma X, Wang X. miR-494 suppresses the progression of breast cancer in vitro by targeting CXCR4 through the Wnt/β-catenin signaling pathway. Oncol Rep. 2015; 34:525–31. https://doi.org/10.3892/or.2015.3965 [PubMed]
- 25. Yang Y, Tao X, Li CB, Wang CM. MicroRNA-494 acts as a tumor suppressor in pancreatic cancer, inhibiting epithelial-mesenchymal transition, migration and invasion by binding to SDC1. Int J Oncol. 2018; 53:1204–14. https://doi.org/10.3892/ijo.2018.4445 [PubMed]
- 26. Liu H, Wang H, Liu X, Yu T. miR-1271 inhibits migration, invasion and epithelial-mesenchymal transition by targeting ZEB1 and TWIST1 in pancreatic cancer cells. Biochem Biophys Res Commun. 2016; 472:346–52. https://doi.org/10.1016/j.bbrc.2016.02.096 [PubMed]
- 27. Cao TH, Ling X, Chen C, Tang W, Hu DM, Yin GJ. Role of miR-214-5p in the migration and invasion of pancreatic cancer cells. Eur Rev Med Pharmacol Sci. 2018; 22:7214–21. https://doi.org/10.26355/eurrev_201811_16255 [PubMed]
- 28. Wang X, Luo G, Zhang K, Cao J, Huang C, Jiang T, Liu B, Su L, Qiu Z. Hypoxic Tumor-Derived Exosomal miR-301a Mediates M2 Macrophage Polarization via PTEN/PI3Kγ to Promote Pancreatic Cancer Metastasis. Cancer Res. 2018; 78:4586–98. https://doi.org/10.1158/0008-5472.CAN-17-3841 [PubMed]
- 29. McDonald PC, Chafe SC, Brown WS, Saberi S, Swayampakula M, Venkateswaran G, Nemirovsky O, Gillespie JA, Karasinska JM, Kalloger SE, Supuran CT, Schaeffer DF, Bashashati A, et al. Regulation of pH by Carbonic Anhydrase 9 Mediates Survival of Pancreatic Cancer Cells With Activated KRAS in Response to Hypoxia. Gastroenterology. 2019; 157:823–37. https://doi.org/10.1053/j.gastro.2019.05.004 [PubMed]
- 30. Cortés M, Sanchez-Moral L, de Barrios O, Fernández-Aceñero MJ, Martínez-Campanario MC, Esteve-Codina A, Darling DS, Győrffy B, Lawrence T, Dean DC, Postigo A. Tumor-associated macrophages (TAMs) depend on ZEB1 for their cancer-promoting roles. EMBO J. 2017; 36:3336–55. https://doi.org/10.15252/embj.201797345 [PubMed]
- 31. Rani A, Murphy JJ. STAT5 in Cancer and Immunity. J Interferon Cytokine Res. 2016; 36:226–37. https://doi.org/10.1089/jir.2015.0054 [PubMed]
- 32. Santagata S, Napolitano M, D’Alterio C, Desicato S, Maro SD, Marinelli L, Fragale A, Buoncervello M, Persico F, Gabriele L, Novellino E, Longo N, Pignata S, et al. Targeting CXCR4 reverts the suppressive activity of T-regulatory cells in renal cancer. Oncotarget. 2017; 8:77110–20. https://doi.org/10.18632/oncotarget.20363 [PubMed]
- 33. Seo YD, Jiang X, Sullivan KM, Jalikis FG, Smythe KS, Abbasi A, Vignali M, Park JO, Daniel SK, Pollack SM, Kim TS, Yeung R, Crispe IN, et al. Mobilization of CD8+ T Cells via CXCR4 Blockade Facilitates PD-1 Checkpoint Therapy in Human Pancreatic Cancer. Clin Cancer Res. 2019; 25:3934–45. https://doi.org/10.1158/1078-0432.CCR-19-0081 [PubMed]
- 34. Garg B, Giri B, Modi S, Sethi V, Castro I, Umland O, Ban Y, Lavania S, Dawra R, Banerjee S, Vickers S, Merchant NB, Chen SX, et al. NFκB in Pancreatic Stellate Cells Reduces Infiltration of Tumors by Cytotoxic T Cells and Killing of Cancer Cells, via Up-regulation of CXCL12. Gastroenterology. 2018; 155:880–891.e8. https://doi.org/10.1053/j.gastro.2018.05.051 [PubMed]
- 35. Li B, Zeng Y, Reeves PM, Ran C, Liu Q, Qu X, Liang Y, Liu Z, Yuan J, Leblanc PR, Ye Z, Sluder AE, Gelfand JA, et al. AMD3100 Augments the Efficacy of Mesothelin-Targeted, Immune-Activating VIC-008 in Mesothelioma by Modulating Intratumoral Immunosuppression. Cancer Immunol Res. 2018; 6:539–51. https://doi.org/10.1158/2326-6066.CIR-17-0530 [PubMed]
- 36. Shindo Y, Hazama S, Suzuki N, Iguchi H, Uesugi K, Tanaka H, Aruga A, Hatori T, Ishizaki H, Umeda Y, Fujiwara T, Ikemoto T, Shimada M, et al. Predictive biomarkers for the efficacy of peptide vaccine treatment: based on the results of a phase II study on advanced pancreatic cancer. J Exp Clin Cancer Res. 2017; 36:36. https://doi.org/10.1186/s13046-017-0509-1 [PubMed]
- 37. Ritchie ME, Phipson B, Wu D, Hu Y, Law CW, Shi W, Smyth GK. limma powers differential expression analyses for RNA-sequencing and microarray studies. Nucleic Acids Res. 2015; 43:e47. https://doi.org/10.1093/nar/gkv007 [PubMed]
- 38. Glažar P, Papavasileiou P, Rajewsky N. circBase: a database for circular RNAs. RNA. 2014; 20:1666–70. https://doi.org/10.1261/rna.043687.113 [PubMed]
- 39. Xia S, Feng J, Chen K, Ma Y, Gong J, Cai F, Jin Y, Gao Y, Xia L, Chang H, Wei L, Han L, He C. CSCD: a database for cancer-specific circular RNAs. Nucleic Acids Res. 2018; 46:D925–29. https://doi.org/10.1093/nar/gkx863 [PubMed]
- 40. Agarwal V, Bell GW, Nam JW, Bartel DP. Predicting effective microRNA target sites in mammalian mRNAs. eLife. 2015; 4:e05005. https://doi.org/10.7554/eLife.05005 [PubMed]
- 41. Chou CH, Shrestha S, Yang CD, Chang NW, Lin YL, Liao KW, Huang WC, Sun TH, Tu SJ, Lee WH, Chiew MY, Tai CS, Wei TY, et al. miRTarBase update 2018: a resource for experimentally validated microRNA-target interactions. Nucleic Acids Res. 2018; 46:D296–302. https://doi.org/10.1093/nar/gkx1067 [PubMed]
- 42. Wang X. Improving microRNA target prediction by modeling with unambiguously identified microRNA-target pairs from CLIP-ligation studies. Bioinformatics. 2016; 32:1316–22. https://doi.org/10.1093/bioinformatics/btw002 [PubMed]
- 43. Shannon P, Markiel A, Ozier O, Baliga NS, Wang JT, Ramage D, Amin N, Schwikowski B, Ideker T. Cytoscape: a software environment for integrated models of biomolecular interaction networks. Genome Res. 2003; 13:2498–504. https://doi.org/10.1101/gr.1239303 [PubMed]
- 44. Huang W, Sherman BT, Lempicki RA. Systematic and integrative analysis of large gene lists using DAVID bioinformatics resources. Nat Protoc. 2009; 4:44–57. https://doi.org/10.1038/nprot.2008.211 [PubMed]
- 45. Yu G, Wang LG, Han Y, He QY. clusterProfiler: an R package for comparing biological themes among gene clusters. OMICS. 2012; 16:284–87. https://doi.org/10.1089/omi.2011.0118 [PubMed]
- 46. Brunson JC. ggalluvial: Alluvial Diagrams in 'ggplot2'. 2019.
- 47. Szklarczyk D, Morris JH, Cook H, Kuhn M, Wyder S, Simonovic M, Santos A, Doncheva NT, Roth A, Bork P, Jensen LJ, von Mering C. The STRING database in 2017: quality-controlled protein-protein association networks, made broadly accessible. Nucleic Acids Res. 2017; 45:D362–68. https://doi.org/10.1093/nar/gkw937 [PubMed]
- 48. Chin CH, Chen SH, Wu HH, Ho CW, Ko MT, Lin CY. cytoHubba: identifying hub objects and sub-networks from complex interactome. BMC Syst Biol. 2014 (Suppl 4); 8:S11. https://doi.org/10.1186/1752-0509-8-S4-S11 [PubMed]
- 49. Tang Z, Li C, Kang B, Gao G, Li C, Zhang Z. GEPIA: a web server for cancer and normal gene expression profiling and interactive analyses. Nucleic Acids Res. 2017; 45:W98–102. https://doi.org/10.1093/nar/gkx247 [PubMed]
- 50. Uhlen M, Zhang C, Lee S, Sjöstedt E, Fagerberg L, Bidkhori G, Benfeitas R, Arif M, Liu Z, Edfors F, Sanli K, von Feilitzen K, Oksvold P, et al. A pathology atlas of the human cancer transcriptome. Science. 2017; 357:eaan2507. https://doi.org/10.1126/science.aan2507 [PubMed]
- 51. Lánczky A, Nagy Á, Bottai G, Munkácsy G, Szabó A, Santarpia L, Győrffy B. miRpower: a web-tool to validate survival-associated miRNAs utilizing expression data from 2178 breast cancer patients. Breast Cancer Res Treat. 2016; 160:439–46. https://doi.org/10.1007/s10549-016-4013-7 [PubMed]
- 52. Li T, Fan J, Wang B, Traugh N, Chen Q, Liu JS, Li B, Liu XS. TIMER: A Web Server for Comprehensive Analysis of Tumor-Infiltrating Immune Cells. Cancer Res. 2017; 77:e108–10. https://doi.org/10.1158/0008-5472.CAN-17-0307 [PubMed]
- 53. Pan JH, Zhou H, Cooper L, Huang JL, Zhu SB, Zhao XX, Ding H, Pan YL, Rong L. LAYN Is a Prognostic Biomarker and Correlated With Immune Infiltrates in Gastric and Colon Cancers. Front Immunol. 2019; 10:6. https://doi.org/10.3389/fimmu.2019.00006 [PubMed]