


Introduction
Glioma is the most common primary tumor of the central nervous system, with an average annual age-adjusted incidence rate of 6.0 per 100,000 in the United States from 2010 to 2014 [1]. According to the 2016 World Health Organization (WHO) classification, glioblastoma (GBM), corresponding to grade IV glioma, is the most commonly occurring type of glioma [2]. Despite considerable advances in the development of treatments for GBM, including surgery, radiotherapy, chemotherapy, targeted therapy, and immunotherapy, the optimal management strategy remains controversial [3]. Notably, GBM patients generally exhibit significant morbidity and mortality, with a 5-year overall survival (OS) rate of approximately 5% [1]. Clinicopathologic parameters, including age and resection extent, and various molecular alterations have been reported as the prognostic factors for GBM in the literature [4–6]. Although numerous clinical and molecular studies in GBM have been reported in recent years, the prognostic biomarkers and predictors of therapeutic responses for GBM are still not clearly elucidated.
Autophagy is a lysosomal degradation pathway that is essential for survival, differentiation, development, and homeostasis [7] and has been reported to play a key role in diverse pathologies, especially cancer [8]. By eliminating damaged proteins and organelles, autophagy can suppress early-stage development of cancer, thereby mitigating cellular damage and limiting chromosomal instability [9, 10]. However, autophagy can also promote tumor growth by providing nutritional elements under low oxygen and low nutrient conditions [11]. In most cases, autophagy is thought to suppress early tumorigenesis and promote the development of existing tumors [12]. Previous studies have investigated the roles of certain autophagy-related genes (ATGs) in the development and progression of glioma. These ATGs may be regulated by—and, in turn, regulate—multiple signaling pathways, many of which are dysregulated in GBM and targetable with various inhibitors [12, 13]. Therefore, ATGs are promising therapeutic targets and prognostic predictors in GBM.
With the rapid development of large-scale genome-sequencing technologies, numerous studies have investigated large numbers of molecular biomarkers for GBM, including 1p/19q codeletion, telomerase reverse transcriptase (TERT) promoter mutations, tumor protein 53 (TP53) mutations, X-linked helicase II (ATRX) mutations, and isocitrate dehydrogenase (IDH) mutation [14–16]. Emerging evidence demonstrates that certain single genes cannot completely represent the characteristics of tumors, whereas global gene expression patterns of multiple genes can serve as excellent molecular biomarkers that allow early diagnosis, subgroup classification, risk stratification, prognosis prediction, and therapeutic targeting in GBM [17–19]. However, global expression patterns based on ATGs have not previously been recognized in GBM.
In this study, by assessing the global gene expression profile, we aimed to investigate and validate an autophagy-related multiple gene expression signature that can predict prognosis and suggest therapeutic targets in GBM. Moreover, we combined both the autophagy signature and clinical parameters to establish a novel promising prognostic nomogram model with more accurate predictive ability than clinical risk factors for GBM patients.
Results
Identification of DE-ATGs and enrichment analysis
Following analysis of the TCGA GBM dataset using edgeR, a total of 13625 DEGs were identified in GBM and normal samples, and these genes are displayed in the volcano plot (Figure 1A). As shown by the Venn diagrams in Figure 1B, the seventy-two significant DE-ATGs (the intersection of the DEGs and ATGs) were selected for further analysis.
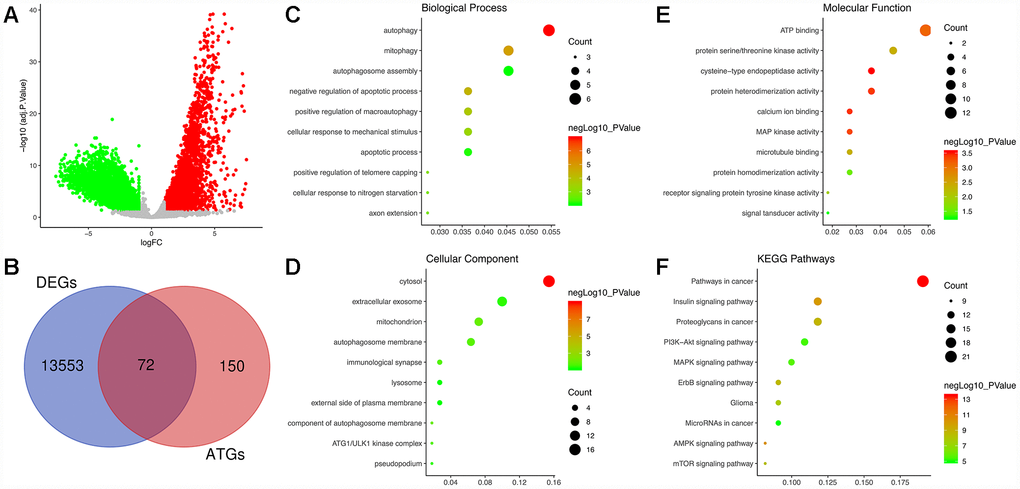
Figure 1. Identification of differentially expressed autophagy-related genes (DE-ATGs) in glioblastoma (GBM) and enrichment analysis. (A) Volcano plot of DEGs in tumor and normal samples of The Cancer Genome Atlas (TCGA) dataset. The vertical axis indicates the -log (adjusted P value [adj. P value]), and the horizontal axis indicates the log2 (fold change [FC]). The red dots represent upregulated genes, and the green dots represent downregulated genes (adj. P value <0.01 and |log2(FC)|>1). (B) Venn diagram showing the 72 DE-ATGs (the intersection of the DEGs and ATGs). (C) Biological processes enriched in the DE-ATGs. (D) Cellular components enriched in the DE-ATGs. (E) Molecular functions enriched in the DE-ATGs. (F) Kyoto Encyclopedia of Genes and Genomes (KEGG) pathways enriched in the DE-ATGs.
GO analysis, including the biological process (BP), cellular component (CC) and molecular function (MF) categories, was performed on the DE-ATGs. In the BP category, the DE-ATGs were significantly enriched in the terms autophagy, mitophagy and autophagosome assembly (Figure 1C). In the CC category, the DE-ATGs were significantly enriched in the terms cytosol, extracellular exosome, mitochondrion and autophagosome membrane (Figure 1D). In the MF category, the DE-ATGs were significantly enriched in the terms ATP binding, protein serine/threonine kinase activity, and cysteine-type endopeptidase activity (Figure 1E). In addition, KEGG pathway analysis revealed that the DE-ATGs were mainly enriched in pathways in cancer, insulin signaling pathway and proteoglycans in cancer.
Identification of prognosis-related ATGs
By performing univariate Cox regression analysis on the 72 candidate genes in the TCGA cohort consisting of 155 GBM patients, we identified 9 prognosis-related genes, which were indicated to have significant prognostic value (P<0.05). Subsequent multivariate Cox regression analysis indicated that only 3 genes—Neuregulin 1 (NRG1, HR 1.142, P=0.008), Integrin Subunit Alpha 3 (ITGA3, HR 1.149, P=0.043), and Microtubule-Associated Protein 1 Light Chain 3 Alpha (MAP1LC3A, HR 1.308, P=0.014)—exhibited significant prognostic value for GBM (Supplementary Table 1). The differential expression of the above three genes in tumor and normal tissues was further validated in the Gene Expression Profiling Interactive Analysis (GEPIA) database, which included 163 GBM samples and 207 normal samples, revealing that ITGA3 was significantly upregulated but NRG1 and MAP1LC3A were significantly downregulated in GBM tissues (Figure 2A–2C) [20]. Then, we analyzed the expression of the proteins encoded by the three genes using clinical specimens from the Human Protein Profiles (https://www.proteinatlas.org) [21]. MAP1LC3A was moderately positive but ITGA3 and NRG1 were weakly positive in GBM tissue relative to their expression levels in normal tissue (Figure 2D–2F). In addition, K-M survival curves were constructed to assess the associations between the expression levels of the prognosis-related genes and OS, and the results indicated that the ITGA3, NRG1 and MAP1LC3A low-expression group (log-rank P = 0.012, 0.012, and 0.047) had a better prognosis (Figure 2G–2I).
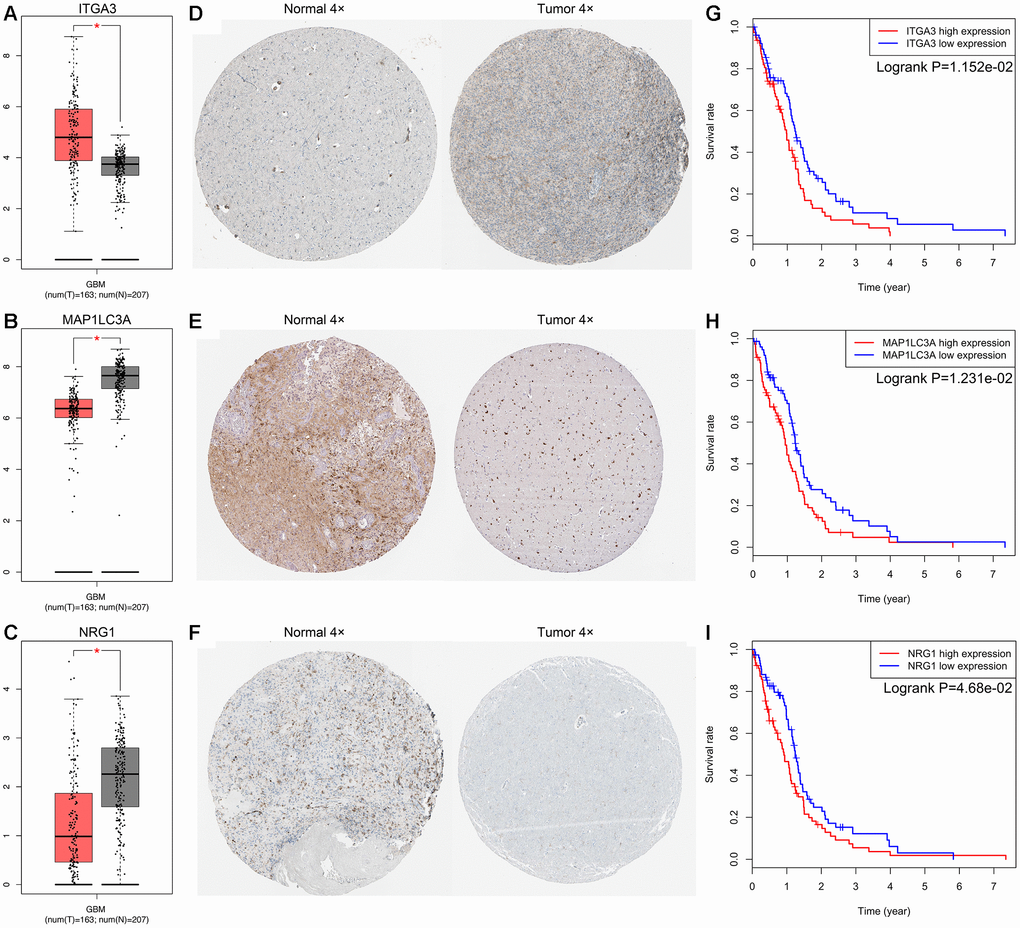
Figure 2. Expression and survival analysis for ITGA3, MAP1LC3A and NRG1 in GBM. The expression levels of ITGA3 (A), MAP1LC3A (B) and NRG1 (C) in tumor and normal tissues were validated in the GEPIA database, which included 163 GBM samples and 207 normal samples. The red box on the left was tumor group, and the gray box on the right was normal group. The expression profiles of the proteins encoded by ITGA3 (D), MAP1LC3A (E) and NRG1 (F) in normal and tumor tissues using clinical specimens from the Human Protein Profiles. K-M OS curves based on the expression levels of ITGA3 (G), MAP1LC3A (H) and NRG1 (I) in patients with GBM in the TCGA dataset.
Construction of the ATG-based prognostic risk score model (autophagy signature)
The prognostic risk score model was established with the following formula: risk score = expression level of NRG1 × 0.132 + expression level of ITGA3 × 0.139 + expression level of MAP1LC3A × 0.269. Subsequently, we calculated the prognostic risk score for each patient in the TCGA training set. All patients were divided into the high-risk (high risk score) or the low-risk (low risk score) group using the median risk score as the cutoff (Figure 3A). In addition, K-M survival analysis demonstrated that patients with high risk scores had significantly poorer OS than patients with low risk scores (log-rank P = 6.955×10⁻⁵). The 6-month OS rates of the high-risk and low-risk groups were 64.3% and 84.2%, respectively. The 1-year OS rates of the high-risk and low-risk groups were 39.5% and 73.4%, respectively. The 3-year OS rates of the high-risk and low-risk groups were 3.9% and 13.3%, respectively (Figure 4A). The C-index of the ATG-based prognostic model for OS prediction was 0.782 (95% CI, 0.743 to 0.821; P = 5.13×10⁻¹¹). Furthermore, the autophagy signature showed favorable predictive ability of the 0.5-, 1- and 3-year OS rates, with AUC values of 0.89, 0.84 and 0.78, respectively, in the TCGA training set (Figure 4B). In addition, when patients were stratified by different clinicopathologic parameters, the autophagy signature remained a significant prognostic factor in the TCGA training set and in the CGGA validation sets (Supplementary Figure 1).
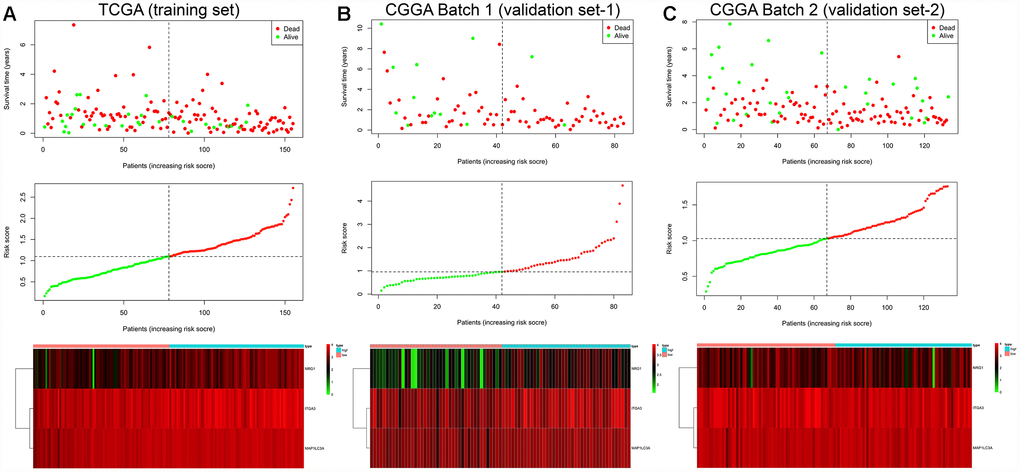
Figure 3. Risk score analysis of the GBM autophagy signature in the TCGA training cohort (A), CGGA Batch-1 validation cohort (B), and CGGA Batch-2 validation cohort (C). Upper panel: patient survival status and time distributed by risk score. Middle panel: risk score curve of the autophagy signature. Bottom panel: heatmap of NRG1, ITGA3, and MAP1LC3A expression in GBM samples. The colors from green to red indicate the expression level from low to high. The dotted line indicates the individual inflection point of the risk score curve, by which the patients were categorized into low-risk and high-risk groups.
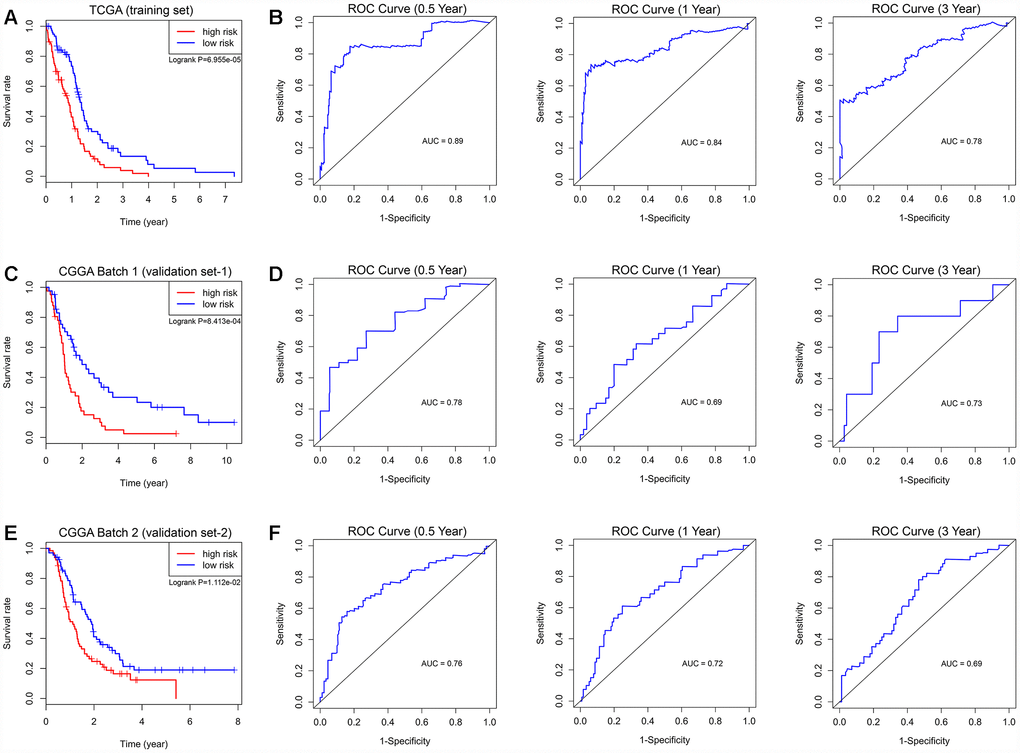
Figure 4. Survival analysis and prognostic performance of the autophagy-related risk score model in GBM. K-M survival curve of the risk score for patient OS in the TCGA training cohort (A), CGGA Batch-1 validation cohort (C), and CGGA Batch-2 validation cohort (E). The high-risk groups had significantly poorer OS rates than the low-risk groups. The prognostic performance of the autophagy signature demonstrated by the time-dependent ROC curve for predicting the 0.5-, 1-, and 3-year OS rates in the TCGA training cohort (B), CGGA Batch-1 validation cohort (D), and CGGA Batch-2 validation cohort (F).
Evaluation of the prognostic autophagy signature in external validation cohorts
To confirm that the prognostic autophagy signature had similar predictive values in different populations, we then used it to predict OS in two independent external validation cohorts using the median risk score as the cutoff. As shown in Figure 3B, a total of 83 patients in the CGGA Batch-1 set (validation set-1) were classified into a low-risk group (n = 42) and a high-risk group (n = 41), and the OS of the GBM patients in the high-risk group was significantly lower than that of the patients in the low-risk group (log-rank P = 8.413×10⁻⁴; Figure 4C). The autophagy signature constructed with the TCGA training set also showed a favorable predictive ability for the 0.5-, 1- and 3-year OS rates, with AUC values of 0.78, 0.69 and 0.73, respectively, in the CGGA validation set-1 (Figure 4D). In addition, as shown in Figure 3C, a total of 133 patients in the CGGA Batch-2 set (validation set-2) were classified into a low-risk group (n = 67) and a high-risk group (n = 66), and the OS of the GBM patients in the high-risk group was significantly lower than that of patients in the low-risk group (log-rank P = 1.112×10⁻²; Figure 4E). The autophagy signature generated by the TCGA training set also showed a favorable predictive ability for the 0.5-, 1- and 3-year OS rates, with AUC values of 0.76, 0.72 and 0.69, respectively, in the CGGA validation set-2 (Figure 4F).
Determination of the autophagy signature as an independent prognostic factor
Table 1 shows the demographics and clinicopathologic characteristics of GBM patients in the TCGA training cohort and CGGA validation cohorts based on the autophagy signature. Then, we performed univariate and multivariate Cox regression analyses to evaluate the prognostic significance of the autophagy signature combined with various clinicopathologic parameters (Table 2). In the TCGA training cohort, univariate analysis indicated that the autophagy signature (P = 9.54×10⁻⁵), age (P = 9.67×10⁻³), new event occurrence (P = 4.59×10⁻³), pharmacotherapy (P = 1.25×10⁻⁴), radiotherapy (P = 1.55×10⁻⁶) and IDH status (P = 8.39×10⁻³) were significantly associated with OS. Subsequent multivariate analysis indicated that the autophagy signature (P = 1.24×10⁻⁴), age (P = 0.028), pharmacotherapy (P = 0.030), radiotherapy (P = 6.36×10⁻⁵) and IDH status (P = 0.029) were significantly correlated with OS. Therefore, the prognostic autophagy signature constructed by the TCGA training set was an independent prognostic factor for GBM. In addition, following the univariate and multivariate analyses, the autophagy signature was also proven to be an independent prognostic factor in both the CGGA Batch-1 and Batch-2 validation cohorts (Table 2). The K-M survival curves and log-rank test for all these clinicopathological variables in the TCGA training set and CGGA validation sets are shown in Supplementary Figure 2.
Table 1. Demographics and clinicopathologic characteristics of GBM patients in the TCGA training cohort and CGGA validation cohort based on the autophagy signature.
| Variables | TCGA (Training set) | CGGA Batch 1 (Validation set-1) | CGGA Batch 2 (Validation set-2) | ||||||||||||||||||||||||||||||||||||||||||||||||||||||||||||||||||||||||||||||||||||||||||||||||
| Total (n=155) | Low risk (n=78) | High risk (n=77) | Total (n=83) | Low risk (n=42) | High risk (n=41) | Total (n=133) | Low risk (n=67) | High risk (n=66) | |||||||||||||||||||||||||||||||||||||||||||||||||||||||||||||||||||||||||||||||||||||||||||
| Age | |||||||||||||||||||||||||||||||||||||||||||||||||||||||||||||||||||||||||||||||||||||||||||||||||||
| <= 50 years | 38 | 24 | 14 | 40 | 22 | 18 | 54 | 28 | 26 | ||||||||||||||||||||||||||||||||||||||||||||||||||||||||||||||||||||||||||||||||||||||||||
| > 50 years | 117 | 54 | 63 | 43 | 20 | 23 | 79 | 39 | 40 | ||||||||||||||||||||||||||||||||||||||||||||||||||||||||||||||||||||||||||||||||||||||||||
| Sex | |||||||||||||||||||||||||||||||||||||||||||||||||||||||||||||||||||||||||||||||||||||||||||||||||||
| Female | 54 | 26 | 28 | 32 | 19 | 13 | 54 | 29 | 25 | ||||||||||||||||||||||||||||||||||||||||||||||||||||||||||||||||||||||||||||||||||||||||||
| Male | 101 | 52 | 49 | 51 | 23 | 28 | 79 | 38 | 41 | ||||||||||||||||||||||||||||||||||||||||||||||||||||||||||||||||||||||||||||||||||||||||||
| New event | |||||||||||||||||||||||||||||||||||||||||||||||||||||||||||||||||||||||||||||||||||||||||||||||||||
| None or NA | 66 | 30 | 36 | NA | NA | ||||||||||||||||||||||||||||||||||||||||||||||||||||||||||||||||||||||||||||||||||||||||||||||
| Yes | 89 | 48 | 41 | NA | NA | ||||||||||||||||||||||||||||||||||||||||||||||||||||||||||||||||||||||||||||||||||||||||||||||
| KPS | |||||||||||||||||||||||||||||||||||||||||||||||||||||||||||||||||||||||||||||||||||||||||||||||||||
| < 80 | 33 | 19 | 14 | NA | NA | ||||||||||||||||||||||||||||||||||||||||||||||||||||||||||||||||||||||||||||||||||||||||||||||
| >= 80 | 83 | 41 | 42 | NA | NA | ||||||||||||||||||||||||||||||||||||||||||||||||||||||||||||||||||||||||||||||||||||||||||||||
| NA | 39 | 18 | 21 | NA | NA | ||||||||||||||||||||||||||||||||||||||||||||||||||||||||||||||||||||||||||||||||||||||||||||||
| Pharmaceutical therapy | |||||||||||||||||||||||||||||||||||||||||||||||||||||||||||||||||||||||||||||||||||||||||||||||||||
| CT only | 65 | 34 | 31 | 23 (No) | 8 | 15 | 17 (No) | 11 | 6 | ||||||||||||||||||||||||||||||||||||||||||||||||||||||||||||||||||||||||||||||||||||||||||
| CT + TMT | 27 | 13 | 14 | 57 (Yes) | 32 | 25 | 111(Yes) | 54 | 57 | ||||||||||||||||||||||||||||||||||||||||||||||||||||||||||||||||||||||||||||||||||||||||||
| CT + HT | 21 | 14 | 7 | 3 (NA) | 2 | 1 | 5 (NA) | 2 | 3 | ||||||||||||||||||||||||||||||||||||||||||||||||||||||||||||||||||||||||||||||||||||||||||
| Others | 5 | 4 | 1 | - | - | ||||||||||||||||||||||||||||||||||||||||||||||||||||||||||||||||||||||||||||||||||||||||||||||
| No or NA | 37 | 13 | 24 | - | - | ||||||||||||||||||||||||||||||||||||||||||||||||||||||||||||||||||||||||||||||||||||||||||||||
| Radiation therapy | |||||||||||||||||||||||||||||||||||||||||||||||||||||||||||||||||||||||||||||||||||||||||||||||||||
| No | 23 | 7 | 16 | 10 | 6 | 4 | 17 | 9 | 7 | ||||||||||||||||||||||||||||||||||||||||||||||||||||||||||||||||||||||||||||||||||||||||||
| Yes | 125 | 66 | 59 | 70 | 34 | 36 | 113 | 56 | 57 | ||||||||||||||||||||||||||||||||||||||||||||||||||||||||||||||||||||||||||||||||||||||||||
| NA | 7 | 5 | 2 | 3 | 2 | 1 | 4 | 2 | 2 | ||||||||||||||||||||||||||||||||||||||||||||||||||||||||||||||||||||||||||||||||||||||||||
| Surgery | |||||||||||||||||||||||||||||||||||||||||||||||||||||||||||||||||||||||||||||||||||||||||||||||||||
| Biopsy only | 16 | 10 | 6 | NA | NA | ||||||||||||||||||||||||||||||||||||||||||||||||||||||||||||||||||||||||||||||||||||||||||||||
| Tumor resection | 139 | 68 | 71 | NA | NA | ||||||||||||||||||||||||||||||||||||||||||||||||||||||||||||||||||||||||||||||||||||||||||||||
| IDH status | |||||||||||||||||||||||||||||||||||||||||||||||||||||||||||||||||||||||||||||||||||||||||||||||||||
| Wildtype | 147 | 70 | 77 | 72 | 33 | 39 | 103 | 50 | 53 | ||||||||||||||||||||||||||||||||||||||||||||||||||||||||||||||||||||||||||||||||||||||||||
| Mutant | 8 | 8 | 0 | 11 | 9 | 2 | 30 | 17 | 13 | ||||||||||||||||||||||||||||||||||||||||||||||||||||||||||||||||||||||||||||||||||||||||||
| 1p/19q status | |||||||||||||||||||||||||||||||||||||||||||||||||||||||||||||||||||||||||||||||||||||||||||||||||||
| Non-codeletion | NA | 82 | 41 | 41 | 103 | 63 | 40 | ||||||||||||||||||||||||||||||||||||||||||||||||||||||||||||||||||||||||||||||||||||||||||||
| Codeletion | NA | 0 | 0 | 0 | 5 | 4 | 1 | ||||||||||||||||||||||||||||||||||||||||||||||||||||||||||||||||||||||||||||||||||||||||||||
| NA | NA | 1 | 1 | 0 | 25 | 0 | 25 | ||||||||||||||||||||||||||||||||||||||||||||||||||||||||||||||||||||||||||||||||||||||||||||
| NA, not available; KPS, Karnofsky performance score; CT, chemotherapy; TMT, targeted molecular therapy; HT, hormone therapy. | |||||||||||||||||||||||||||||||||||||||||||||||||||||||||||||||||||||||||||||||||||||||||||||||||||
| “New event” included progression and recurrence. “Others” in pharmaceutical therapy included CT + TMT + HT, CT + TMT + Immunotherapy, and CT + Immunotherapy. | |||||||||||||||||||||||||||||||||||||||||||||||||||||||||||||||||||||||||||||||||||||||||||||||||||
Table 2. Univariate and multivariate cox proportional hazards analysis of clinical parameters and risk score of GBM patients in the TCGA training cohort and CGGA validation cohorts.
| Variables | TCGA (Training set) | CGGA Batch 1 (Validation set-1) | CGGA Batch 2 (Validation set-2) | ||||||||||||||||||||||||||||||||||||||||||||||||||||||||||||||||||||||||||||||||||||||||||||||||
| Univariate Analysis | Multivariate analysis | Univariate Analysis | Multivariate analysis | Univariate Analysis | Multivariate analysis | ||||||||||||||||||||||||||||||||||||||||||||||||||||||||||||||||||||||||||||||||||||||||||||||
| HR (95% CI) | P | HR (95% CI) | P | HR (95% CI) | P | HR (95% CI) | P | HR (95% CI) | P | HR (95% CI) | P | ||||||||||||||||||||||||||||||||||||||||||||||||||||||||||||||||||||||||||||||||||||||||
| Age | |||||||||||||||||||||||||||||||||||||||||||||||||||||||||||||||||||||||||||||||||||||||||||||||||||
| <= 50 years | Reference | Reference | Reference | Reference | Reference | ||||||||||||||||||||||||||||||||||||||||||||||||||||||||||||||||||||||||||||||||||||||||||||||
| > 50 years | 1.80 (1.15–2.82) | 9.67e-3 | 1.31 (1.03–2.64) | 0.028 | 1.27 (1.09–2.04) | 0.032 | 1.28 (1.07–2.09) | 0.033 | 1.32 (0.88–1.98) | 0.18 | |||||||||||||||||||||||||||||||||||||||||||||||||||||||||||||||||||||||||||||||||||||||||
| Sex | |||||||||||||||||||||||||||||||||||||||||||||||||||||||||||||||||||||||||||||||||||||||||||||||||||
| Female | Reference | Reference | Reference | ||||||||||||||||||||||||||||||||||||||||||||||||||||||||||||||||||||||||||||||||||||||||||||||||
| Male | 0.96 (0.66–1.40) | 0.835 | 1.25 (0.76–2.05) | 0.389 | 0.83 (0.56–1.23) | 0.357 | |||||||||||||||||||||||||||||||||||||||||||||||||||||||||||||||||||||||||||||||||||||||||||||
| New event | |||||||||||||||||||||||||||||||||||||||||||||||||||||||||||||||||||||||||||||||||||||||||||||||||||
| None or NA | Reference | Reference | NA | NA | |||||||||||||||||||||||||||||||||||||||||||||||||||||||||||||||||||||||||||||||||||||||||||||||
| Yes | 0.59 (0.40–0.85) | 4.59e-3 | 0.78 (0.51–1.21) | 0.272 | NA | NA | |||||||||||||||||||||||||||||||||||||||||||||||||||||||||||||||||||||||||||||||||||||||||||||
| KPS | |||||||||||||||||||||||||||||||||||||||||||||||||||||||||||||||||||||||||||||||||||||||||||||||||||
| < 80 | Reference | NA | NA | ||||||||||||||||||||||||||||||||||||||||||||||||||||||||||||||||||||||||||||||||||||||||||||||||
| >= 80 | 0.77 (0.49–1.23) | 0.276 | NA | NA | |||||||||||||||||||||||||||||||||||||||||||||||||||||||||||||||||||||||||||||||||||||||||||||||
| NA | 0.89 (0.53–1.52) | 0.684 | NA | NA | |||||||||||||||||||||||||||||||||||||||||||||||||||||||||||||||||||||||||||||||||||||||||||||||
| Pharmaceutical therapy | |||||||||||||||||||||||||||||||||||||||||||||||||||||||||||||||||||||||||||||||||||||||||||||||||||
| CT only | Reference | Reference | (No) Reference | Reference | (No) Reference | Reference | |||||||||||||||||||||||||||||||||||||||||||||||||||||||||||||||||||||||||||||||||||||||||||||
| CT + TMT | 0.92 (0.54–1.55) | 0.743 | 0.94 (0.55–1.62) | 0.828 | (Yes) 0.39 (0.23–0.67) | 6.19e-4 | 0.41 (0.24–0.70) | 1.31e-3 | (Yes) 0.51 (0.28–0.92) | 0.026 | 0.81 (0.30–0.96) | 0.037 | |||||||||||||||||||||||||||||||||||||||||||||||||||||||||||||||||||||||||||||||||||||||
| CT + HT | 1.43 (0.84–2.44) | 0.190 | 1.41 (0.82-2.43) | 0.216 | (NA) 0.69 (0.20–2.36) | 0.558 | 0.85 (0.20–3.59) | 0.827 | (NA) 1.18 (0.33–4.20) | 0.794 | 2.06 (0.22–8.97) | 0.523 | |||||||||||||||||||||||||||||||||||||||||||||||||||||||||||||||||||||||||||||||||||||||
| Others | 1.14 (0.45-2.89) | 0.784 | 1.37 (0.75–2.50) | 0.260 | - | - | |||||||||||||||||||||||||||||||||||||||||||||||||||||||||||||||||||||||||||||||||||||||||||||
| No or NA | 2.47 (1.56–3.91) | 1.25e-4 | 1.73 (1.67–4.45) | 0.030 | - | - | |||||||||||||||||||||||||||||||||||||||||||||||||||||||||||||||||||||||||||||||||||||||||||||
| Radiation therapy | |||||||||||||||||||||||||||||||||||||||||||||||||||||||||||||||||||||||||||||||||||||||||||||||||||
| No | Reference | Reference | Reference | Reference | Reference | Reference | |||||||||||||||||||||||||||||||||||||||||||||||||||||||||||||||||||||||||||||||||||||||||||||
| Yes | 0.31 (0.19–0.50) | 1.55e-6 | 0.26 (0.13–0.50) | 6.36e-5 | 0.81 (0.50–0.94) | 0.049 | 0.78 (0.34–0.97) | 0.045 | 0.33 (0.18–0.61) | 4.72e-4 | 0.29 (0.10–0.82) | 0.019 | |||||||||||||||||||||||||||||||||||||||||||||||||||||||||||||||||||||||||||||||||||||||
| NA | 0.60 (0.24–1.50) | 0.275 | 0.44 (0.17–1.10) | 0.079 | 0.58 (0.40–6.19) | 0.513 | 0.58 (0.40–6.19) | 0.513 | 0.69 (0.15–3.08) | 0.622 | 0.31 (0.02–4.21) | 0.376 | |||||||||||||||||||||||||||||||||||||||||||||||||||||||||||||||||||||||||||||||||||||||
| Surgery | |||||||||||||||||||||||||||||||||||||||||||||||||||||||||||||||||||||||||||||||||||||||||||||||||||
| Biopsy only | Reference | NA | NA | ||||||||||||||||||||||||||||||||||||||||||||||||||||||||||||||||||||||||||||||||||||||||||||||||
| Tumor resection | 0.95 (0.53–1.69) | 0.852 | NA | NA | |||||||||||||||||||||||||||||||||||||||||||||||||||||||||||||||||||||||||||||||||||||||||||||||
| IDH status | |||||||||||||||||||||||||||||||||||||||||||||||||||||||||||||||||||||||||||||||||||||||||||||||||||
| Wildtype | Reference | Reference | Reference | Reference | Reference | ||||||||||||||||||||||||||||||||||||||||||||||||||||||||||||||||||||||||||||||||||||||||||||||
| Mutant | 0.26 (0.09–0.71) | 8.39e-3 | 0.28 (0.09–0.88) | 0.029 | 0.64 (0.32–1.30) | 0.218 | 0.43 (0.25–0.74) | 2.36e-3 | 0.40 (0.23–0.68) | 8.33e-4 | |||||||||||||||||||||||||||||||||||||||||||||||||||||||||||||||||||||||||||||||||||||||||
| 1p/19q status | |||||||||||||||||||||||||||||||||||||||||||||||||||||||||||||||||||||||||||||||||||||||||||||||||||
| Non-codeletion | NA | NA | Reference | ||||||||||||||||||||||||||||||||||||||||||||||||||||||||||||||||||||||||||||||||||||||||||||||||
| Codeletion | NA | NA | 0.77 (0.24–2.43) | 0.650 | |||||||||||||||||||||||||||||||||||||||||||||||||||||||||||||||||||||||||||||||||||||||||||||||
| NA | NA | NA | 1.11 (0.66–1.87) | 0.704 | |||||||||||||||||||||||||||||||||||||||||||||||||||||||||||||||||||||||||||||||||||||||||||||||
| Autophagy signature | |||||||||||||||||||||||||||||||||||||||||||||||||||||||||||||||||||||||||||||||||||||||||||||||||||
| Low risk | Reference | Reference | Reference | Reference | Reference | Reference | |||||||||||||||||||||||||||||||||||||||||||||||||||||||||||||||||||||||||||||||||||||||||||||
| High risk | 2.06 (1.43–2.96) | 9.54e-5 | 2.12 (1.45–3.12) | 1.24e-4 | 2.27 (1.39–3.72) | 1.12e-3 | 2.28 (1.35–3.86) | 0.002 | 1.66 (1.12–2.46) | 0.012 | 1.75 (1.17–2.61) | 0.006 | |||||||||||||||||||||||||||||||||||||||||||||||||||||||||||||||||||||||||||||||||||||||
| HR, hazard ratio; CI, confidence interval; NA, not available; KPS, Karnofsky performance score; CT, chemotherapy; TMT, targeted molecular therapy; HT, hormone therapy. | |||||||||||||||||||||||||||||||||||||||||||||||||||||||||||||||||||||||||||||||||||||||||||||||||||
| “New event” included progression and recurrence. “Others” in pharmaceutical therapy included CT + TMT + HT, CT + TMT + Immunotherapy, and CT + Immunotherapy. | |||||||||||||||||||||||||||||||||||||||||||||||||||||||||||||||||||||||||||||||||||||||||||||||||||
| All statistical tests were two-sided. | |||||||||||||||||||||||||||||||||||||||||||||||||||||||||||||||||||||||||||||||||||||||||||||||||||
GSEA
GSEA revealed that the DE-ATGs in the high ITGA3, MAP1LC3A, and NRG1 expression groups in the TCGA GBM cohort were mainly enriched in KEGG pathways related to autophagy and cancer. The significantly enriched autophagy-related pathways included regulation of autophagy, MAPK signaling pathway, endocytosis, and insulin signaling pathway. The significantly enriched cancer-related pathways included pathways in cancer, MAPK signaling pathway, mTOR signaling pathway, and glioma (Figure 5, Supplementary Table 2). In addition, GSEA was performed in the ATG-based high-risk and low-risk groups in the TCGA GBM cohort, and the DE-ATGs were also significantly enriched in the pathways related to autophagy and cancer. The DE-ATGs in the high-risk group were enriched mainly in the lysosome, cytokine-cytokine receptor interaction, and focal adhesion pathways. The DE-ATGs in the low-risk group were enriched mainly in MAPK signaling pathway, endocytosis, and insulin signaling pathway (Supplementary Figure 3, Supplementary Table 3). In summary, the defined DE-ATGs contribute to vital cancer and autophagy-related KEGG pathways, which can provide strong evidence for a cancer-targeted treatment for GBM.
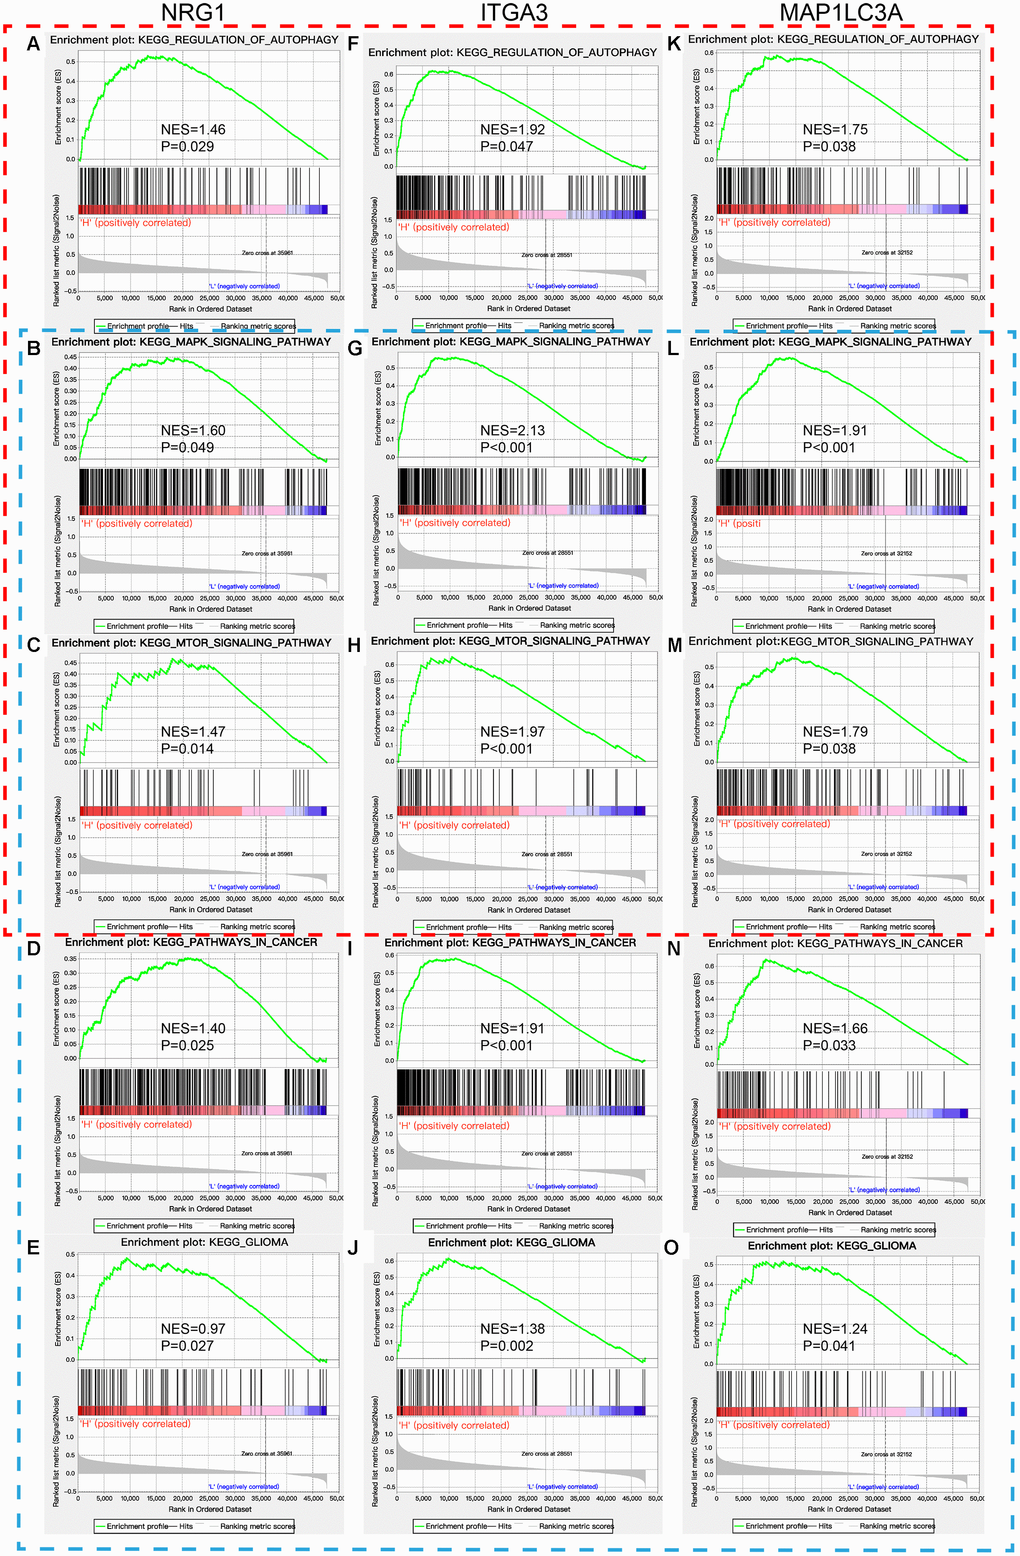
Figure 5. GSEA of NRG1, ITGA3, and MAP1LC3A in the TCGA GBM cohort. Red box: regulation of autophagy and autophagy-related KEGG pathways (A–C, F–H, and K–M). Blue box: pathways in cancer and their related KEGG pathways, including glioma (B–E, G–J, and L–O).
Construction and validation of the nomogram
To establish a clinically applicable method for predicting the prognosis of GBM patients, we established a prognostic nomogram to predict the survival probability at 0.5, 1, and 3 years based on the TCGA training set. Five independent prognostic parameters, including age, autophagy signature, pharmacotherapy, radiotherapy and IDH status, were enrolled in the prediction model (Figure 6A). The C-index of the nomogram was 0.832 (95% CI, 0.793 to 0.871; P = 3.013×10⁻¹⁰). The calibration plots (Figure 6B–6D) show excellent agreement between the nomogram prediction and actual observation in terms of the 0.5-, 1- and 3-year survival rates in the TCGA cohort. The nomogram also showed a favorable predictive ability for the 0.5-, 1- and 3-year OS rates, with AUC values of 0.807, 0.739 and 0.787, respectively (Supplementary Figure 4). These findings suggest the appreciable reliability of the nomogram. In addition, in the two CGGA external validation cohorts, the C-indexes of the nomogram for predicting OS were 0.737 and 0.721. The calibration plots also demonstrate excellent agreement between prediction and observation for the 0.5-, 1- and 3-year OS probabilities of the patients in CGGA Batch-1 (Figure 6E–6G) and Batch-2 (Figure 6H–6J). The AUC values demonstrated that the nomogram also has favorable predictive ability for the OS rates in the two CGGA validation cohorts (Supplementary Figure 4).
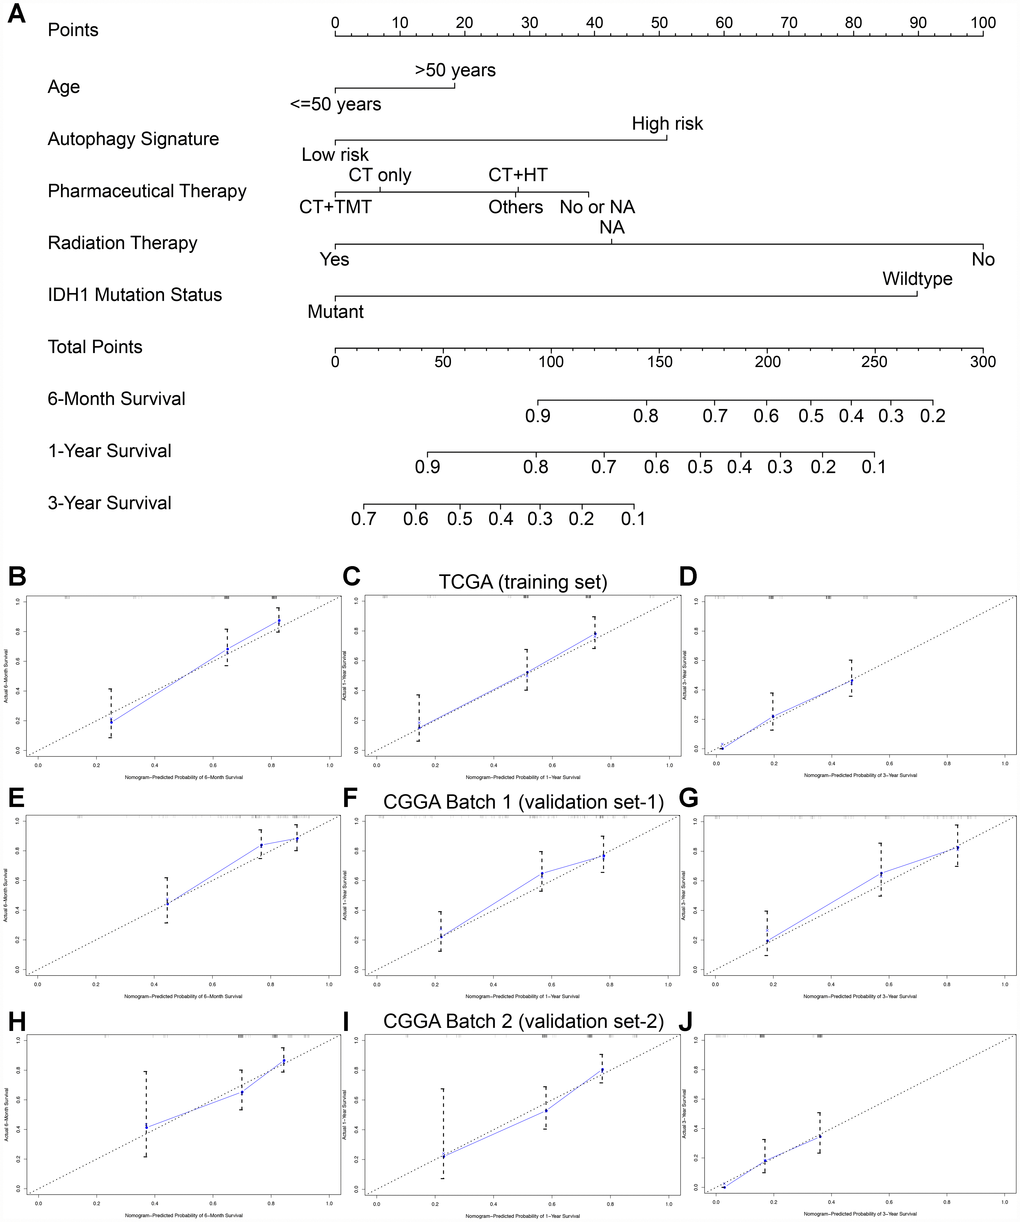
Figure 6. Nomogram to predict the 0.5-, 1-, and 3-year survival probability of patients with GBM. (A) Prognostic nomogram to predict the survival of GBM patients based on the TCGA training set. Calibration curves of the nomogram for predicting survival at 0.5, 1, and 3 years in the TCGA training cohort (B–D), CGGA Batch-1 validation cohort (E–G), and CGGA Batch-2 validation cohort (H–J). The actual survival is plotted on the y-axis; the nomogram-predicted probability is plotted on the x-axis.
Discussion
Autophagy has been reported to play a key role in tumorigenesis, progression aggressiveness, and therapeutic resistance of multiple cancers, especially glioma [8–10]. Correcting the dysregulation of autophagy-related pathways can suppress tumor growth and improve sensitivity to various therapies. Chang et al. [22] reported that honokiol-induced autophagy can promote apoptosis and inhibit GBM cell growth. Zhang et al. [23] reported that high expression of the ATG MAPK8IP1 and low expression of SH3GLB1 can suppress the proliferation, migration and invasion of glioma cells. In addition, most studies have focused more intensely on treatments of GBM targeting autophagy in recent years. Incorporation of the autophagy modulating drug temozolomide (TMZ) with concomitant radiotherapy significantly improved patient survival by inducing autophagy [12, 13]. Therefore, ATGs are promising therapeutic targets and prognostic predictors in GBM.
By leveraging advances in large-scale genome-sequencing technologies, numerous studies have investigated large numbers of molecular biomarkers for GBM [14–16]. Previous studies have investigated multiple gene expression patterns in GBM, which can be used for risk stratification, treatment guidance, and prognosis prediction [5, 6, 14–16]. However, global expression patterns based on ATGs have not been previously constructed in GBM. In this study, we first identified 72 DE-ATGs based on the TCGA database and then confirmed 3 genes significantly correlated with prognosis in univariate and multivariate Cox regression analyses. High expression levels of ITGA3, MAP1LC3A, and NRG1 were associated with poor prognosis in GBM patients. GSEA revealed that these 3 ATGs were mainly enriched in KEGG pathways related to autophagy and cancer, providing strong evidence that dysregulation of autophagy plays a vital role in the development and progression of GBM. NRG1, one of the most active members of the epidermal growth factor (EGF)-like family, encodes a membrane glycoprotein that mediates cell-cell signaling and plays a critical role in the growth and development of multiple organ systems [24]. An et al. [25] reported that NRG1 can inhibit doxorubicin-induced autophagy via multiple signaling pathways to prevent further damage from cardiomyopathy. Previous studies have demonstrated that NRG1 plays an important role in aspects of glioma development and progression, including cell survival, migration, proliferation, and metastasis [26, 27]. Recently, Yin et al. [28] investigated whether Nrg1 can regulate apoptosis and invasion in GBM via targeting by miR-125a-3p. ITGA3 encodes a preproprotein that is proteolytically processed to generate light and heavy chains that comprise the alpha 3 subunit [29, 30]. This subunit joins with a beta 1 subunit to form an integrin that functions as a cell surface adhesion molecule and interacts with extracellular matrix proteins. The literature reports that high expression of ITGA3 can promote proliferation, progression and invasion in various tumors, such as cholangiocarcinoma, thyroid carcinoma, pancreatic adenocarcinoma and glioma [31–33]. Fiscon et al. [33] demonstrated that ITGA3 was involved in ECM-receptor interactions and focal adhesion pathways and promoted the development and differentiation of GBM cells. MAP1LC3A encodes a light chain subunit that can associate with either MAP1A or MAP1B. MAP1A and MAP1B are microtubule-associated proteins that mediate the physical interactions between microtubules and components of the cytoskeleton. The expression of MAP1LC3A was reported to be suppressed in many tumor cell lines, suggesting that it may be involved in the carcinogenesis of multiple tumors, such as gastric cancer, esophageal squamous carcinoma, osteosarcoma, and glioma [34, 35]. Giatromanolaki et al. [35] reported that extensive expression of MAP1LC3A was observed in 43% of GBM samples and that upregulation of MAP1LC3A was associated with impaired autophagic activity, which may facilitate GBM carcinogenesis. In addition, Zhang et al. [36] indicated that the products of MAP1LC3A can serve as autophagic markers and indicate autophagic activity. This group used nanoparticles loaded with curcumin to initiate autophagy, which promoted antimigratory and anti-invasive effects on GBM. In summary, NRG1, ITGA3 and MAP1LC3A may serve as tumor inducers by regulating autophagy and apoptosis in GBM. These ATGs can be used as independent prognostic biomarkers and novel targets for guiding GBM therapy.
Then, we developed and validated a novel prognostic signature based on the expression of three ATGs that, compared with clinical risk factors, improves the ability to predict the survival of patients with GBM. According to the ATG-based risk score model, patients with GBM were divided into a high-risk group and a low-risk group. Patients with high risk scores had significantly poorer OS than patients with low risk scores. Therefore, more precise individualized treatment strategies for GBM patients with high risk scores can be established. These patients should receive more aggressive treatments and closer follow-up to detect recurrence.
Nomograms have been widely used in clinical practice for their intuitive visual presentation [37]. To our knowledge, this nomogram is the first to incorporate an autophagy-related signature for predicting the survival of GBM patients that was constructed and validated in large databases with long-term follow-up. In this study, we established a nomogram incorporating the autophagy signature, age, pharmacotherapy, radiotherapy, and IDH mutation status. Calibration plots based on the TCGA and CGGA databases indicated that actual survival corresponded closely with predicted survival, suggesting that the predictive performance of the nomogram was excellent. This visual scoring system could assist both physicians and patients in performing individualized survival predictions, which would facilitate the selection of better treatment options.
The present study has some limitations. First, the clinical information downloaded from the TCGA and CGGA databases was limited and incomplete. Detailed information about neuroimaging, resection extent, radiotherapy and chemotherapy were not enrolled in the nomogram. Second, the prediction model needs further validation in multicenter, large-scale clinical trials and prospective studies.
In conclusion, by assessing the global gene expression profile, we identified a reliable autophagy-related three-gene risk score model that has significant value in predicting the prognosis of GBM patients and could suggest therapeutic targets for GBM. Then, we established a novel promising prognostic nomogram model incorporating both the autophagy signature and clinical parameters for providing individualized survival prediction and facilitating the selection of better treatment strategies. Further studies in large-scale, multicenter and prospective clinical cohorts are needed to verify the prognostic model developed in this study.
Materials and Methods
Data retrieval and processing
The level 3 RNA sequencing data and clinical information of GBM patients were downloaded from The Cancer Genome Atlas (TCGA, https://portal.gdc.cancer.gov/) and the Chinese Glioma Genome Atlas (CGGA, http://www.cgga.org.cn) databases, respectively. The TCGA GBM cohort was selected as the training set and contained 155 tumor samples and 5 normal samples. The CGGA cohort was selected as the validation set; Batch-1 contained 83 GBM patients and Batch-2 contained 133 GBM patients. All patients without prognostic information were initially excluded. Because the data were obtained from TCGA and CGGA, approval for our study by the ethics committee was not necessary.
Construction and evaluation of the ATG-based prognostic risk score model
The schematic diagram for constructing the risk score model was shown in Supplementary Figure 5. Univariate Cox regression analysis was first performed on the DE-ATGs in the TCGA GBM training cohort to identify the association between the expression levels of the genes and patients' OS using the survival package (http://bioconductor.org/packages/survival/) in R 3.5.1 [44]. Then, genes with a P value of < 0.05 identified by univariate Cox regression were further screened by multivariate Cox regression. Based on the Akaike information criterion (AIC), the optimal prognosis-related genes were determined to establish a prognostic risk score model for predicting OS [45]. According to the median expression levels of the prognosis-related genes, patients were divided into high and low expression groups [46]. Then, Kaplan-Meier (K-M) survival analysis using the survival package was performed to estimate the associations between the expression levels of the prognosis-related genes and OS.
The prognostic risk score model was established with the following formula: risk score = expression level of Gene1 × β1 + expression level of Gene2 × β2 +…+ expression level of Genen × βn; where β is the regression coefficient calculated by the multivariate Cox regression model [46]. Subsequently, a prognostic risk score was generated for each patient. All TCGA GBM patients were divided into the high-risk (high risk score) and low-risk (low risk score) groups according to the median value of their risk score. Then, a K-M survival curve was constructed to estimate the prognosis of patients with high risk scores or low risk scores, and the survival differences between the high-risk and low-risk groups were assessed by a two-sided log-rank test. The prognostic performance was evaluated by using Harrell's concordance index (C-index) and time-dependent receiver operating characteristic (ROC) curve analysis within 0.5, 1 and 3 years to evaluate the predictive accuracy of the ATG-based prognostic model with the R packages ‘survcomp’ (http://www. bioconductor.org/packages/survcomp/) and ‘survivalROC’ (https://cran.r-project.org/web/packages/survivalROC/) [37, 47]. The values of both the C-index and area under the ROC curve (AUC) range from 0.5 to 1, with 1 indicating perfect discrimination and 0.5 indicating no discrimination. Then, the performance of the ATG-based risk score model constructed by the TCGA training set was validated in the CGGA Batch-1 and Batch-2 GBM cohorts via a similar approach.
Furthermore, to determine whether the predictive power of the ATG-based prognostic model could be independent of other clinicopathologic parameters (including age, sex, new event occurrence, pharmacotherapy, Karnofsky performance score (KPS), radiotherapy, surgery, IDH status and 1p/19q status) for patients with GBM, univariate and multivariate Cox proportional hazards regression analyses were performed in the TCGA training set and the two CGGA validation sets.
Gene set enrichment analysis (GSEA)
Gene expression levels were set as population phenotypes, and GSEA (http://software. broadinstitute.org/gsea/index.jsp) was used to assess related pathways and molecular mechanisms in GBM patients [48]. Enriched gene sets with a nominal P value of < 0.05 and a FDR of < 0.25 were considered statistically significant.
Construction and validation of the nomogram
Following univariate Cox regression analysis, all independent prognostic factors were screened by multivariate Cox regression analysis for the construction of a prognostic nomogram to assess the probability of 0.5-, 1-, and 3-year OS for TCGA GBM patients via the rms R package (https://cran.r-project. org/web/packages/rms/) [49]. The discrimination performance of the nomogram was quantitatively assessed by the C-index and the AUC [37]. Calibration plots were also used to graphically evaluate the discriminative ability of the nomogram [47]. Finally, the prognostic nomogram was externally validated in the CGGA Batch-1 and Batch-2 cohorts. All analyses were conducted using R version 3.5.1, and a P value of < 0.05 was considered statistically significant. Hazard ratios (HRs) and 95% confidence intervals (CIs) were reported if necessary.
Supplementary Materials
Author Contributions
LG, XG, and CF performed the data curation and analysis. KD and WL analyzed and interpreted the results. ZW and BX drafted and reviewed the manuscript. All authors read and approved the final manuscript.
Acknowledgments
Dr. Wang is grateful for the invaluable support received from his parents and, in particular, Prof. Bing Xing over the years.
Conflicts of Interest
The authors declare that the research was conducted in the absence of any commercial or financial relationships that could be construed as a potential conflict of interest.
Funding
This study was supported by the Chinese Academy of Medical Sciences (CAMS) Initiative for Innovative Medicine (CAMS-I2M) 2017-I2M-1-001.
References
- 1. Ostrom QT, Gittleman H, Liao P, Vecchione-Koval T, Wolinsky Y, Kruchko C, Barnholtz-Sloan JS. CBTRUS Statistical Report: primary brain and other central nervous system tumors diagnosed in the United States in 2010-2014. Neuro-oncol. 2017 (suppl_5); 19:v1–88. https://doi.org/10.1093/neuonc/nox158 [PubMed]
- 2. Wesseling P, Capper D. WHO 2016 Classification of gliomas. Neuropathol Appl Neurobiol. 2018; 44:139–50. https://doi.org/10.1111/nan.12432 [PubMed]
- 3. Sepúlveda-Sánchez JM, Muñoz Langa J, Arráez MA, Fuster J, Hernández Laín A, Reynés G, Rodríguez González V, Vicente E, Vidal Denis M, Gallego Ó. SEOM clinical guideline of diagnosis and management of low-grade glioma (2017). Clin Transl Oncol. 2018; 20:3–15. https://doi.org/10.1007/s12094-017-1790-3 [PubMed]
- 4. Lacroix M, Abi-Said D, Fourney DR, Gokaslan ZL, Shi W, DeMonte F, Lang FF, McCutcheon IE, Hassenbusch SJ, Holland E, Hess K, Michael C, Miller D, Sawaya R. A multivariate analysis of 416 patients with glioblastoma multiforme: prognosis, extent of resection, and survival. J Neurosurg. 2001; 95:190–98. https://doi.org/10.3171/jns.2001.95.2.0190 [PubMed]
- 5. Maher EA, Brennan C, Wen PY, Durso L, Ligon KL, Richardson A, Khatry D, Feng B, Sinha R, Louis DN, Quackenbush J, Black PM, Chin L, DePinho RA. Marked genomic differences characterize primary and secondary glioblastoma subtypes and identify two distinct molecular and clinical secondary glioblastoma entities. Cancer Res. 2006; 66:11502–13. https://doi.org/10.1158/0008-5472.CAN-06-2072 [PubMed]
- 6. Parsons DW, Jones S, Zhang X, Lin JC, Leary RJ, Angenendt P, Mankoo P, Carter H, Siu IM, Gallia GL, Olivi A, McLendon R, Rasheed BA, et al. An integrated genomic analysis of human glioblastoma multiforme. Science. 2008; 321:1807–12. https://doi.org/10.1126/science.1164382 [PubMed]
- 7. Rabinowitz JD, White E. Autophagy and metabolism. Science. 2010; 330:1344–48. https://doi.org/10.1126/science.1193497 [PubMed]
- 8. Kondo Y, Kanzawa T, Sawaya R, Kondo S. The role of autophagy in cancer development and response to therapy. Nat Rev Cancer. 2005; 5:726–34. https://doi.org/10.1038/nrc1692 [PubMed]
- 9. White E, Karp C, Strohecker AM, Guo Y, Mathew R. Role of autophagy in suppression of inflammation and cancer. Curr Opin Cell Biol. 2010; 22:212–17. https://doi.org/10.1016/j.ceb.2009.12.008 [PubMed]
- 10. Mathew R, Kongara S, Beaudoin B, Karp CM, Bray K, Degenhardt K, Chen G, Jin S, White E. Autophagy suppresses tumor progression by limiting chromosomal instability. Genes Dev. 2007; 21:1367–81. https://doi.org/10.1101/gad.1545107 [PubMed]
- 11. Guo JY, Chen HY, Mathew R, Fan J, Strohecker AM, Karsli-Uzunbas G, Kamphorst JJ, Chen G, Lemons JM, Karantza V, Coller HA, Dipaola RS, Gelinas C, et al. Activated Ras requires autophagy to maintain oxidative metabolism and tumorigenesis. Genes Dev. 2011; 25:460–70. https://doi.org/10.1101/gad.2016311 [PubMed]
- 12. Trejo-Solís C, Serrano-Garcia N, Escamilla-Ramírez Á, Castillo-Rodríguez RA, Jimenez-Farfan D, Palencia G, Calvillo M, Alvarez-Lemus MA, Flores-Nájera A, Cruz-Salgado A, Sotelo J. Autophagic and apoptotic pathways as targets for chemotherapy in glioblastoma. Int J Mol Sci. 2018; 19:3773. https://doi.org/10.3390/ijms19123773 [PubMed]
- 13. Howarth A, Madureira PA, Lockwood G, Storer LC, Grundy R, Rahman R, Pilkington GJ, Hill R. Modulating autophagy as a therapeutic strategy for the treatment of paediatric high-grade glioma. Brain Pathol. 2019; 29:707–25. https://doi.org/10.1111/bpa.12729 [PubMed]
- 14. Smith JS, Perry A, Borell TJ, Lee HK, O’Fallon J, Hosek SM, Kimmel D, Yates A, Burger PC, Scheithauer BW, Jenkins RB. Alterations of chromosome arms 1p and 19q as predictors of survival in oligodendrogliomas, astrocytomas, and mixed oligoastrocytomas. J Clin Oncol. 2000; 18:636–45. https://doi.org/10.1200/JCO.2000.18.3.636 [PubMed]
- 15. Chan AK, Yao Y, Zhang Z, Chung NY, Liu JS, Li KK, Shi Z, Chan DT, Poon WS, Zhou L, Ng HK. TERT promoter mutations contribute to subset prognostication of lower-grade gliomas. Mod Pathol. 2015; 28:177–86. https://doi.org/10.1038/modpathol.2014.94 [PubMed]
- 16. Liu XY, Gerges N, Korshunov A, Sabha N, Khuong-Quang DA, Fontebasso AM, Fleming A, Hadjadj D, Schwartzentruber J, Majewski J, Dong Z, Siegel P, Albrecht S, et al. Frequent ATRX mutations and loss of expression in adult diffuse astrocytic tumors carrying IDH1/IDH2 and TP53 mutations. Acta Neuropathol. 2012; 124:615–25. https://doi.org/10.1007/s00401-012-1031-3 [PubMed]
- 17. Gao WZ, Guo LM, Xu TQ, Yin YH, Jia F. Identification of a multidimensional transcriptome signature for survival prediction of postoperative glioblastoma multiforme patients. J Transl Med. 2018; 16:368. https://doi.org/10.1186/s12967-018-1744-8 [PubMed]
- 18. Wang Y, Liu X, Guan G, Zhao W, Zhuang M. A risk classification system with five-gene for survival prediction of glioblastoma patients. Front Neurol. 2019; 10:745. https://doi.org/10.3389/fneur.2019.00745 [PubMed]
- 19. Zuo S, Zhang X, Wang L. A RNA sequencing-based six-gene signature for survival prediction in patients with glioblastoma. Sci Rep. 2019; 9:2615. https://doi.org/10.1038/s41598-019-39273-4 [PubMed]
- 20. Tang Z, Li C, Kang B, Gao G, Li C, Zhang Z. GEPIA: a web server for cancer and normal gene expression profiling and interactive analyses. Nucleic Acids Res. 2017; 45:W98–102. https://doi.org/10.1093/nar/gkx247 [PubMed]
- 21. Szklarczyk D, Franceschini A, Wyder S, Forslund K, Heller D, Huerta-Cepas J, Simonovic M, Roth A, Santos A, Tsafou KP, Kuhn M, Bork P, Jensen LJ, von Mering C. STRING v10: protein-protein interaction networks, integrated over the tree of life. Nucleic Acids Res. 2015; 43:D447–52. https://doi.org/10.1093/nar/gku1003 [PubMed]
- 22. Chang KH, Yan MD, Yao CJ, Lin PC, Lai GM. Honokiol-induced apoptosis and autophagy in glioblastoma multiforme cells. Oncol Lett. 2013; 6:1435–38. https://doi.org/10.3892/ol.2013.1548 [PubMed]
- 23. Zhang H, Lu X, Wang N, Wang J, Cao Y, Wang T, Zhou X, Jiao Y, Yang L, Wang X, Cong L, Li J, Li J, et al. Autophagy-related gene expression is an independent prognostic indicator of glioma. Oncotarget. 2017; 8:60987–1000. https://doi.org/10.18632/oncotarget.17719 [PubMed]
- 24. Esper RM, Pankonin MS, Loeb JA. Neuregulins: versatile growth and differentiation factors in nervous system development and human disease. Brain Res Brain Res Rev. 2006; 51:161–75. https://doi.org/10.1016/j.brainresrev.2005.11.006 [PubMed]
- 25. An T, Huang Y, Zhou Q, Wei BQ, Zhang RC, Yin SJ, Zou CH, Zhang YH, Zhang J. Neuregulin-1 attenuates doxorubicin-induced autophagy in neonatal rat cardiomyocytes. J Cardiovasc Pharmacol. 2013; 62:130–37. https://doi.org/10.1097/FJC.0b013e318291c094 [PubMed]
- 26. Ritch PA, Carroll SL, Sontheimer H. Neuregulin-1 enhances motility and migration of human astrocytic glioma cells. J Biol Chem. 2003; 278:20971–78. https://doi.org/10.1074/jbc.M213074200 [PubMed]
- 27. van der Horst EH, Weber I, Ullrich A. Tyrosine phosphorylation of PYK2 mediates heregulin-induced glioma invasion: novel heregulin/HER3-stimulated signaling pathway in glioma. Int J Cancer. 2005; 113:689–98. https://doi.org/10.1002/ijc.20643 [PubMed]
- 28. Yin F, Zhang JN, Wang SW, Zhou CH, Zhao MM, Fan WH, Fan M, Liu S. MiR-125a-3p regulates glioma apoptosis and invasion by regulating Nrg1. PLoS One. 2015; 10:e0116759. https://doi.org/10.1371/journal.pone.0116759 [PubMed]
- 29. Jones SD, van der Flier A, Sonnenberg A. Genomic organization of the human α 3 integrin subunit gene. Biochem Biophys Res Commun. 1998; 248:896–98. https://doi.org/10.1006/bbrc.1998.9071 [PubMed]
- 30. Dedhar S, Gray V, Robertson K, Saulnier R. Identification and characterization of a novel high-molecular-weight form of the integrin α 3 subunit. Exp Cell Res. 1992; 203:270–75. https://doi.org/10.1016/0014-4827(92)90064-F [PubMed]
- 31. Huang Y, Kong Y, Zhang L, He T, Zhou X, Yan Y, Zhang L, Zhou D, Lu S, Zhou J, Zhou L, Xie H, Zheng S, Wang W. High expression of ITGA3 promotes proliferation and cell cycle progression and indicates poor prognosis in intrahepatic cholangiocarcinoma. Biomed Res Int. 2018; 2018:2352139. https://doi.org/10.1155/2018/2352139 [PubMed]
- 32. Liu H, Chen X, Lin T, Chen X, Yan J, Jiang S. MicroRNA-524-5p suppresses the progression of papillary thyroid carcinoma cells via targeting on FOXE1 and ITGA3 in cell autophagy and cycling pathways. J Cell Physiol. 2019; 234:18382–91. https://doi.org/10.1002/jcp.28472 [PubMed]
- 33. Fiscon G, Conte F, Paci P. SWIM tool application to expression data of glioblastoma stem-like cell lines, corresponding primary tumors and conventional glioma cell lines. BMC Bioinformatics. 2018 (Suppl 15); 19:436. https://doi.org/10.1186/s12859-018-2421-x [PubMed]
- 34. Bai H, Inoue J, Kawano T, Inazawa J. A transcriptional variant of the LC3A gene is involved in autophagy and frequently inactivated in human cancers. Oncogene. 2012; 31:4397–408. https://doi.org/10.1038/onc.2011.613 [PubMed]
- 35. Giatromanolaki A, Sivridis E, Mitrakas A, Kalamida D, Zois CE, Haider S, Piperidou C, Pappa A, Gatter KC, Harris AL, Koukourakis MI. Autophagy and lysosomal related protein expression patterns in human glioblastoma. Cancer Biol Ther. 2014; 15:1468–78. https://doi.org/10.4161/15384047.2014.955719 [PubMed]
- 36. Zhang H, Zhu Y, Sun X, He X, Wang M, Wang Z, Wang Q, Zhu R, Wang S. Curcumin-loaded layered double hydroxide nanoparticles-induced autophagy for reducing glioma cell migration and invasion. J Biomed Nanotechnol. 2016; 12:2051–62. https://doi.org/10.1166/jbn.2016.2291 [PubMed]
- 37. Harrell FE
Jr , Lee KL, Mark DB. Multivariable prognostic models: issues in developing models, evaluating assumptions and adequacy, and measuring and reducing errors. Stat Med. 1996; 15:361–87. https://doi.org/10.1002/(SICI)1097-0258(19960229)15:4<361::AID-SIM168>3.0.CO;2-4 [PubMed] - 38. Robinson MD, McCarthy DJ, Smyth GK. edgeR: a Bioconductor package for differential expression analysis of digital gene expression data. Bioinformatics. 2010; 26:139–40. https://doi.org/10.1093/bioinformatics/btp616 [PubMed]
- 39. Wang Z, Gao L, Guo X, Feng C, Deng K, Lian W, Xing B. Identification of microRNAs associated with the aggressiveness of prolactin pituitary tumors using bioinformatic analysis. Oncol Rep. 2019; 42:533–48. https://doi.org/10.3892/or.2019.7173 [PubMed]
- 40. Moussay E, Kaoma T, Baginska J, Muller A, Van Moer K, Nicot N, Nazarov PV, Vallar L, Chouaib S, Berchem G, Janji B. The acquisition of resistance to TNFα in breast cancer cells is associated with constitutive activation of autophagy as revealed by a transcriptome analysis using a custom microarray. Autophagy. 2011; 7:760–70. https://doi.org/10.4161/auto.7.7.15454 [PubMed]
- 41. Ashburner M, Ball CA, Blake JA, Botstein D, Butler H, Cherry JM, Davis AP, Dolinski K, Dwight SS, Eppig JT, Harris MA, Hill DP, Issel-Tarver L, et al, and The Gene Ontology Consortium. Gene ontology: tool for the unification of biology. Nat Genet. 2000; 25:25–29. https://doi.org/10.1038/75556 [PubMed]
- 42. Kanehisa M, Furumichi M, Tanabe M, Sato Y, Morishima K. KEGG: new perspectives on genomes, pathways, diseases and drugs. Nucleic Acids Res. 2017; 45:D353–61. https://doi.org/10.1093/nar/gkw1092 [PubMed]
- 43. Huang W, Sherman BT, Lempicki RA. Systematic and integrative analysis of large gene lists using DAVID bioinformatics resources. Nat Protoc. 2009; 4:44–57. https://doi.org/10.1038/nprot.2008.211 [PubMed]
- 44. Linden A, Yarnold PR. Modeling time-to-event (survival) data using classification tree analysis. J Eval Clin Pract. 2017; 23:1299–308. https://doi.org/10.1111/jep.12779 [PubMed]
- 45. Nagashima K, Sato Y. Information criteria for Firth’s penalized partial likelihood approach in Cox regression models. Stat Med. 2017; 36:3422–36. https://doi.org/10.1002/sim.7368 [PubMed]
- 46. Zeng JH, Liang L, He RQ, Tang RX, Cai XY, Chen JQ, Luo DZ, Chen G. Comprehensive investigation of a novel differentially expressed lncRNA expression profile signature to assess the survival of patients with colorectal adenocarcinoma. Oncotarget. 2017; 8:16811–28. https://doi.org/10.18632/oncotarget.15161 [PubMed]
- 47. Alba AC, Agoritsas T, Walsh M, Hanna S, Iorio A, Devereaux PJ, McGinn T, Guyatt G. Discrimination and calibration of clinical prediction models: users’ guides to the medical literature. JAMA. 2017; 318:1377–84. https://doi.org/10.1001/jama.2017.12126 [PubMed]
- 48. Subramanian A, Tamayo P, Mootha VK, Mukherjee S, Ebert BL, Gillette MA, Paulovich A, Pomeroy SL, Golub TR, Lander ES, Mesirov JP. Gene set enrichment analysis: a knowledge-based approach for interpreting genome-wide expression profiles. Proc Natl Acad Sci USA. 2005; 102:15545–50. https://doi.org/10.1073/pnas.0506580102 [PubMed]
- 49. Qian Z, Li Y, Fan X, Zhang C, Wang Y, Jiang T, Liu X. Prognostic value of a microRNA signature as a novel biomarker in patients with lower-grade gliomas. J Neurooncol. 2018; 137:127–37. https://doi.org/10.1007/s11060-017-2704-5 [PubMed]