


Introduction
Hepatocellular carcinoma (HCC) is the most common form of liver cancers [1], which has an annual incidence of at least 6 per 100,000 individuals and represents the fastest-rising cause of cancer-related death [2]. Due to the high rate of recurrence and metastasis, the five-year survival rate for advanced HCC is poor. However, existing targeted drugs show unsatisfactory efficacy, due to a combination of factors spanning an array of different clinical and biological behaviors, and the development of anti-HCC drug resistance [3]. The molecular mechanisms underlying tumor formation and progression are poorly understood, which further complicates the effective treatment of HCC [4]. In addition, the lack of markers that are specific for tumor type or disease stage represents a critical gap in the current understanding and treatment of HCC.
Pre-mRNA splicing is a fundamental process that plays a considerable role in generating protein diversity. Pre-mRNA splicing is also the key to the pathology of numerous diseases, especially cancers [5]. The connection between cancer biology and splicing regulation is of primary importance to understand the mechanisms leading to disease and also to improve the development of therapeutic approaches [6]. Among the array of splicing factors, pre-mRNA processing factor 3 (PRPF3), a component of the U4/U6 di-snRNP, is required for U4/U6•U5 tri-snRNP formation and recruitment to active spliceosomes, which is essential for efficient pre-mRNA splicing [7, 8].
It is also known that one gene pair, KCNE2-PRPF3 as the signature could robustly predict prognoses of gastric cancer patients treated with 5-FU-based chemotherapy [9]. As a member of the hepatic transcription factor network, Hepatocyte Nuclear Factor 4 Alpha (HNF4α) plays a pivotal role in liver development and hepatocellular differentiation. One study indicated that PRPF3 is an HNF4α regulated gene with induced expression in mouse and human HCC [10]. However, the biological function of PRPF3 in HCC remains to be determined.
Here, we investigated PRPF3 expression and mutations in data from patients with HCC in The Cancer Genome Atlas (TCGA) and various public databases. Using multi-dimensional analysis, we evaluated genomic alterations and functional networks related to PRPF3 in HCC and explored its role in tumor immunity. Our results could potentially reveal new targets and strategies for HCC diagnosis and treatment.
Results
Elevated expression of PRPF3 in HCC
We initially evaluated PRPF3 transcription levels in multiple HCC studies from TCGA and GEO. Analysis of eleven HCC cohorts in the HCCDB database revealed that mRNA expression of PRPF3 was significantly higher in HCC tissues than in adjacent normal tissues (Figure 1A). Data in the Oncomine database indicated that PRPF3 ranked within the top 10% based on mRNA expression (Figure 1B). Levels of PRPF3 DNA copy number were significantly higher in tumor tissues than in normal tissue (Figure 1C).
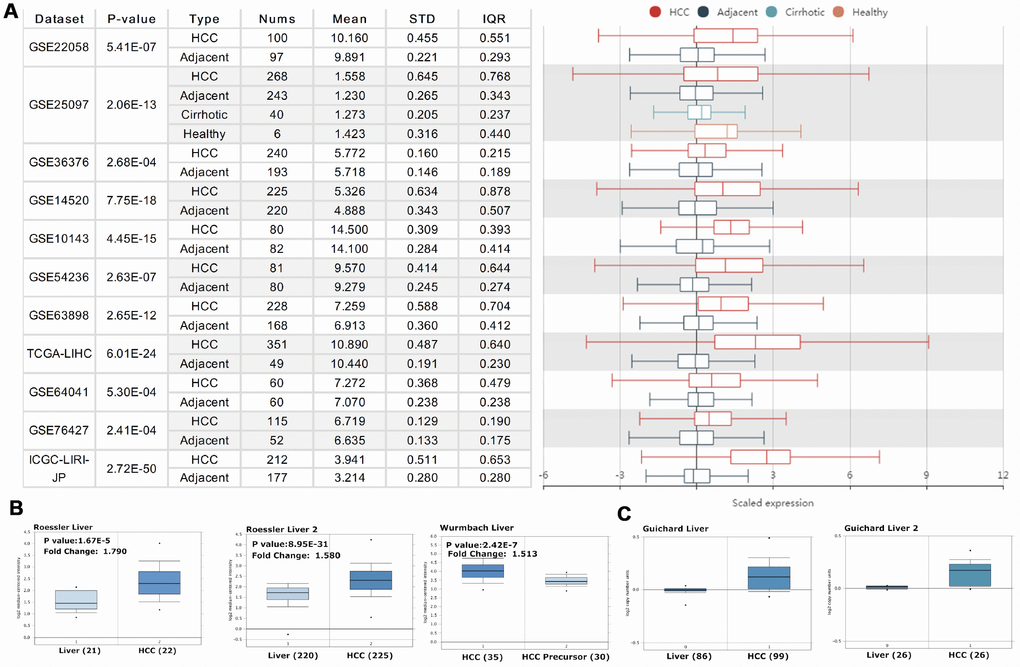
Figure 1. PRPF3 transcription level in HCC. (A) Chart and plot showing the expression of PRPF3 in tumor tissues and the adjacent normal tissues, according to t-test in HCCDB. (B) Box plot showing PRPF3 mRNA levels in the Roessler Liver, Roessler Liver 2, and Wurmbach Liver datasets, respectively. (C) Box plot showing PRPF3 copy number in Guichard Liver and Guichard Liver 2 datasets, respectively.
Further sub-group analysis of multiple clinic-pathological features of TCGA-LIHC samples in UALCAN database consistently showed elevated transcription level of PRPF3. The expression of PRPF3 was significantly higher in HCC patients than normal controls in subgroup analysis based on gender, age, ethnicity, disease stages, and tumor grade (Figure 2). Thus, PRPF3 expression may serve as a potential diagnostic indicator in HCC.
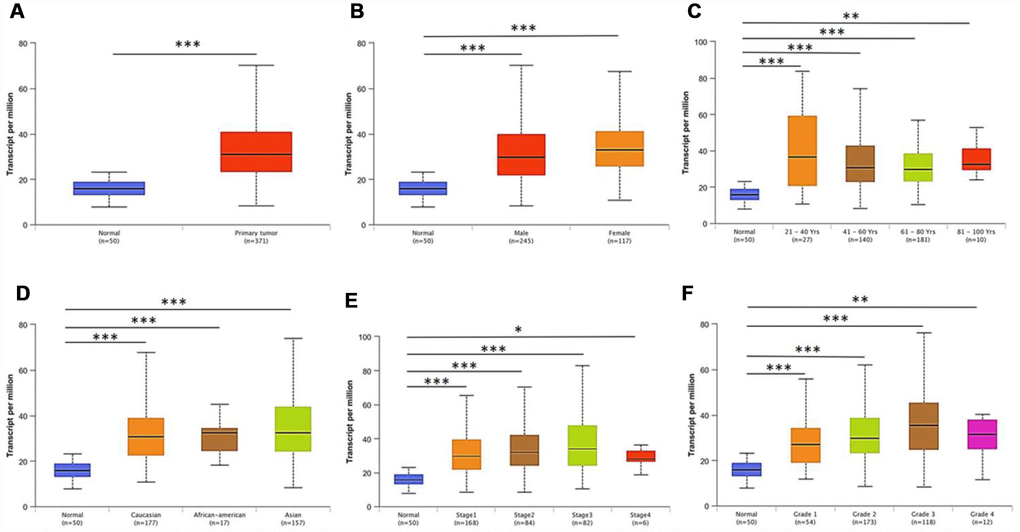
Figure 2. PRPF3 transcription in subgroups of patients with HCC, stratified based on gender, age and other criteria (UALCAN). Box-whisker plots showing the expression of PRPF3 in sub groups of LIHC samples. (A) Boxplot showing relative expression of PRPF3 in normal and LIHC samples. (B) Boxplot showing relative expression of PRPF3 in normal individuals of either gender and male or female LIHC patients, respectively. (C) Boxplot showing relative expression of PRPF3 in normal individuals of any age or in LIHC patients aged 21-40, 41-60, 61-80, or 81-100 yr. (D) Boxplot showing relative expression of PRPF3 in normal, African American, Caucasian and Asian LIHC patients. (E) Boxplot showing relative expression of PRPF3 in normal individuals or in LIHC patients in stages 1, 2, 3 or 4. (F) Boxplot showing relative expression of PRPF3 in normal individuals or LIHC patients with grade 1, 2, 3 or 4 tumors. The central mark is the median; the edges of the box are the 25th and 75th percentiles. The t-test was used to estimate the significance of difference in gene expression levels between groups. *, p < 0.05; **, p < 0.01; ***, p < 0.001.
PRPF3 expression is survival-associated
Then, Kaplan-Meier survival curves were used to assess the association between PRPF3 expression and the survival outcomes of HCC cohorts with survival information available (Figure 3). The patients were separated into two groups according to the median value of PRPF3 expression level in each cohort. Generally, the high PRPF3 expression group had significantly shorter overall survival (OS) (log-rank test, p < 0.05) and disease-free survival (DFS) (log-rank test, p < 0.05), compared to the low expression group in LIHC cohort (Figure 3A). Similarly, in an independent cohort (GSE14520), the low-risk group had significantly better OS and DFS than the high-risk group (Figure 3B). In addition, high PRPF3 expression being associated with poor survival was also verified in GSE10141 cohort (Supplementary Figure 1).
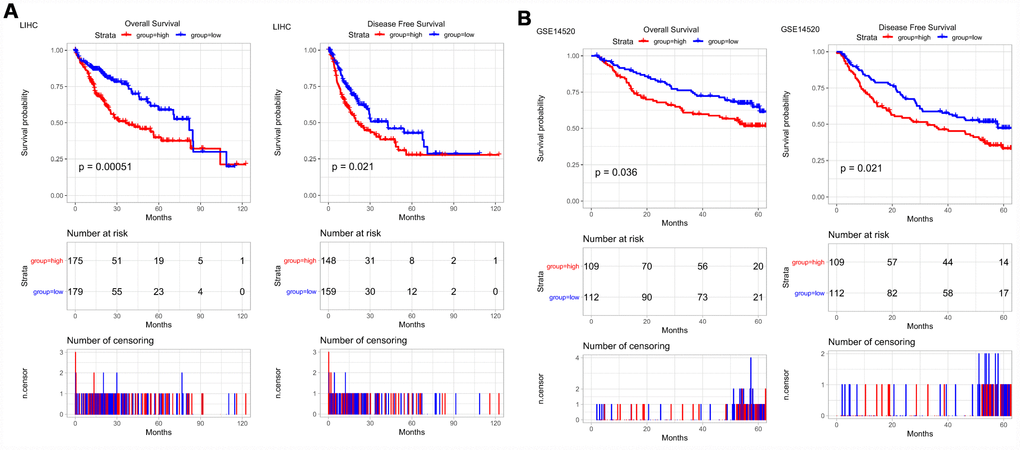
Figure 3. PRPF3 is associated with survival outcome. (A) Overall survival (OS) and disease-free survival (DFS) in TCGA LIHC cohort. (B) OS and DFS of PRPF3 in GSE14520 cohort. The numbers below the figures denote the number of patients at risk in each group.
PRPF3 co-expression networks in HCC
To gain the insight of PRPF3 biological meaning in HCC, the function module of LinkedOmics was used to examine PRPF3 co-expression mode in LIHC cohort. As shown in Figure 4A, 3,558 genes (dark red dots) were shown significant positive correlations with PRPF3, whereas 1,891 genes (dark green dots) were shown significant negative correlations (false discovery rate, FDR < 0.01). The top 50 significant genes positively and negatively correlated with PRPF3 were shown in the heat map (Figure 4B). A total description of the co-expressed genes was detailed in Supplementary Table 1.
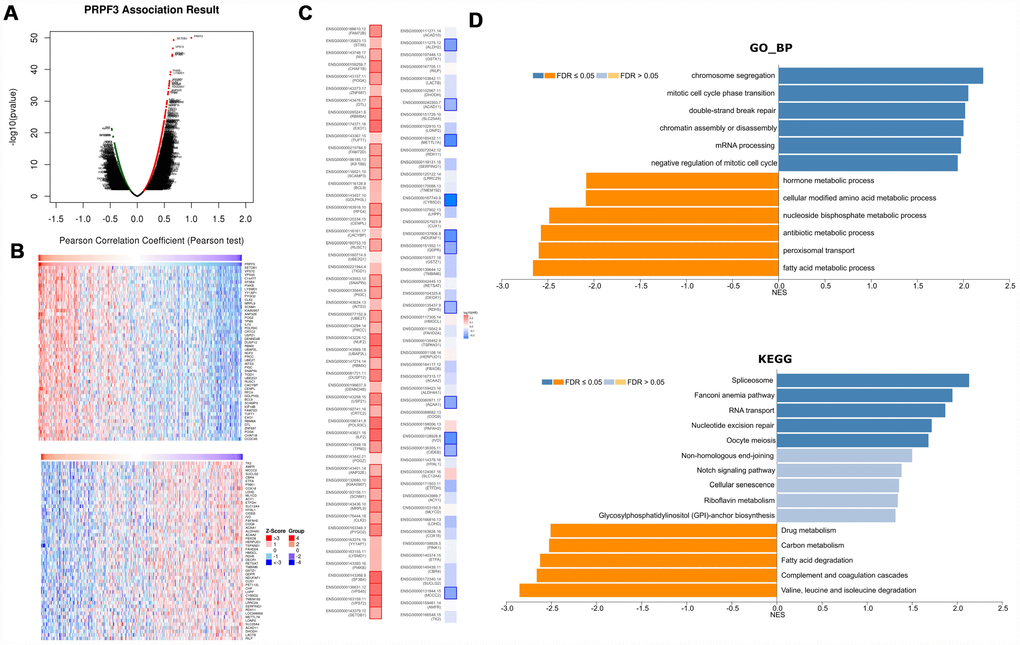
Figure 4. PRPF3 co-expression genes in HCC (LinkedOmics). (A) The global PRPF3 highly correlated genes identified by Pearson test in LIHC cohort. (B) Heat maps showing top 50 genes positively and negatively correlated with PRPF3 in LIHC. Red indicates positively correlated genes and blue indicates negatively correlated genes. (C) Survival map of the top 50 genes positively and negatively correlated with PRPF3 in LIHC. (D) Significantly enriched GO annotations and KEGG pathways of PRPF3 in LIHC cohort.
PRPF3 expression showed a strong positive association with expression of SETDB1 (positive rank #1, r = 0.672, p = 5.06E-50), VPS72 (r = 0.658, p = 2.19E-47), and VPS45 (r = 0.647, p = 1.95E-45), etc. Notably, the top 50 significantly positive genes showed the high likelihood of being high-risk genes in HCC, in which 34/50 genes were with high hazard ratio (HR) (p < 0.05). In contrast, there were 11/50 genes with low HR (p < 0.05) in the top 50 negatively significant genes (Figure 4C).
Significant Gene Ontology (GO) term annotation by gene set enrichment analysis (GSEA) showed that PRPF3 co-expressed genes participate primarily in chromosome segregation, mitotic cell cycle phase transition, double-strand break repair, and mRNA processing, while the activities like fatty acid metabolic process, peroxisomal transport, and multiple metabolic processes were inhibited (Figure 4D and Supplementary Table 2). Kyoto Encyclopedia of Genes and Genomes (KEGG) pathway analysis showed enrichment in the spliceosome, fanconi anemia pathway, RNA transport, and nucleotide excision repair pathways, etc (Figure 4D and Supplementary Table 3). These results suggest that a widespread impact of PRPF3 on the global transcriptome.
Regulators of PRPF3 networks in HCC
To further explore the regulators of PRPF3 in HCC, we analyzed the kinases, miRNAs and transcription factors’ (TF) enrichment of PRPF3 co-expressed genes. The top 5 most significant kinases related primarily to the cyclin-dependent kinase 1 (CDK1), polo like kinase 1 (PLK1), Aurora kinase B (AURKB), checkpoint kinase 1 (CHEK1), and cyclin-dependent kinase 2 (CDK2) (Table 1 and Supplementary Table 4). In fact, all of these kinase genes, except CDK2, were significantly highly expressed in tumor tissues. In addition, all these kinase genes were significantly associated with the OS of HCC (Supplementary Figure 2).
Table 1. The Kinases, miRNAs and transcription factors-target networks of PRPF3 in HCC.
| Enriched Category | Geneset | LeadingEdgeNum | FDR |
| Kinase Target | Kinase_CDK1 | 85 | 0.00E+00 |
| Kinase_PLK1 | 38 | 0.00E+00 | |
| Kinase_CHEK1 | 49 | 0.00E+00 | |
| Kinase_AURKB | 32 | 0.00E+00 | |
| Kinase_CDK2 | 118 | 0.00E+00 | |
| miRNA Target | GACTGTT, MIR-212, MIR-132 | 148 | 4.32E-01 |
| AGCGCAG, MIR-191 | 12 | 4.56E-01 | |
| CCAGGTT, MIR-490 | 60 | 4.58E-01 | |
| GAGCTGG, MIR-337 | 147 | 4.67E-01 | |
| ACACTCC, MIR-122A | 80 | 4.70E-01 | |
| Transcription Factor | V$E2F4DP2_01 | 69 | 0.00E+00 |
| V$E2F_Q4_01 | 44 | 0.00E+00 | |
| KCCGNSWTTT_UNKNOWN | 33 | 8.40E-05 | |
| GCGSCMNTTT_UNKNOWN | 30 | 3.00E-04 | |
| V$ETF_Q6 | 80 | 3.20E-04 |
No significant miRNA was enriched by GSEA for PRPF3 co-expressed genes (Supplementary Table 5). The enrichment of transcription factors was related mainly to the E2F transcription factor family (Supplementary Table 6), including V$E2F_Q6, V$E2F_Q4, V$E2F1_Q6, V$E2F1DP1RB_01, and V$E2F4DP1_01. One recent study, using combinatorial mapping of chromatin occupancy and transcriptome profiling, identified an E2F-driven transcriptional program that was associated with the development and progression of HCC [11].
Genomic alterations of PRPF3 in HCC
We then used the cBioPortal tool to determine the types and frequency of PRPF3 alterations in HCC based on DNA sequencing data from LIHC patients. PRPF3 was altered in 115 of 370 (32%) LIHC patients (Figure 5A). These alterations include mRNA upregulation in 60 cases (16%), amplification (AMP) in 38 cases (10%), mutation in 1 case (0.3%), and multiple alterations in 19 cases (5%). Thus, AMP is the most common type of PRPF3 CNV in HCC.
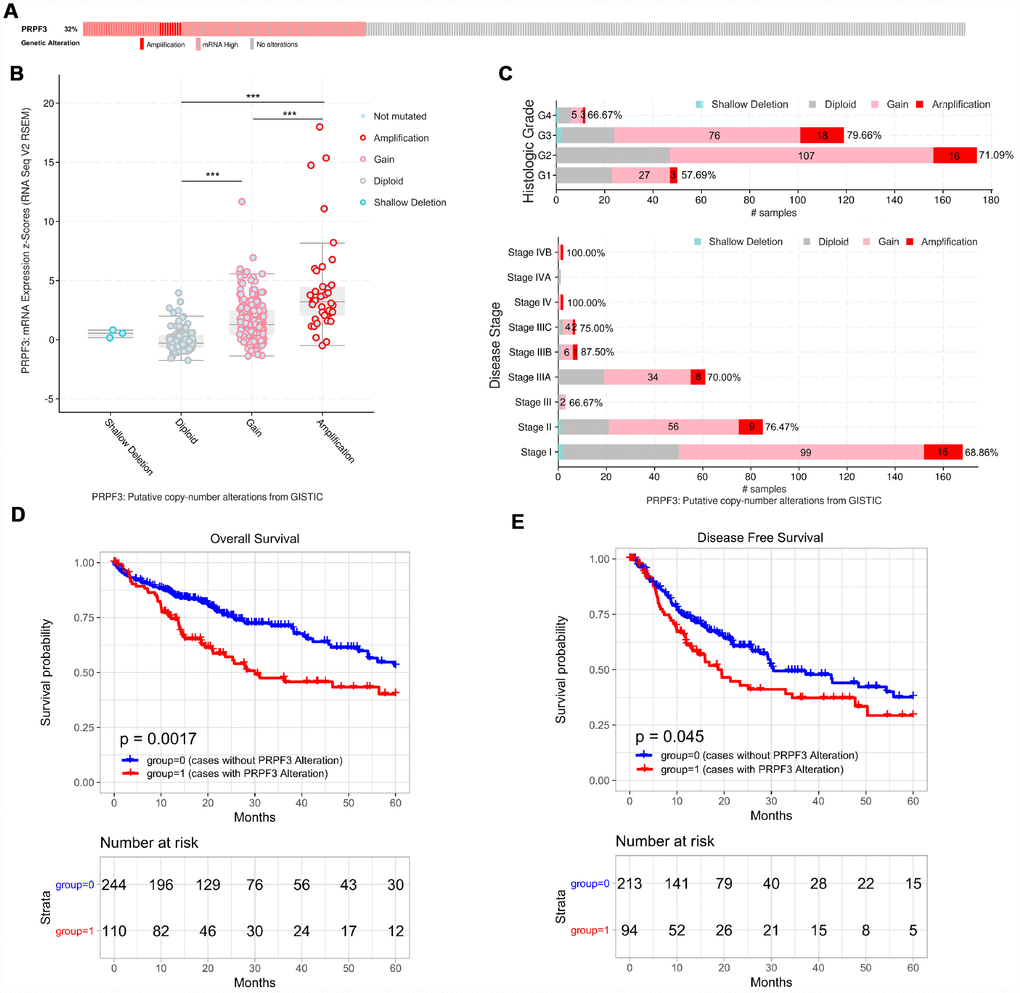
Figure 5. PRPF3 genomic alterations in HCC (cBioPortal). (A) OncoPrint of PRPF3 alterations in LIHC cohort. The different types of genetic alterations are highlighted in different colors. (B) PRPF3 expression in different PRPF3 CNV groups. PRPF3 amplification (AMP) group has a significantly higher expression level. (C) Distribution of PRPF3 CNV frequency in different stage and grade subgroups. The percentage number on the right of the bar indicates the ratio of patients with PRPF3 gain or AMP in all this subgroup patients. (D) To reduce the noise of disease irrelevant deaths, survival time that was greater than five years was truncated to five years. PRPF3 CNV affects overall survival and disease-free survival. ***, p < 0.001.
PRPF3 AMP results in the high expression level of PRPF3 (Figure 5B). Compared with the diploid group, gain or amplification group has higher PRPF3 expression levels (p < 0.001). Next, the frequency distribution of PRPF3 CNV patients in different stage and grade groups was presented in Figure 5C, suggesting the high occurrence and an early-event of PRPF3 CNV alteration in HCC. Moreover, PRPF3 CNV alteration was significantly associated with the OS and DFS of HCC patients (Figure 5D, 5E). Based on five-years survival, median survival time of samples with PRPF3 alteration was 29.97 months and 19.47 months for OS, and DFS respectively.
Gene co-occurrence of PRPF3 alterations in HCC
Gene co-occurrence reflects common genetic risk factors constituting functional relationships, thus we examine the co-occurrence profiles with PRPF3 AMP in HCC. More than one thousand (1,243) genes were shown having significant co-occurrence with PRPF3 AMP (Supplementary Table 7). The most frequent alterations were Acidic Nuclear Phosphoprotein 32 Family Member E (ANP32E) (34.78%), Aph-1 Homolog A (APH1A) (34.78%), and Chromosome 1 Open Reading Frame 54 (C1orf54) (34.78%), etc. KEGG pathway analysis of co-occurrence genes showed enrichment in complement and coagulation cascades and systemic lupus erythematosus (Figure 6B). Analysis of significantly enriched GO terms indicated that these genes were primarily involved in acute inflammatory response, immune effector process, and adaptive immune response, etc (Figure 6C and Supplementary Table 8).
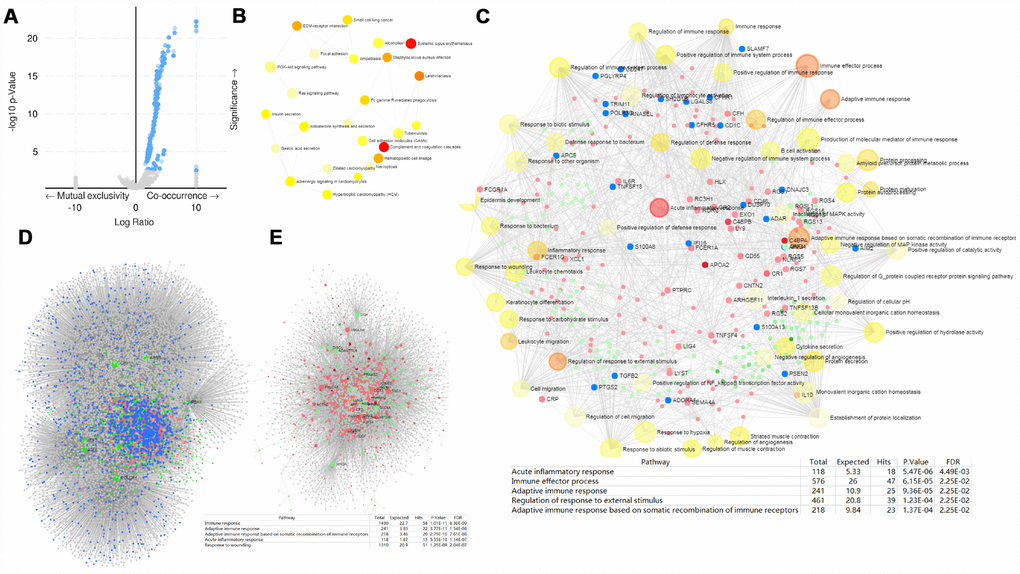
Figure 6. PRPF3 CNV co-occurrence profiles in HCC. (A) Volcano plot of co-occurrence genes along with PRPF3 amplification (AMP). (B) KEGG pathway analysis of significantly PRPF3 co-occurrence genes. (C) GO_BP terms of significantly PRPF3 co-occurrence genes. (D) The liver-specific protein-protein interaction (PPI) network of significantly PRPF3 co-occurrence genes. (E) Transcription factor-miRNA (TF-miRNA) coregulatory network of significantly PRPF3 co-occurrence genes.
Further, the PRPF3 co-occurrence derived protein-protein interaction (PPI) network was assembled based on liver-specific data collected from the DifferentialNet database [12] (Figure 6D). The top 3 hub genes were Ring Finger Protein 2 (RNF2), Myeloid Cell Nuclear Differentiation Antigen (MNDA), and Cullin 4A (CUL4A). The previous study indicated that loss of RNF2 inhibited HCC cell growth and promoted apoptosis [13]. While CUL4A facilitates hepatocarcinogenesis by promoting cell cycle progression and epithelial-mesenchymal transition [14].
Finally, TF-miRNA coregulatory interactions of the PRPF3 co-occurrence genes was constructed based on the RegNetwork repository (Figure 6E) [15]. The top 3 TFs were Upstream Transcription Factor 1 (USF1), POU Class 2 Homeobox 1 (POU2F1), and Aryl Hydrocarbon Receptor Nuclear Translocator (ARNT). Generally, USF1 acts as a positive transcription factor, which binds to the basal promoter thus ensuring gene expression in a wide range of tissues including liver [16]. POU2F1 promotes growth and metastasis of HCC through the FAT Atypical Cadherin 1 (FAT1) signaling pathway [17]. Suppression of tumor cell invasion and migration was demonstrated in ARNT-silenced HCC cell lines. Silencing of ARNT induces anti-tumor effects in hepatoma cell lines under tumor hypoxia [18].
Whether for the liver-specific PPI network or the TF-miRNA coregulatory network, the function annotation implied that PRPF3 AMP involves in the immune response and inflammatory response.
PRPF3 is correlated with tumor purity and immune infiltration level in HCC
Therefore, we investigated whether PRPF3 expression was correlated with immune infiltration levels in HCC from TIMER database. The results show that PRPF3 expression has significant correlations with tumor purity (r = 0.223, p = 2.90E-05) and significant correlations with the dominant immune cells infiltration levels (Figure 7A). Particularly, PRPF3 CNV has significant correlations with infiltrating levels of CD8+ T cells, macrophages, neutrophils, and dendritic cells (Figure 7B).
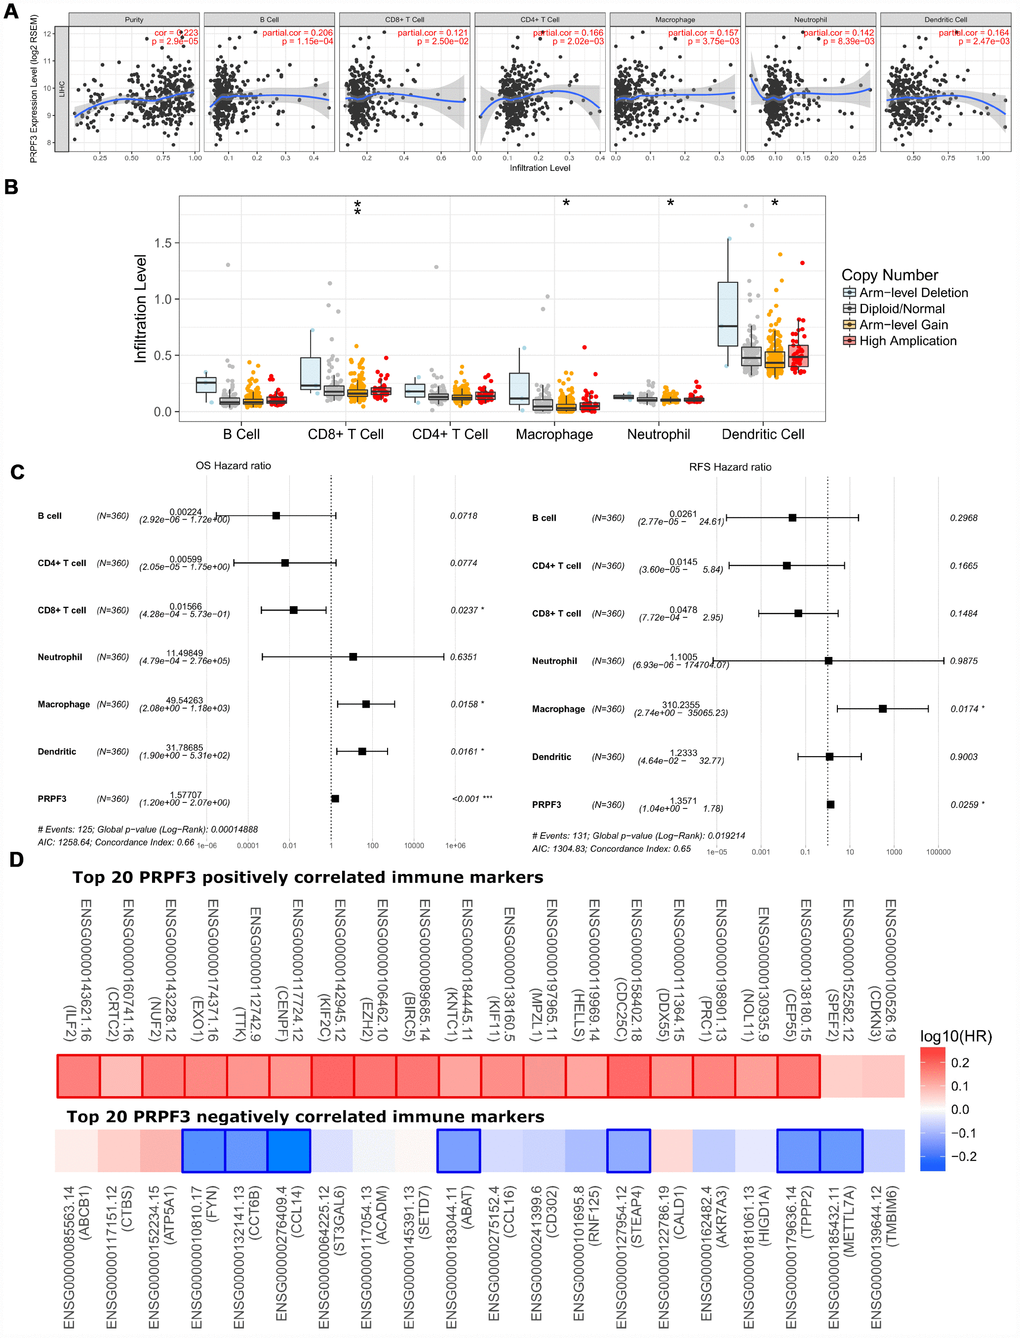
Figure 7. Correlations of PRPF3 expression with immune infiltration level in HCC. (A) PRPF3 expression is significantly related to tumor purity and has significant positive correlations with infiltrating levels of CD8+ T cells, CD4+ T cells, macrophages, neutrophils, and dendritic cells in LIHC. (B) PRPF3 CNV affects the infiltrating levels of CD8+ T cells, macrophages, neutrophils, and dendritic cells in HCC. (C) Multivariable hazards models were used to evaluate the impacts of PRPF3 expression on overall survival and disease-free survival in the presence of infiltrating levels of multiple immune cells. (D) Survival maps of top 20 PRPF3 positively and negatively correlated immune markers in LIHC, respectively. *, p < 0.05, **, p < 0.01, ***, p < 0.001.
Moreover, multivariable hazards models were used to evaluate the impacts of PRPF3 expression in the presence of varying immune cells. PRPF3 had 1.57 times higher risks on OS (p < 0.001) and 1.36 times higher risks on DFS (p = 0.0259) (Figure 7C).
In addition, PRPF3 co-occurrence genes with Log Ratio > 10 also showed the significant correlations with tumor purity and varying degree with immune cells (Supplementary Figure 3A). Similar to PRPF3, CNV of all these genes have significant correlations with infiltrating levels of CD8+ T cells, macrophages, neutrophils, and dendritic cells (Supplementary Figure 3B).
PRPF3 expression is associated with immune signatures
Finally, to broaden the understanding of PRPF3 crosstalk with immune genes, we analyzed the correlations between PRPF3 expression and various immune signatures, which included immune marker genes of 28 tumor-infiltrating lymphocytes (TILs), immune inhibitory or stimulatory genes (including immune checkpoint gene sets), cytokine-related genes, cancer-testis antigen genes, and major histocompatibility complex (MHC) genes (Table 2 and Supplementary Table 9).
Table 2. Correlation analysis between PRPF3 and markers of activated T cells.
| Activated CD8 T cell | None | Purity | Activated CD4 T cell | None | Purity | ||||||||||||||||||||||||||||||||||||||||||||||||||||||||||||||||||||||||||||||||||||||||||||||
| Cor | P | Cor | P | Cor | P | Cor | P | ||||||||||||||||||||||||||||||||||||||||||||||||||||||||||||||||||||||||||||||||||||||||||||
| ADRM1 | 0.0434 | 4.17E-01 | 0.0510 | 3.42E-01 | AIM2 | 0.0519 | 3.32E-01 | 0.1657 | 1.86E-03* | ||||||||||||||||||||||||||||||||||||||||||||||||||||||||||||||||||||||||||||||||||||||||||
| AHSA1 | 0.0464 | 3.86E-01 | 0.0498 | 3.53E-01 | BIRC3 | 0.1174 | 2.78E-02* | 0.1768 | 8.95E-04 | ||||||||||||||||||||||||||||||||||||||||||||||||||||||||||||||||||||||||||||||||||||||||||
| C1GALT1C1 | -0.0042 | 9.38E-01 | 0.0134 | 8.03E-01 | BRIP1 | 0.1941 | 2.54E-04* | 0.1915 | 3.13E-04* | ||||||||||||||||||||||||||||||||||||||||||||||||||||||||||||||||||||||||||||||||||||||||||
| CCT6B | -0.2883 | 3.82E-08* | -0.3117 | 2.53E-09* | CCL20 | 0.1877 | 4.06E-04* | 0.2190 | 3.59E-05* | ||||||||||||||||||||||||||||||||||||||||||||||||||||||||||||||||||||||||||||||||||||||||||
| CD37 | -0.0824 | 1.23E-01 | 0.0095 | 8.60E-01 | CCL4 | -0.1020 | 5.61E-02 | -0.0259 | 6.29E-01 | ||||||||||||||||||||||||||||||||||||||||||||||||||||||||||||||||||||||||||||||||||||||||||
| CD3D | 0.0226 | 6.73E-01 | 0.1133 | 3.41E-02* | CCL5 | -0.1204 | 2.41E-02* | -0.0516 | 3.35E-01 | ||||||||||||||||||||||||||||||||||||||||||||||||||||||||||||||||||||||||||||||||||||||||||
| CD3E | -0.0931 | 8.14E-02 | -0.0112 | 8.35E-01 | CCNB1 | 0.365 | 1.67E-12* | 0.3762 | 3.31E-13* | ||||||||||||||||||||||||||||||||||||||||||||||||||||||||||||||||||||||||||||||||||||||||||
| CD3G | -0.0688 | 1.99E-01 | 0.0126 | 8.14E-01 | CCR7 | -0.0941 | 7.82E-02 | -0.0267 | 6.19E-01 | ||||||||||||||||||||||||||||||||||||||||||||||||||||||||||||||||||||||||||||||||||||||||||
| CD69 | -0.1511 | 4.56E-03* | -0.0892 | 9.56E-02 | DUSP2 | -0.0274 | 6.08E-01 | 0.043 | 4.23E-01 | ||||||||||||||||||||||||||||||||||||||||||||||||||||||||||||||||||||||||||||||||||||||||||
| CD8A | -0.0993 | 6.32E-02 | -0.0288 | 5.91E-01 | ESCO2 | 0.3049 | 5.53E-09* | 0.3218 | 7.13E-10* | ||||||||||||||||||||||||||||||||||||||||||||||||||||||||||||||||||||||||||||||||||||||||||
| CETN3 | 0.0194 | 7.17E-01 | 0.0206 | 7.01E-01 | ETS1 | -0.2332 | 1.02E-05* | -0.1945 | 2.52E-04* | ||||||||||||||||||||||||||||||||||||||||||||||||||||||||||||||||||||||||||||||||||||||||||
| CSE1L | 0.2510 | 1.91E-06* | 0.2442 | 3.78E-06* | EXO1 | 0.4795 | 1.41E-21* | 0.4902 | 1.48E-22* | ||||||||||||||||||||||||||||||||||||||||||||||||||||||||||||||||||||||||||||||||||||||||||
| GEMIN6 | 0.0557 | 2.98E-01 | 0.0379 | 4.80E-01 | EXOC6 | 0.2337 | 9.66E-06* | 0.2355 | 8.47E-06* | ||||||||||||||||||||||||||||||||||||||||||||||||||||||||||||||||||||||||||||||||||||||||||
| GNLY | -0.0378 | 4.80E-01 | -0.0003 | 9.95E-01 | IARS | 0.2431 | 4.09E-06* | 0.2496 | 2.26E-06* | ||||||||||||||||||||||||||||||||||||||||||||||||||||||||||||||||||||||||||||||||||||||||||
| GPT2 | -0.2661 | 4.22E-07* | -0.2872 | 4.52E-08* | ITK | -0.1523 | 4.23E-03* | -0.0884 | 9.87E-02 | ||||||||||||||||||||||||||||||||||||||||||||||||||||||||||||||||||||||||||||||||||||||||||
| GZMA | -0.1467 | 5.90E-03* | -0.0849 | 1.13E-01 | KIF11 | 0.4089 | 1.39E-15* | 0.4189 | 2.64E-16* | ||||||||||||||||||||||||||||||||||||||||||||||||||||||||||||||||||||||||||||||||||||||||||
| GZMH | -0.1656 | 1.85E-03* | -0.1192 | 2.57E-02* | KNTC1 | 0.4255 | 7.19E-17* | 0.4308 | 3.02E-17* | ||||||||||||||||||||||||||||||||||||||||||||||||||||||||||||||||||||||||||||||||||||||||||
| GZMK | -0.1558 | 3.44E-03* | -0.0950 | 7.60E-02 | NUF2 | 0.5126 | 6.60E-25* | 0.5176 | 2.25E-25* | ||||||||||||||||||||||||||||||||||||||||||||||||||||||||||||||||||||||||||||||||||||||||||
| IL2RB | -0.1291 | 1.55E-02* | -0.0558 | 2.98E-01 | PRC1 | 0.3915 | 2.66E-14* | 0.3994 | 7.75E-15* | ||||||||||||||||||||||||||||||||||||||||||||||||||||||||||||||||||||||||||||||||||||||||||
| LCK | -0.0842 | 1.15E-01 | 0.0036 | 9.47E-01 | PSAT1 | -0.0417 | 4.37E-01 | -0.0360 | 5.02E-01 | ||||||||||||||||||||||||||||||||||||||||||||||||||||||||||||||||||||||||||||||||||||||||||
| MPZL1 | 0.3774 | 2.51E-13* | 0.4119 | 9.18E-16* | RGS1 | 0.0037 | 9.45E-01 | 0.0929 | 8.27E-02 | ||||||||||||||||||||||||||||||||||||||||||||||||||||||||||||||||||||||||||||||||||||||||||
| NKG7 | -0.1198 | 2.47E-02* | -0.0651 | 2.25E-01 | RTKN2 | 0.3646 | 1.79E-12* | 0.3849 | 8.36E-14* | ||||||||||||||||||||||||||||||||||||||||||||||||||||||||||||||||||||||||||||||||||||||||||
| PIK3IP1 | -0.1298 | 1.49E-02* | -0.0972 | 6.93E-02 | SAMSN1 | -0.1064 | 4.64E-02* | -0.0189 | 7.25E-01 | ||||||||||||||||||||||||||||||||||||||||||||||||||||||||||||||||||||||||||||||||||||||||||
| PTRH2 | 0.1665 | 1.74E-03* | 0.1594 | 2.78E-03* | SELL | -0.0732 | 1.71E-01 | -0.0034 | 9.50E-01 | ||||||||||||||||||||||||||||||||||||||||||||||||||||||||||||||||||||||||||||||||||||||||||
| TIMM13 | -0.0588 | 2.72E-01 | -0.0703 | 1.89E-01 | TRAT1 | -0.1266 | 1.77E-02* | -0.0603 | 2.60E-01 | ||||||||||||||||||||||||||||||||||||||||||||||||||||||||||||||||||||||||||||||||||||||||||
| ZAP70 | -0.0428 | 4.24E-01 | 0.0398 | 4.58E-01 | |||||||||||||||||||||||||||||||||||||||||||||||||||||||||||||||||||||||||||||||||||||||||||||||
| Cor, R value of Spearman’s correlation; None, correlation without adjustment. Purity, correlation adjusted by purity. *p < 0.05. | |||||||||||||||||||||||||||||||||||||||||||||||||||||||||||||||||||||||||||||||||||||||||||||||||||
After the correlation adjustment by tumor purity, the results revealed the PRPF3 expression level was significantly correlated with most immune marker sets of various immune cells in LIHC. Table 2 showed the examples of the purity-corrected partial Spearman’s correlation between PRPF3 and marker genes of activated T cells. In activated CD8 T cells, PRPF3 is highly correlated with Myelin Protein Zero Like 1 (MPZL1). Indeed, AMP of MPZL1 promotes tumor cell migration through Src-mediated phosphorylation of cortactin in HCC [19]. For activated CD4 T cells, PRPF3 is significantly correlated with NUF2 Component Of NDC80 Kinetochore Complex (NUF2), which was suggested as a valuable prognostic biomarker to predict early recurrence of HCC [20]. Dendritic cell (DC) markers such as TTK Protein Kinase (TTK), Kinesin Family Member 2C (KIF2C), Centrosomal Protein 55 (CEP55), Sperm Flagellar 2 (SPEF2), Opa Interacting Protein 5 (OIP5), and Tubulin Polymerization Promoting Protein Family Member 2 (TPPP2), etc., were also shown significant correlations with PRPF3 expression.
We also found significant correlations between PRPF3 and marker genes of Treg and myeloid-derived suppressor cell (MDSC), such as Methyltransferase Like 7A (METTL7A), Adenosine Deaminase TRNA Specific 2 (ADAT2), LDL Receptor Related Protein 1 (LRP1), Lysosomal Protein Transmembrane 4 Beta (LAPTM4B), Nuclear Factor Erythroid 2-Related Factor 3 (NFE2L3), Leucine Rich Repeat Containing 42 (LRRC42), CD14, Suppressor Of Cytokine Signaling 2 (SOCS2), Hydroxysteroid Dehydrogenase Like 2 (HSDL2), and Ankyrin Repeat Domain 10 (ANKRD10). Interestingly, LAPTM4B decreases Transforming Growth Factor Beta 1 (TGF-β1) production in human Treg cells [21]. A recent study identified the existence of a monocytic subset of MDSCs with the CD14+HLA-DR−/low phenotype that suppresses the proliferation of T cells [22]. The frequency of CD14+HLA-DR−/low MDSCs was significantly higher in HCC patients [23].
In immunoinhibitory genes, results showed the expression levels of Cytotoxic T-Lymphocyte Associated Protein 4 (CTLA4) and Programmed Cell Death 1 (PD-1), and Programmed Cell Death 1 Ligand 2 (PD-L2) have positive or negative correlations with PRPF3 expression, respectively, while TNF Superfamily Member 4 (TNFSF4), Inducible T Cell Costimulator Ligand (ICOSLG), TNF Superfamily Member 9 (TNFSF9), etc., have correlations with PRPF3 expression in immunostimulator genes. Specifically, we showed chemokine (C-C motif) ligand (CCL)-16, CCL14, Interleukin 12A (IL12A), CCL20, CCL26, C-X3-C Motif Chemokine Ligand 1 (CX3CL1), CCL27, and CD19 Molecule (CD19) were significantly correlated with PRPF3 expression (p < 0.0001). Overexpression of the cancer-testis (CT) antigens represents the advanced disease of cancer. High PRPF3 expression relates to high induction of cancer-testis antigen genes in LIHC, such as the significant positive correlation between PRPF3 and NUF2, TTK, KIF2C, CEP55, SPEF2, and OIP5, etc.
Generally, the top 5 markers positively correlated with PRPF3 were Interleukin Enhancer Binding Factor 2 (ILF2), CREB Regulated Transcription Coactivator 2 (CRTC2), NUF2, Exonuclease 1 (EXO1), and TTK. And the top 5 markers negatively correlated with PRPF3 were Transmembrane BAX Inhibitor Motif Containing 6 (TMBIM6), METTL7A, Tubulin Polymerization Promoting Protein Family Member 2 (TPPP2), HIG1 Hypoxia Inducible Domain Family Member 1A (HIGD1A), and Aldo-Keto Reductase Family 7 Member A3 (AKR7A3). Survival map analysis clearly demonstrated the high risk of PRPF3 positively correlated marker genes and the low risk of PRPF3 negatively correlated marker genes (Figure 7D). Therefore, these results further confirm the findings that PRPF3 is specifically correlated with immune infiltrating cells in HCC, which suggests that PRPF3 plays a vital role in immune escape in the tumor microenvironment.
Discussion
Splicing, a key step in gene expression enabling individual genes to encode multiple proteins, is emerging as a major driver of abnormal phenotypic heterogeneity. And it is expected splicing as a potential major source of untapped molecular targets in precision oncology and cancer disparities [24]. PRPF3, a core component of the spliceosome complex, is involved in multiple steps of transcription. To gain more detailed insights into the potential functions of PRPF3 in HCC and its regulatory network, we performed the bioinformatics analysis of public data to guide future research in HCC.
Analysis of transcriptome from more than 3,400 clinical samples comprising six geographic regions and ethnic HCC studies confirmed that PRPF3 mRNA levels and CNVs are significantly higher in HCC than in normal liver tissue (Figure 1). In addition, high expression of PRPF3 was significantly related to poor survival and disease-free state in multiple cohorts. Thus, our results suggest that PRPF3 up-regulation occurs in many cases of HCC and deserves further clinical validation as a potential diagnostic and prognostic marker.
For mining regulators potentially responsible for PRPF3 dysregulation, we found that PRPF3 in HCC is associated with a network of kinases including CDK1, PLK1, AURKB, CHEK1, and CDK2. These kinases regulate genomic stability, mitosis, and the cell cycle, and showed differential expression and survival prognosis in LIHC. In fact, CDK1 participates in the regulation of mitosis, self-renewal, differentiation, and somatic reprogramming. Various inhibitors of CDK1, have been developed, and some have entered phase I and II clinical trials for the treatment of a variety of solid tumors and hematologic malignancies [25]. As a key driver gene, a causal link has recently been established between PLK1 and hepatocarcinogenesis [26]. In HCC, PRPF3 may regulate DNA replication, repair, and cell cycle progression via interacted kinases.
Next, the E2F family constitute the main transcription factors for PRPF3 dysregulation. E2F1 is one of the key links in the cell cycle regulation network. Activated E2F oncogenic signaling was always seen in the progression of liver cancer, and studies have shown that dosage-dependent copy number gains in E2F1 and E2F3 drive HCC [11]. Our results suggest that E2F1 is an important regulator of PRPF3 and that PRPF3 might act through this factor to regulate the cell cycle and proliferation capacity of HCC. Further studies are needed to test this hypothesis. Our study identified no miRNAs that were significantly associated with PRPF3, possibly due to the role of PRPF3 involving in mRNA splicesome, and keeping away from miRNA cellular machinery.
To probe the signaling events in controlling abnormal PRPF3 expression, we tested the PRPF3 co-expression network. Our results suggest that the functional consequence of PRPF3 mainly include spliceosome, DNA repair, DNA replication, and cell cycle, while it inhibits the metabolic processes, such as fatty acid, lipid, antibiotic, nucleoside bisphosphate, and cellular modified amino acid metabolic process. These findings are consistent with the molecular pathways implicated in HCC carcinogenesis [27].
A recent study found that genomic alteration, such as somatic mutations in the genes encoding components of the spliceosome, occurs frequently in human neoplasms [28]. CNVs can have major genomic implications, such as disrupting genes, altering genetic content, and lead to phenotypic differences. Our study found that the copy number of PRPF3 was increased in HCC and that the major type of PRPF3 alteration was AMP, which was associated with shorter survival.
The tumor microenvironment is the non-cancerous cells present in and around a tumor, having a strong influence on the genomic analysis of tumor samples [29]. Since gene dynamics are known to influence belowground genetic diversity and microenvironment processes, co-occurrence analysis was performed. Most co-occurrence genes with PRPF3 CNV were distributed in 1q21 locus. Further, a gene-level network representing the co-occurrence of genes across HCC genomes was built, which gives the clues of PRPF3 role in regulating the immune response. Herein, by tumor purity analysis, the network of PRPF3 alterations is involved in the tumor purity and tumor immunity. Our findings provide a detailed characterization of the association between PRPF3 and immune marker sets in LIHC patients. Further studies need to be done to elucidate whether PRPF3 is a crucial factor in mediating T-cell therapy.
In conclusion, this study provides multi-level evidence for the importance of PRPF3 in hepatocarcinogenesis and its potential as a biomarker in HCC. Our results suggest that PRPF3 up-regulation in HCC may likely have far-reaching effects in RNA splicing and genomic stability, and at multiple steps of the cell cycle. Further, our results suggest a potential novel immune regulatory role of PRPF3 in tumor immunity. These findings call for large-scale HCC genomics research and subsequent functional studies.
Materials and Methods
Databases description
HCCDB database analysis
HCCDB is a database of HCC expression atlas containing 15 public HCC gene expression datasets containing totally 3917 samples [30], including the data from the Gene Expression Omnibus (GEO), Liver Hepatocellular Carcinoma Project of The Cancer Genome Atlas (TCGA-LIHC) and Liver Cancer - RIKEN, JP Project from International Cancer Genome Consortium (ICGC LIRI-JP). HCCDB provides the visualization for the results from several computational analyses, such as differential expression analysis, tissue-specific and tumor-specific expression analysis.
Oncomine database analysis
The expression level of the PRPF3 gene in liver cancers was examined in the Oncomine 4.5 database (https://www.oncomine.org/). Oncomine is a cancer microarray database and web-based data-mining platform. The threshold was determined according to the following values: p-value of 0.05, fold change of 1.5, and gene ranking of all.
UALCAN database analysis
UALCAN (http://ualcan.path.uab.edu) uses TCGA level 3 RNA-seq and clinical data from 31 cancer types [31], allowing analysis of relative expression of genes across tumor and normal samples, as well as in various tumor sub-groups based on individual cancer stages, tumor grade or other clinicopathological features.
GEPIA database analysis
The Gene Expression Profiling Interactive Analysis (GEPIA) database (http://gepia.cancer-pku.cn/) is an interactive web that includes 9,736 tumors and 8,587 normal samples from TCGA and the GTEx projects [32]. GEPIA was used to generate survival curves, including overall survival (OS) and recurrence-free survival (RFS), based on gene expression with the log-rank test and the Mantel-Cox test in liver cancer.
c-BioPortal database analysis
The cBio Cancer Genomics Portal (http://cbioportal.org) has multidimensional cancer genomics data sets [33]. Mutation, copy number variation (CNV), and gene co-occurrence of PRPF3 in HCC were analyzed using the c-BioPortal tool. The tab OncoPrint displays an overview of genetic alterations per sample in PRPF3.
LinkedOmics Database Analysis
The LinkedOmics database (http://www.linkedomics. org/login.php) is a web-based platform for analyzing 32 TCGA cancer-associated multi-dimensional datasets [34]. PRPF3 co-expression was analyzed statistically using Pearson’s correlation coefficient, presenting in volcano plots, heat maps, or scatter plots. Function module of LinkedOmics performs analysis of Gene Ontology biological process (GO_BP), KEGG pathways, kinase-target enrichment, miRNA-target enrichment and transcription factor-target enrichment by the gene set enrichment analysis (GSEA). The rank criterion was FDR < 0.05 and 1000 simulations were performed.
Networkanalyst database analysis
Network interpreting gene expression was used by NetworkAnalyst 3.0 tool (https://www.network analyst.ca/) [35], which integrates cell-type or tissue-specific protein-protein interaction (PPI) networks, gene regulatory networks, and gene co-expression networks. Function enrichment was based on a similar concept introduced by ClueGO and EnrichmentMap [36].
TIMER database analysis
TIMER is a comprehensive resource for systematic analysis of immune infiltrates across diverse cancer types from TCGA (https://cistrome.shinyapps.io/timer/), which includes 10,897 samples across 32 cancer types [37]. TIMER applies a deconvolution method [38] to infer the abundance of tumor-infiltrating immune cells (TIICs) from gene expression profiles. We analyzed PRPF3 expression in LIHC and the correlation of PRPF3 expression with the abundance of immune infiltrates, including B cells, CD4+ T cells, CD8+ T cells, neutrophils, macrophages, and dendritic cells, as well as the tumor purity.
Tumor immunology analysis
Tumor purity was estimated using ESTIMATE and a consensus approach, as previously described [29, 39]. ESTIMATE used the single-sample gene-set enrichment analysis (ssGSEA) score to quantify the enrichment levels of immune signatures in tumor.
Further, gene signatures of 28 tumor-infiltrating lymphocytes (TILs) [40], comprising Activated CD8 T cell, Central memory CD8 T cell, Effector memory CD8 T cell, Activated CD4 T cell, Central memory CD4 T cell, Effector memory CD4 T cell, T follicular helper cell, Gamma delta T cell, Type 1 T helper cell, Type 17 T helper cell, Type 2 T helper cell, Regulatory T cell, Activated B cell, Immature B cell, Memory B cell, Natural killer cell (NK), CD56bright NK, CD56dim NK, Myeloid-derived suppressor cell (MDSC), Natural killer T cell (NKT), Activated dendritic cell, Plasmacytoid dendritic cell, Immature dendritic cell, Macrophage, Eosinophil, Mast cell, Monocyte, Neutrophil, Tumor-associated macrophage (TAM), M1 Macrophage, and M2 Macrophage, as well as markers from multiple types of oncoimmunology containing genes associated with immunomodulators and chemokines, were referenced in prior studies [41].
Statistical analysis
The t-test p < 0.05 was utilized to determine the statistical significance between groups with different expression level of PRPF3. We compared the survival (overall survival (OS) and recurrence-free survival (RFS)) of HCC patients separated by the median expression level of specific genes. Kaplan-Meier curves were used to compare the survival time differences. The log-rank test p < 0.05 indicates the significance of survival time differences. The survival analyses were performed by R programming of “survival” and “survminer” package.
We calculated the correlation between PRPF3 and immune signature score or gene expression levels using the Spearman or partial Spearman method. Tumor purity-corrected partial Spearman’s correlation calculated the correlation between PRPF3 expression and immune genes while controlling for tumor purity, which was explored using ppcor package [42]. The threshold of p < 0.05 indicates the significance of correlation.
Supplementary Materials
Author Contributions
JY and ZXY designed and performed the research, analyzed data, and wrote the manuscript; YLL, YHY, YL, JW, and XYL participated in data preparation, analysis, and figure preparation. All authors have read and approved the manuscript for publication.
Conflicts of Interest
The authors declare no potential conflicts of interest.
Funding
This work was supported by the National Natural Science Foundation of China to Jin Yang (Grant No. 81772520), Zhejiang Provincial Natural Science Foundation to Jin Yang (Grant No. LGF19H030004), Zhejiang medical and health technology project to Jin Yang (Grant No. 2018PY039), Zhejiang Provincial Natural Science Foundation to Zongxing Yang (Grant No. LGF19H190003), and Hangzhou Science and Technology Development Program to Zongxing Yang (Grant No. 20150733Q50).
References
- 1. Ferlay J, Soerjomataram I, Dikshit R, Eser S, Mathers C, Rebelo M, Parkin DM, Forman D, Bray F. Cancer incidence and mortality worldwide: sources, methods and major patterns in GLOBOCAN 2012. Int J Cancer. 2015; 136:E359–86. https://doi.org/10.1002/ijc.29210 [PubMed]
- 2. El-Serag HB, Kanwal F. Epidemiology of hepatocellular carcinoma in the United States: where are we? Where do we go? Hepatology. 2014; 60:1767–75. https://doi.org/10.1002/hep.27222 [PubMed]
- 3. Lohitesh K, Chowdhury R, Mukherjee S. Resistance a major hindrance to chemotherapy in hepatocellular carcinoma: an insight. Cancer Cell Int. 2018; 18:44. https://doi.org/10.1186/s12935-018-0538-7 [PubMed]
- 4. DiStefano JK, Davis B. Diagnostic and Prognostic Potential of AKR1B10 in Human Hepatocellular Carcinoma. Cancers (Basel). 2019; 11:E486. https://doi.org/10.3390/cancers11040486 [PubMed]
- 5. Di C, Syafrizayanti, Zhang Q, Chen Y, Wang Y, Zhang X, Liu Y, Sun C, Zhang H, Hoheisel JD. Function, clinical application, and strategies of Pre-mRNA splicing in cancer. Cell Death Differ. 2019; 26:1181–94. https://doi.org/10.1038/s41418-018-0231-3 [PubMed]
- 6. Coltri PP, Dos Santos MG, da Silva GH. Splicing and cancer: challenges and opportunities. Wiley Interdiscip Rev RNA. 2019; 10:e1527. https://doi.org/10.1002/wrna.1527 [PubMed]
- 7. Pozzi B, Mammi P, Bragado L, Giono LE, Srebrow A. When SUMO met splicing. RNA Biol. 2018; 15:689–95. https://doi.org/10.1080/15476286.2018.1457936 [PubMed]
- 8. Pozzi B, Bragado L, Will CL, Mammi P, Risso G, Urlaub H, Lührmann R, Srebrow A. SUMO conjugation to spliceosomal proteins is required for efficient pre-mRNA splicing. Nucleic Acids Res. 2017; 45:6729–45. https://doi.org/10.1093/nar/gkx213 [PubMed]
- 9. Li X, Cai H, Zheng W, Tong M, Li H, Ao L, Li J, Hong G, Li M, Guan Q, Yang S, Yang D, Lin X, Guo Z. An individualized prognostic signature for gastric cancer patients treated with 5-Fluorouracil-based chemotherapy and distinct multi-omics characteristics of prognostic groups. Oncotarget. 2016; 7:8743–55. https://doi.org/10.18632/oncotarget.7087 [PubMed]
- 10. Niehof M, Borlak J. EPS15R, TASP1, and PRPF3 are novel disease candidate genes targeted by HNF4alpha splice variants in hepatocellular carcinomas. Gastroenterology. 2008; 134:1191–202. https://doi.org/10.1053/j.gastro.2008.01.027 [PubMed]
- 11. Kent LN, Bae S, Tsai SY, Tang X, Srivastava A, Koivisto C, Martin CK, Ridolfi E, Miller GC, Zorko SM, Plevris E, Hadjiyannis Y, Perez M, et al. Dosage-dependent copy number gains in E2f1 and E2f3 drive hepatocellular carcinoma. J Clin Invest. 2017; 127:830–42. https://doi.org/10.1172/JCI87583 [PubMed]
- 12. Basha O, Shpringer R, Argov CM, Yeger-Lotem E. The DifferentialNet database of differential protein-protein interactions in human tissues. Nucleic Acids Res. 2018; 46:D522–26. https://doi.org/10.1093/nar/gkx981 [PubMed]
- 13. Qu C, Qu Y. Down-regulation of salt-inducible kinase 1 (SIK1) is mediated by RNF2 in hepatocarcinogenesis. Oncotarget. 2017; 8:3144–55. https://doi.org/10.18632/oncotarget.13673 [PubMed]
- 14. Pan Y, Wang B, Yang X, Bai F, Xu Q, Li X, Gao L, Ma C, Liang X. CUL4A facilitates hepatocarcinogenesis by promoting cell cycle progression and epithelial-mesenchymal transition. Sci Rep. 2015; 5:17006. https://doi.org/10.1038/srep17006 [PubMed]
- 15. Liu ZP, Wu C, Miao H, Wu H. RegNetwork: an integrated database of transcriptional and post-transcriptional regulatory networks in human and mouse. Database (Oxford). 2015; 2015. https://doi.org/10.1093/database/bav095 [PubMed]
- 16. Convertini P, Todisco S, De Santis F, Pappalardo I, Iacobazzi D, Castiglione Morelli MA, Fondufe-Mittendorf YN, Martelli G, Palmieri F, Infantino V. Transcriptional Regulation Factors of the Human Mitochondrial Aspartate/Glutamate Carrier Gene, Isoform 2 (SLC25A13): USF1 as Basal Factor and FOXA2 as Activator in Liver Cells. Int J Mol Sci. 2019; 20:E1888. https://doi.org/10.3390/ijms20081888 [PubMed]
- 17. Zhu HY, Cao GY, Wang SP, Chen Y, Liu GD, Gao YJ, Hu JP. POU2F1 promotes growth and metastasis of hepatocellular carcinoma through the FAT1 signaling pathway. Am J Cancer Res. 2017; 7:1665–79. [PubMed]
- 18. Choi SH, Chung AR, Kang W, Park JY, Lee MS, Hwang SW, Kim DY, Kim SU, Ahn SH, Kim S, Han KH. Silencing of hypoxia-inducible factor-1β induces anti-tumor effects in hepatoma cell lines under tumor hypoxia. PLoS One. 2014; 9:e103304. https://doi.org/10.1371/journal.pone.0103304 [PubMed]
- 19. Jia D, Jing Y, Zhang Z, Liu L, Ding J, Zhao F, Ge C, Wang Q, Chen T, Yao M, Li J, Gu J, He X. Amplification of MPZL1/PZR promotes tumor cell migration through Src-mediated phosphorylation of cortactin in hepatocellular carcinoma. Cell Res. 2014; 24:204–17. https://doi.org/10.1038/cr.2013.158 [PubMed]
- 20. Wang Y, Tan PY, Handoko YA, Sekar K, Shi M, Xie C, Jiang XD, Dong QZ, Goh BK, Ooi LL, Gao Z, Hui KM. NUF2 is a valuable prognostic biomarker to predict early recurrence of hepatocellular carcinoma after surgical resection. Int J Cancer. 2019; 145:662–70. https://doi.org/10.1002/ijc.32134 [PubMed]
- 21. Huygens C, Liénart S, Dedobbeleer O, Stockis J, Gauthy E, Coulie PG, Lucas S. Lysosomal-associated Transmembrane Protein 4B (LAPTM4B) Decreases Transforming Growth Factor β1 (TGF-β1) Production in Human Regulatory T Cells. J Biol Chem. 2015; 290:20105–16. https://doi.org/10.1074/jbc.M115.655340 [PubMed]
- 22. Haile LA, von Wasielewski R, Gamrekelashvili J, Krüger C, Bachmann O, Westendorf AM, Buer J, Liblau R, Manns MP, Korangy F, Greten TF. Myeloid-derived suppressor cells in inflammatory bowel disease: a new immunoregulatory pathway. Gastroenterology. 2008; 135:871–81, 881.e1-5. https://doi.org/10.1053/j.gastro.2008.06.032 [PubMed]
- 23. Gao XH, Tian L, Wu J, Ma XL, Zhang CY, Zhou Y, Sun YF, Hu B, Qiu SJ, Zhou J, Fan J, Guo W, Yang XR. Circulating CD14+ HLA-DR-/low myeloid-derived suppressor cells predicted early recurrence of hepatocellular carcinoma after surgery. Hepatol Res. 2017; 47:1061–71. https://doi.org/10.1111/hepr.12831 [PubMed]
- 24. Robinson TJ, Freedman JA, Al Abo M, Deveaux AE, LaCroix B, Patierno BM, George DJ, Patierno SR. Alternative RNA Splicing as a Potential Major Source of Untapped Molecular Targets in Precision Oncology and Cancer Disparities. Clin Cancer Res. 2019; 25:2963–68. https://doi.org/10.1158/1078-0432.CCR-18-2445 [PubMed]
- 25. Wang Q, Su L, Liu N, Zhang L, Xu W, Fang H. Cyclin dependent kinase 1 inhibitors: a review of recent progress. Curr Med Chem. 2011; 18:2025–43. https://doi.org/10.2174/092986711795590110 [PubMed]
- 26. Chaisaingmongkol J, Budhu A, Dang H, Rabibhadana S, Pupacdi B, Kwon SM, Forgues M, Pomyen Y, Bhudhisawasdi V, Lertprasertsuke N, Chotirosniramit A, Pairojkul C, Auewarakul CU, et al; TIGER-LC Consortium. Common Molecular Subtypes Among Asian Hepatocellular Carcinoma and Cholangiocarcinoma. Cancer Cell. 2017; 32:57–70.e3. https://doi.org/10.1016/j.ccell.2017.05.009 [PubMed]
- 27. Couri T, Pillai A. Goals and targets for personalized therapy for HCC. Hepatol Int. 2019; 13:125–37. https://doi.org/10.1007/s12072-018-9919-1 [PubMed]
- 28. Palangat M, Anastasakis DG, Fei DL, Lindblad KE, Bradley R, Hourigan CS, Hafner M, Larson DR. The splicing factor U2AF1 contributes to cancer progression through a noncanonical role in translation regulation. Genes Dev. 2019; 33:482–97. https://doi.org/10.1101/gad.319590.118 [PubMed]
- 29. Aran D, Sirota M, Butte AJ. Systematic pan-cancer analysis of tumour purity. Nat Commun. 2015; 6:8971. https://doi.org/10.1038/ncomms9971 [PubMed]
- 30. Lian Q, Wang S, Zhang G, Wang D, Luo G, Tang J, Chen L, Gu J. HCCDB: A Database of Hepatocellular Carcinoma Expression Atlas. Genomics Proteomics Bioinformatics. 2018; 16:269–75. https://doi.org/10.1016/j.gpb.2018.07.003 [PubMed]
- 31. Chandrashekar DS, Bashel B, Balasubramanya SA, Creighton CJ, Ponce-Rodriguez I, Chakravarthi BV, Varambally S. UALCAN: A Portal for Facilitating Tumor Subgroup Gene Expression and Survival Analyses. Neoplasia. 2017; 19:649–58. https://doi.org/10.1016/j.neo.2017.05.002 [PubMed]
- 32. Tang Z, Li C, Kang B, Gao G, Li C, Zhang Z. GEPIA: a web server for cancer and normal gene expression profiling and interactive analyses. Nucleic Acids Res. 2017; 45:W98–102. https://doi.org/10.1093/nar/gkx247 [PubMed]
- 33. Gao J, Aksoy BA, Dogrusoz U, Dresdner G, Gross B, Sumer SO, Sun Y, Jacobsen A, Sinha R, Larsson E, Cerami E, Sander C, Schultz N. Integrative analysis of complex cancer genomics and clinical profiles using the cBioPortal. Sci Signal. 2013; 6:pl1. https://doi.org/10.1126/scisignal.2004088 [PubMed]
- 34. Vasaikar SV, Straub P, Wang J, Zhang B. LinkedOmics: analyzing multi-omics data within and across 32 cancer types. Nucleic Acids Res. 2018; 46:D956–63. https://doi.org/10.1093/nar/gkx1090 [PubMed]
- 35. Zhou G, Soufan O, Ewald J, Hancock RE, Basu N, Xia J. NetworkAnalyst 3.0: a visual analytics platform for comprehensive gene expression profiling and meta-analysis. Nucleic Acids Res. 2019; 47:W234–41. https://doi.org/10.1093/nar/gkz240 [PubMed]
- 36. Reimand J, Isserlin R, Voisin V, Kucera M, Tannus-Lopes C, Rostamianfar A, Wadi L, Meyer M, Wong J, Xu C, Merico D, Bader GD. Pathway enrichment analysis and visualization of omics data using g:Profiler, GSEA, Cytoscape and EnrichmentMap. Nat Protoc. 2019; 14:482–517. https://doi.org/10.1038/s41596-018-0103-9 [PubMed]
- 37. Li T, Fan J, Wang B, Traugh N, Chen Q, Liu JS, Li B, Liu XS. TIMER: A Web Server for Comprehensive Analysis of Tumor-Infiltrating Immune Cells. Cancer Res. 2017; 77:e108–10. https://doi.org/10.1158/0008-5472.CAN-17-0307 [PubMed]
- 38. Li B, Severson E, Pignon JC, Zhao H, Li T, Novak J, Jiang P, Shen H, Aster JC, Rodig S, Signoretti S, Liu JS, Liu XS. Comprehensive analyses of tumor immunity: implications for cancer immunotherapy. Genome Biol. 2016; 17:174. https://doi.org/10.1186/s13059-016-1028-7 [PubMed]
- 39. Yoshihara K, Shahmoradgoli M, Martínez E, Vegesna R, Kim H, Torres-Garcia W, Treviño V, Shen H, Laird PW, Levine DA, Carter SL, Getz G, Stemke-Hale K, et al. Inferring tumour purity and stromal and immune cell admixture from expression data. Nat Commun. 2013; 4:2612. https://doi.org/10.1038/ncomms3612 [PubMed]
- 40. Chen X, Xu C, Hong S, Xia X, Cao Y, McDermott J, Mu Y, Han JJ. Immune Cell Types and Secreted Factors Contributing to Inflammation-to-Cancer Transition and Immune Therapy Response. Cell Rep. 2019; 26:1965–77.e4. https://doi.org/10.1016/j.celrep.2019.01.080 [PubMed]
- 41. Ru B, Wong CN, Tong Y, Zhong JY, Zhong SS, Wu WC, Chu KC, Wong CY, Lau CY, Chen I, Chan NW, Zhang J. TISIDB: an integrated repository portal for tumor-immune system interactions. Bioinformatics. 2019; 35:4200–02. https://doi.org/10.1093/bioinformatics/btz210 [PubMed]
- 42. Kim S. ppcor: An R Package for a Fast Calculation to Semi-partial Correlation Coefficients. Commun Stat Appl Methods. 2015; 22:665–74. https://doi.org/10.5351/CSAM.2015.22.6.665 [PubMed]