


Introduction
Lung adenocarcinoma (LUAD) is a leading cause of cancer related death worldwide and accounts for about 40% of lung cancer patients [1]. Over the last decade, treatment regimens that target epidermal growth factor receptor and anaplastic lymphoma kinase have only benefitted a small fraction of LUAD patients [2, 3]. Clinically defined molecular subtyping of LUAD is in urgent need for precise treatment.
Programmed cell death protein 1/programmed cell death-ligand 1 (PD-1/PD-L1) axis is a critical immune checkpoint pathway that could downregulate response of immune system in lung cancer [4]. Enhanced PD-L1 expression level on tumor cells or tumor infiltrating lymphocytes leads to T cell exhaustion [5], therefore decreasing tumor-specific immune capacity and promoting tumor proliferation [6, 7]. Immune checkpoint blockade (ICB) therapy aimed at PD-1/PD-L1 could repress the negative regulatory signaling and unleash T cell from exhausted status [7]. ICB therapy can reverse the immunosuppressive microenvironment by decreasing the potential of tumor immune escape, therefore, resulting in noteworthy improvement of prognosis [8, 9]. High expression level of PD-L1 was approved by The Food and Drug Administration (FDA) as a biomarker to receive pembrolizumab therapy in non-small-cell lung cancer (NSCLC) [8].
Tumor mutation burden (TMB) is an indicator implicated in better response to ICB treatment, which is independent of PD-L1 expression level [10, 11]. An integrated analysis of 27 cancer types reported positive association between TMB and benefit of ICB treatment [12]. In present clinical practice, the proportion of patients benefitted from ICB therapy remains low. Therefore, the development of new biomarkers to select patient for ICB response rate is definitely required [13, 14].
Tumor Immune Dysfunction and Exclusion (TIDE) algorithm is a computational method using gene expression profile to predict the ICB response in NSCLC and melanoma [15]. TIDE uses a set of gene expression markers to estimate 2 distinct mechanisms of tumor immune evasion, including dysfunction of tumor infiltration cytotoxic T lymphocytes (CTL) and exclusion of CTL by immunosuppressive factors. Patients with higher TIDE score have a higher chance of antitumor immune escape, thus exhibiting lower response rate of ICB treatment [15]. The TIDE score was shown to have a higher accuracy than PD-L1 expression level and TMB in predicting survival outcome of cancer patients treated with ICB agents [15–18]. Several recent studies have reported its utility in predicting or evaluating the ICB therapy efficacy [18–22].
In this study, we performed consensus clustering analysis for LUAD based on immune gene expression signatures and identified 2 subtypes. These 2 subtypes were characterized by significantly different survival outcomes (i.e., low- versus high-risk subtypes), TIDE scores, PD-L1 expression, TMB and enrichment of cell cycle signaling. The high-risk subtype is presumably efficacious towards ICB treatment.
Results
Identification of LUAD subtypes with prognostic significance
A list of 2,995 immune-related genes (See Materials and Methods) was compiled, 433 of which were significantly associated with overall survival (all FDR < 0.05; Supplementary Table 1) in the TCGA LUAD cohort (n = 502). Using this 433-gene panel, we identified 2 distinct LUAD subtypes (Figure 1A and Supplementary Figure 1) by performing consensus clustering analysis. These 2 subtypes were significantly different in survival (HR: 1.99, 95% CI: 1.43-2.76, Log rank P < 0.001; Figure 1B) and we referred them as high-risk and low-risk subtypes. After adjusting for age, gender, stage and smoking status, this association remained statistically significant (HR: 1.80, 95% CI: 1.28-2.53, P < 0.001; Figure 1C).
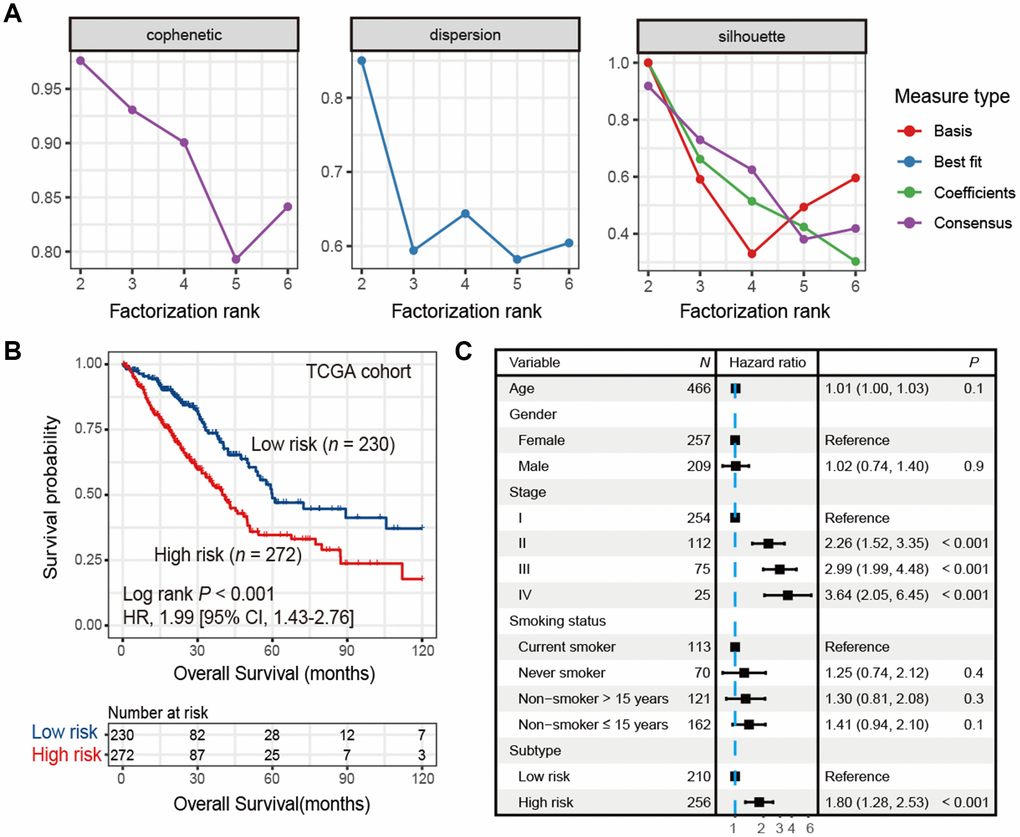
Figure 1. Identification of high-risk and low-risk subtypes of LUAD in TCGA cohort by consensus clustering. (A) The relationship between cophenetic, dispersion and silhouette coefficients with respect to number of clusters. (B) Kaplan-Meier survival plot of the high-risk versus the low-risk subtype. (C) Forest plot representation of multivariate Cox model depicted association between overall survival and LUAD subtypes with other clinical factors taken into account.
To verify the findings in TCGA LUAD cohort, we applied consensus clustering analysis using the aforementioned 433 immune-related genes and performed survival analysis in 9 additional independent LUAD cohorts. Our analysis showed that these 2 distinct subtypes identified in TCGA LUAD cohort were also identified in these 9 validation datasets, in that high-risk group was associated with worse survival outcome (HR range: 1.69 [95% CI: 1.29-2.21, Log rank P < 0.001] to 4.29 [95% CI: 2.14-8.65, Log rank P < 0.001]; Figure 2A–2I). These associations remained statistically significant after controlling for other confounding factors (Supplementary Figure 2A–2I). Result of another LUAD dataset GSE81089 (n = 108) showed a consistent trend although did not reach statistical significance (HR: 1.59, 95% CI: 0.89-2.85, Log rank P = 0.11; Supplementary Figure 3A). No significant association was observed for lung squamous cell carcinoma from TCGA dataset (HR: 1.03, 95% CI: 0.78-1.35, Log rank P = 0.86; Supplementary Figure 3B).
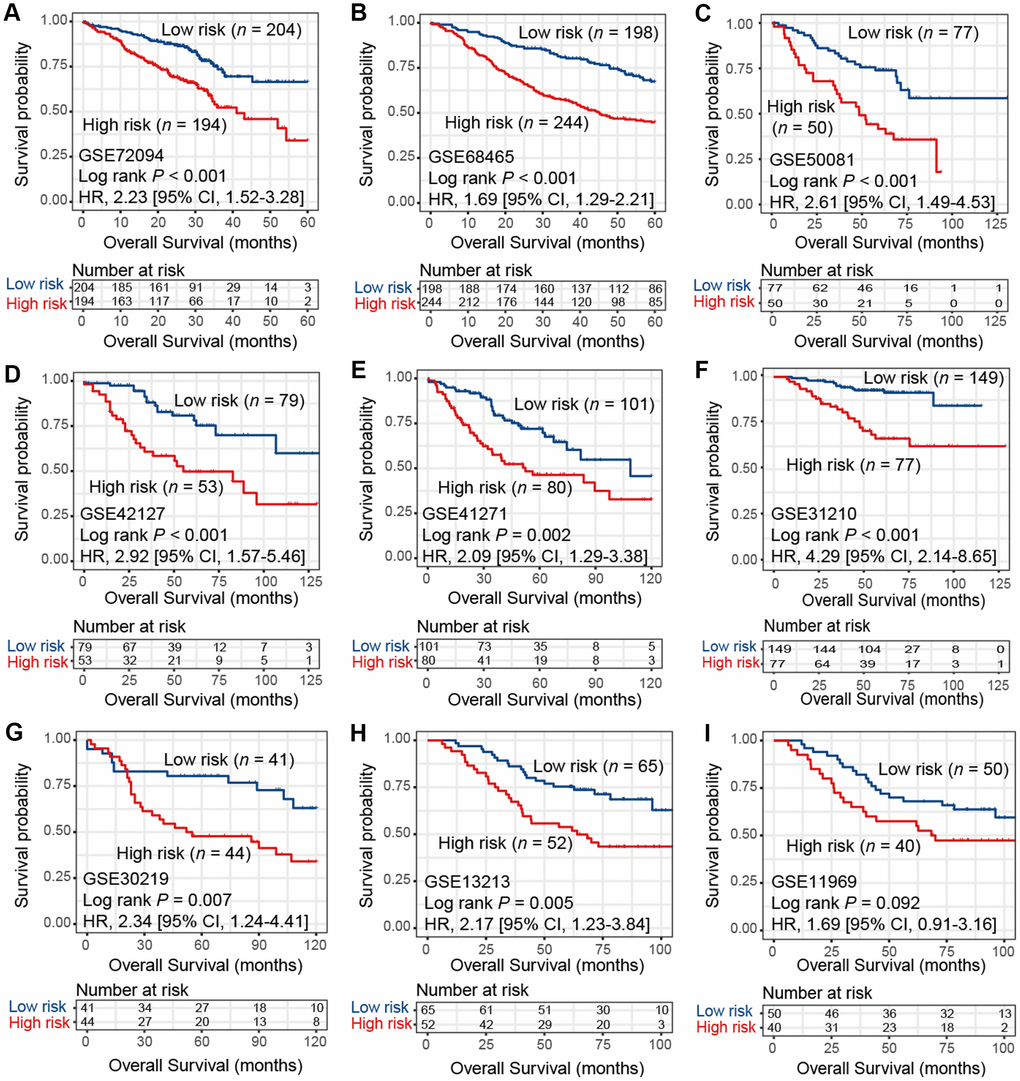
Figure 2. Kaplan-Meier plots of high-risk and low-risk subtypes of LUAD in 9 validation cohorts of (A) GSE72094, (B) GSE68465, (C) GSE50081, (D) GSE42127, (E) GSE41271, (F) GSE31210, (G) GSE30219, (H) GSE13213, and (I) GSE11969.
We obtained an accuracy of 0.947 with 126 genes (Supplementary Figure 4A and Supplementary Table 2) by applying recursive feature elimination to reduce the number of genes. The prognostic significance of high-risk versus low-risk subtypes was maintained using these 126 genes in TCGA and 9 validation cohorts (HR range: 1.84 [95% CI: 1.37-2.48, Log rank P < 0.001] to 5.99 [95% CI: 2.72-12.23, Log rank P < 0.001]; Supplementary Figure 4B–4K).
Predictive ICB response of identified LUAD subtypes
In the TCGA LUAD cohort, the TIDE score was significantly lower in high-risk subtype compared with low-risk subtype (Wilcoxon rank-sum test, P < 0.001; Figure 3A). The difference remained statistically significant after adjusting for age, gender, stage and smoking status (OR: 0.13, 95% CI: 0.08-0.20, P < 0.001; Figure 3B). This association was verified in 9 independent cohorts using univariate analysis (Wilcoxon rank-sum test, P < 0.05; Figure 3C), and 8 of these 9 cohorts showed the same association through multivariate logistic model (P < 0.001; Supplementary Figure 5A–5I). These discoveries suggested that patients of high-risk subtype may be more sensitive to ICB therapy as judged by the TIDE score.
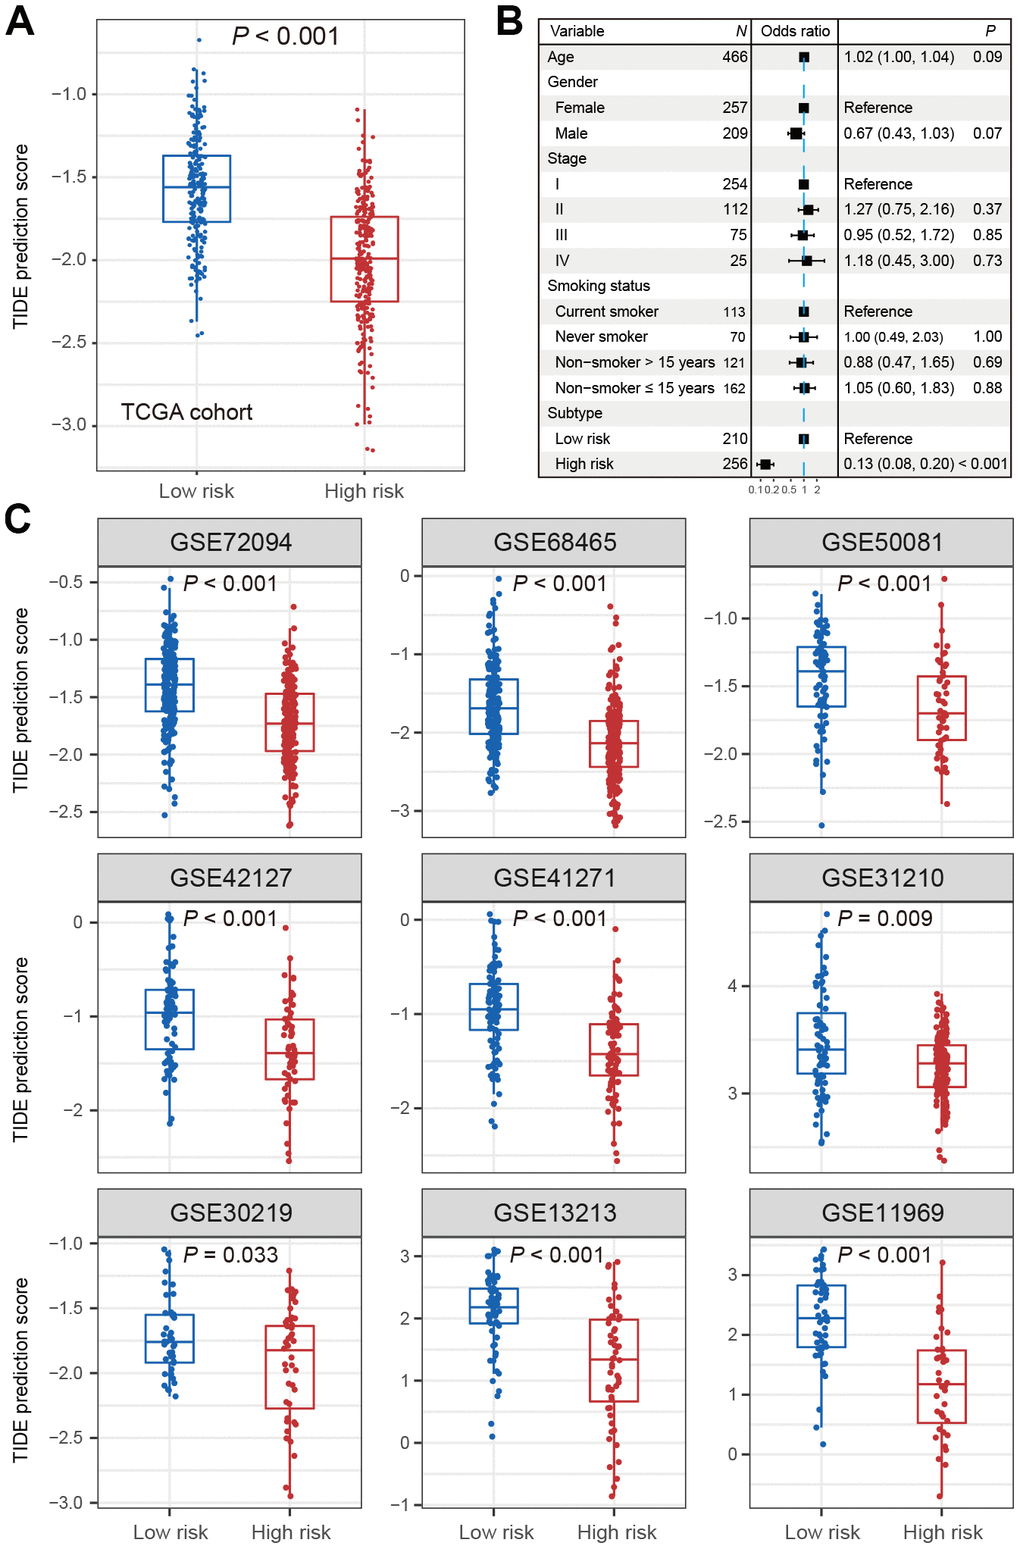
Figure 3. Distribution of TIDE scores in high-risk subtype of LUAD versus low-risk subtype of LUAD. (A) Boxplot representation of TIDE scores in the high-risk group versus low-risk group in TCGA LUAD cohort. (B) Forest plot representation of multivariate model with adjustment for confounding factors in TCGA cohort. (C) Distribution of TIDE scores in 9 independent validation cohorts.
Differences of PD-L1 expression and TMB between 2 LUAD subtypes
The expression of PD-L1 was significantly higher in high-risk group versus low-risk group in TCGA (Wilcoxon rank-sum test, P = 0.003; Figure 4A). Consistent association was also observed in 7 of 9 validation cohorts (Wilcoxon rank-sum test, P < 0.05; Figure 4B). We could not validate this association in the other 2 cohorts (GSE68465 and GSE11969) due to the lack of PD-L1 probes on the expression chip used.
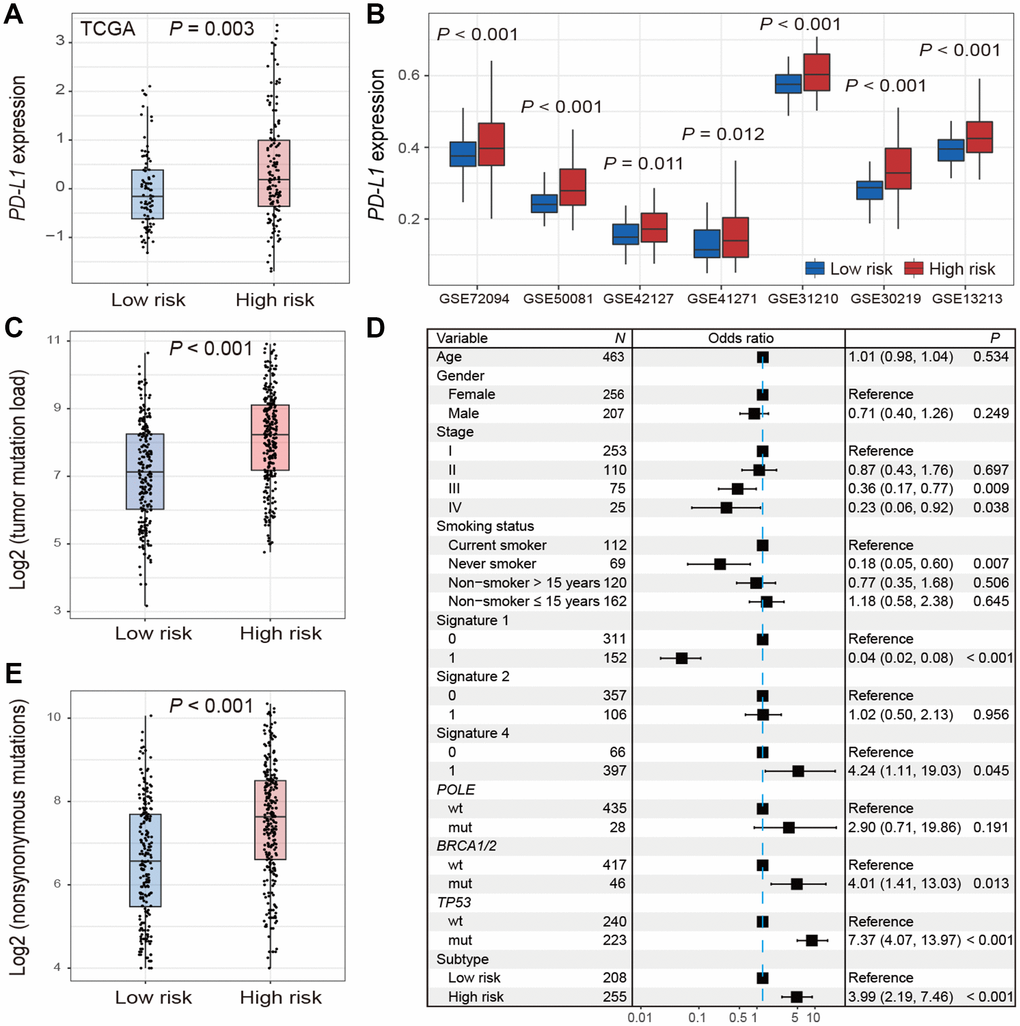
Figure 4. Distribution of PD-L1 expression and tumor mutation burden and their associations with the high-/low-risk subtypes of LUAD. (A, B) Difference in the PD-L1 expression in TCGA and validation cohorts stratified by high-/low-risk subtypes of LUAD. (C–E) Distribution and association of mutation burden in the high-risk group versus low-risk group.
Patients in high-risk subtype had a significantly higher mutation load in TCGA LUAD samples (Wilcoxon rank-sum test, P < 0.001; Figure 4C). Associations between high-risk subtype and TMB remained statistically significant (OR: 3.99, 95% CI: 2.19-7.46, P < 0.001; Figure 4D) after taking into account mutational signatures implicated in age-related deamination of 5-methylcytosine (signature 1), overactivity of mRNA-editing enzyme APOBEC (signature 2) and tobacco smoking-related C>A mutations (signature 4) (Supplementary Figure 6), and mutations in genes related to DNA damage repair (DDR) such as POLE, BRCA1/2, and TP53. Additionally, we found that high-risk subtype harbored a significantly higher nonsynonymous mutation load (Wilcoxon rank-sum test, P < 0.001; Figure 4E).
In TCGA LUAD cohort, association of TMB with survival was not significant. Associations of TIDE score and PD-L1 expression with survival were not significant across TCGA LUAD cohort and the 9 validation cohorts (Supplementary Figure 7).
Functional characterization of the high-risk subtype
Cell cycle relevant signaling pathways were frequently activated in high-risk group as compared with low-risk group (FDR < 0.001; Figure 5A). Molecular markers involved in cell cycle checkpoint were significantly upregulated in the high-risk subtype (Wilcoxon rank-sum test, P < 0.001; Figure 5B). The cell cycle checkpoint markers analyzed include CCND1, CCNE1, CDK2, CDK4 and CDK6 in G1/S checkpoint, and CCNA2 and CDK1 in G2/M checkpoint. Previous studies reported that CDK4 and CDK6 inhibitors could enhance T cell activity [23] and reverse the T cell exclusion signature [24] to obtain better ICB treatment response.
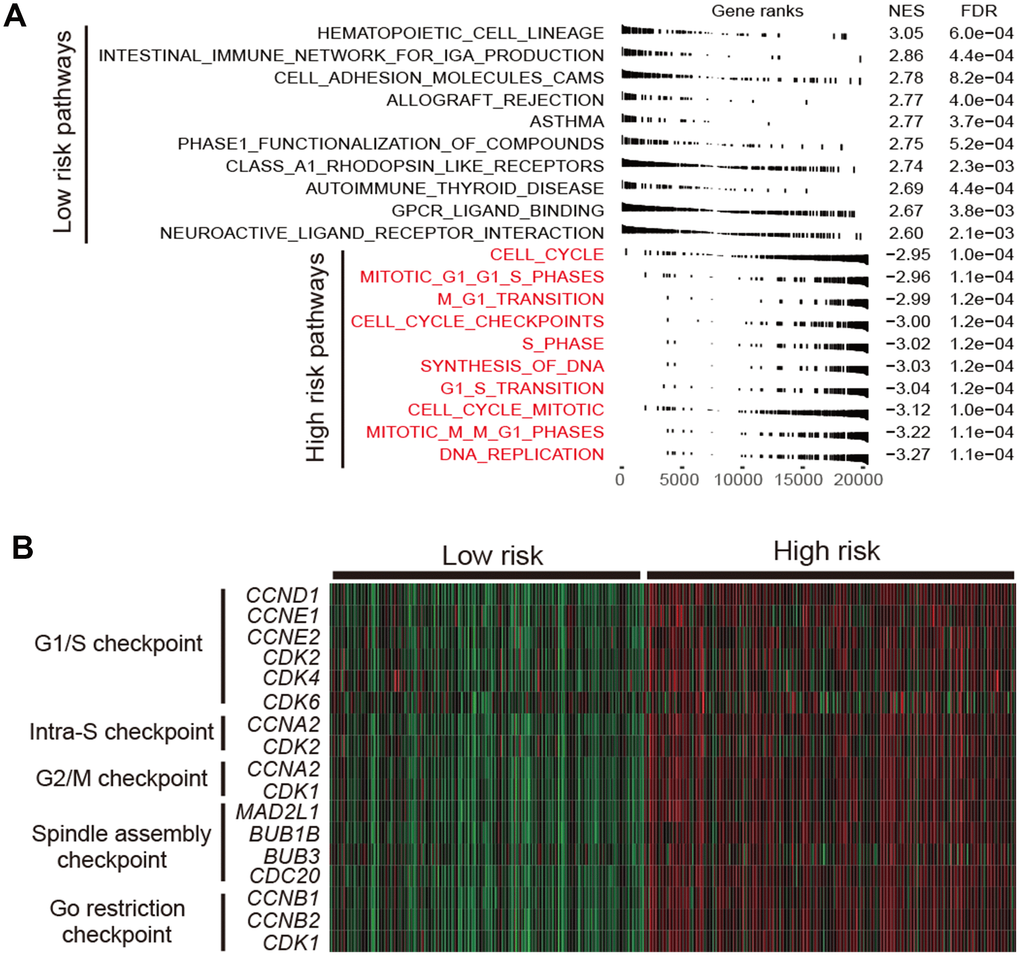
Figure 5. Functional annotation in high-/low-risk subtypes of LUAD. (A) Dysregulation of signaling pathways stratified by identified LUAD subtypes. (B) Expression profiles of cell cycle checkpoint markers in the high-risk group versus low-risk group.
Mutation patterns of SMGs in relation to LUAD subtypes
We identified 23 significantly mutated genes (SMGs) in TCGA LUAD cohort (Supplementary Figure 8). TP53, NAV3, COL11A1, KEAP1 and SMARCA4 were more frequently mutated in high-risk subtype (Fisher exact test, OR > 1, P < 0.05; Figure 6). Association of these SMGs with high-risk subtype remained significant after including age, gender, stage and smoking status (OR > 1, P < 0.01; Supplementary Figure 9). Higher mutation frequency of TP53 in high-risk subtype was observed in 3 validation cohorts that had TP53 mutation data (OR > 1, P < 0.01; Supplementary Figure 10). Mutation data of NAV3, COL11A1, KEAP1 and SMARCA4 of the aforementioned 3 validation cohorts was unavailable. In addition, we found that patients in high-risk subtype were more likely to be male, current smoker, and at advanced clinical stage (chi-square test, P < 0.001; Supplementary Table 3).
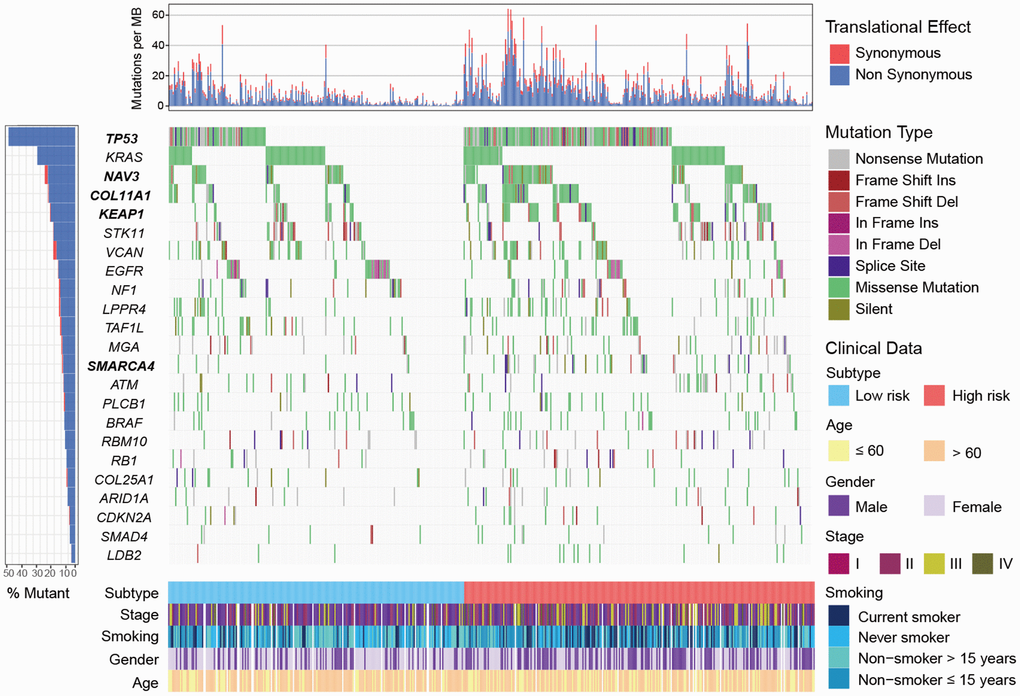
Figure 6. Mutational landscape of SMGs in TCGA LUAD cohort stratified by high-/low-risk subtypes. SMGs with significantly different mutation rate were highlighted in bold.
Discussion
We uncovered 2 prognostic subtypes of LUAD by analyzing 2,300 LUAD samples from TCGA LUAD cohort and 9 independent validation cohorts. The high-risk subtype has significantly lower TIDE score, higher PD-L1 expression and higher TMB. Pathway analysis suggested that high-risk group was featured by activated cell cycle signaling. TP53 mutation was more frequently mutated in the high-risk subtype.
We observed that TIDE score was significantly lower in high-risk subtype than low-risk subtype via univariate regression analysis in TCGA LUAD cohort and 9 validation cohorts. The difference remained statistically significant in multivariate analysis among these cohorts except GSE30219, this is probably due to smaller sample size of GSE30219 cohort (n = 85) as compared with the other LUAD cohorts. These findings suggested that patients of high-risk subtype may be more sensitive to ICB treatment
Based on the KEYNOTE-001 clinical trial, PD-L1 high expression was an essential condition for the use of pembrolizumab in NSCLC [8, 25]. Several studies have reported that PD-L1 high expression was correlated to elevated response rate and survival benefit in ICB therapy of NSCLC, chronic lymphocytic leukemia and urothelial cancer [26–28]. However, in the clinical trial CHECKMATE-032 that enrolled patients with urothelial cancer, no significant difference was observed in response rate between PD-L1 positive and negative subgroups [29]. This suggests that our understanding of association between PD-L1 and ICB response is far from complete and that new markers associated with ICB response are needed. A possible explanation for this inconsistency is attributed to different criterion used for evaluating high and low PD-L1 expression [30]. TMB is emerging as a potential biomarker for predicting response of ICB therapy. Three clinical trials including KEYNOTE-001, CHECKMATE-026 and CHECKMATE-227 showed that patients had high TMB could benefit more from ICB therapy in NSCLC [31–33]. In our study, the high-risk subtype had significantly higher PD-L1 expression and TMB, suggesting a greater potential of ICB therapy response.
Consistent with our findings, Seo et al. identified the immune-defective and immune-competent subtypes in LUAD, and the immune-competent subtype was characterized by activated microenvironment and elevated expression of immune checkpoint genes [34]. In our study, we observed a significant prognostic difference between the high-risk and low-risk subtypes. However, a survival difference was not observed for the 2 subtypes proposed by Seo et al. A recent study from Song et al. also reported identification of the high-risk and low-risk subtypes of LUAD [35]. The high-risk subtype in this study exhibited worse survival outcome and a higher tumor mutation load, which supports our result that the high-risk subtype may be more responsive to immune checkpoint therapy because of the higher tumor mutation load. The prognostic significance of high-risk and low-risk subtypes from our study was validated in GSE31210, a validation dataset used in Song et al. research, whereas subtypes proposed by Song et al. was not significant. Taken together, the gene panels used in our study for molecular subtyping are more generalizable and robust given that we included more validation sets (n=9) as compared with 4 validation cohorts used by Song et al.
Cell cycle relevant pathways and checkpoint markers contributed mostly to the worse prognosis of high-risk subtype were significantly upregulated. These observations suggested the high-risk patients may be suitable to receive cell cycle inhibitors. Previous studies showed that CDK4 and CDK6 inhibitors enhanced the response of ICB in mouse models due to their ability to elevate expression of endogenous retroviruses [36] that was associated with T cell activity [23] and ICB response [37]. Another study reported that the T cell exclusion signature was predictive of poor ICB response, however, CDK4 and CDK6 inhibitors could reverse this signature to get a better response in in vitro experiments in melanoma [24]. The combination therapy of cell cycle inhibitors and ICB agents may be more effective for the high-risk patients.
TP53 was frequently mutated in the high-risk subtype and its mutation was reported to be associated with poorer prognosis [38, 39]. Patients harbored mutations of TP53 had a higher TMB owing to loss of DNA repair function (Figure 4D). Recent study reported that TP53 mutations significantly induced the expression of immune checkpoints and activated T-effector and interferon-γ signature in LUAD, suggesting TP53 mutation patients would be more responsive to checkpoint blockade [40]. Patients of high-risk subtype were more likely to be current smokers. Higher response rate of ICB treatment was observed in smokers of NSCLC [41], typically due to high mutation burden generated by the mutagenic effects of cigarette smoke [42]. These 2 factors may underlie the response to ICB therapy for patients of high-risk group.
There are several limitations in this study. Firstly, gene expression data used in our study was from different platforms, this difference may introduce bias in the analysis procedure. Secondly, results derived from TCGA LUAD mutational landscape were not validated in independent datasets due to the unavailability of mutation data in validation sets. Thirdly, we lacked an in-house validation set.
In summary, we identified 2 prognostically and clinically relevant subtypes of LUAD. Molecular markers suggest that patients from the high-risk subtype may be more responsive to ICB therapy, which needs to be tested in future clinical trials.
Materials and Methods
Collection of genomic data
We collected gene expression profiles of 502 LUAD samples from TCGA-LUAD cohort (https://gdc.cancer.gov) and 1,798 samples from 9 cohorts in Gene Expression Omnibus (GEO) repository (https://www.ncbi.nlm.nih.gov/geo/) (Supplementary Table 4). In total, we obtained 2,300 LUAD samples from 10 independent cohorts (Supplementary Table 5). We also collected clinical data for each cohort. All gene expression data were uniformly normalized. For genes with multiple probes, their expression levels were calculated as the mean expression level of these probes. Only TCGA cohort contained genomic mutation data used in our study. A flow chart to depict the study design was shown in Supplementary Figure 11.
Consensus molecular subtyping with NMF
We used nonnegative matrix factorization (NMF) to perform molecular subtyping [55, 56]. Specifically, NMF was applied to gene expression matrix A that contained prognostically significant immune-related genes aforementioned. Matrix A was factorized into 2 nonnegative matrices W and H (i.e., A≈WH). Repeated factorization of matrix A was performed and its outputs were aggregated to obtain consensus clustering of LUAD samples. The optimal number of subtypes was selected according to cophenetic, dispersion, and silhouette coefficients [57]. The consensus clustering was conducted with R package NMF (version 0.21.0) [58]. The NMF method was also used to extract mutational signatures based on the framework proposed by a previously study [59]. The R code was available in Supplementary Materials and Methods.
Prediction of ICB therapy response
Potential ICB response was predicted with TIDE algorithm [15].
Gene set enrichment analysis
The R package limma (version 3.38.3) [60] and DESeq2 (version 1.22.2) [61] were used to calculate the differential expressed t statistics for microarray and RNA sequencing data. We used t statistic as input to R function fgsea that implemented in fgsea package (version 1.6.0) to perform gene set enrichment analysis (GSEA). Signaling pathways in Molecular Signatures Database (MSigDB) were used in GSEA [62].
Identification of significantly mutated genes
Significantly mutated genes (SMGs) were identified using MutSigCV algorithm [63]. The significant enrichment of non-silent somatic mutations of a gene was measured by MutSigCV through addressing mutational context specific background mutation rates. A gene was considered an SMG if it meets these criteria: statistically significant (q < 0.1), expressed in TCGA LUAD data [64] and encyclopedia of cell lines [65], and mutation rate greater than 3%.
Statistical analyses
R software 3.5.1 was applied in this study for the statistical analyses. Univariate and multivariate Cox proportional hazards model were used to analyze the association between subtypes and prognosis with Rsurvival package. Survival curve was drawn with Kaplan-Meier method and Log-rank test was used to evaluate difference between survival curves. Association between mutation rate of SMGs and 2 subtypes was evaluated by Fisher’s exact test. Multivariate logistic regression was performed to test the association between SMGs and identified LUAD subtypes by taking into account confounding factors. The continuous and categorical variables between 2 subtypes were compared using two-sided Wilcoxon rank-sum test and chi-square test, respectively. Benjamini-Hochberg method was used to adjust for multiple hypothesis testing [61].
Supplementary Materials
Author Contributions
KXC and XCL designed this study; KXC, XCL, and QHW developed the methodology and acquired the related data; XCL, QHW, MLL, MY, YCY, and FJS performed data analysis and interpretation; XCL, KXC, WZ and QHW drafted and revised the manuscript; KXC and XCL supervised this study.
Acknowledgments
We would like to thank Prof. Wei Zhang at the Wake Forest Baptist Comprehensive Cancer Center for his valued suggestions and editing of this manuscript.
Conflicts of Interest
All authors declare no conflicts of interest.
Funding
The study has been supported by the Program for Changjiang Scholars and Innovative Research Team in University in China (IRT_14R40) and National Natural Science Foundation of China (NSFC) (no. 31801117).
References
- 1. Shi J, Hua X, Zhu B, Ravichandran S, Wang M, Nguyen C, Brodie SA, Palleschi A, Alloisio M, Pariscenti G, Jones K, Zhou W, Bouk AJ, et al. Somatic Genomics and Clinical Features of Lung Adenocarcinoma: A Retrospective Study. PLoS Med. 2016; 13:e1002162. https://doi.org/10.1371/journal.pmed.1002162 [PubMed]
- 2. Vargas AJ, Harris CC. Biomarker development in the precision medicine era: lung cancer as a case study. Nat Rev Cancer. 2016; 16:525–37. https://doi.org/10.1038/nrc.2016.56 [PubMed]
- 3. Seo JS, Ju YS, Lee WC, Shin JY, Lee JK, Bleazard T, Lee J, Jung YJ, Kim JO, Shin JY, Yu SB, Kim J, Lee ER, et al. The transcriptional landscape and mutational profile of lung adenocarcinoma. Genome Res. 2012; 22:2109–19. https://doi.org/10.1101/gr.145144.112 [PubMed]
- 4. Kythreotou A, Siddique A, Mauri FA, Bower M, Pinato DJ. Pd-L1. J Clin Pathol. 2018; 71:189–94. https://doi.org/10.1136/jclinpath-2017-204853 [PubMed]
- 5. Witt DA, Donson AM, Amani V, Moreira DC, Sanford B, Hoffman LM, Handler MH, Levy JM, Jones KL, Nellan A, Foreman NK, Griesinger AM. Specific expression of PD-L1 in RELA-fusion supratentorial ependymoma: implications for PD-1-targeted therapy. Pediatr Blood Cancer. 2018; 65:e26960. https://doi.org/10.1002/pbc.26960 [PubMed]
- 6. Zheng B, Ren T, Huang Y, Sun K, Wang S, Bao X, Liu K, Guo W. PD-1 axis expression in musculoskeletal tumors and antitumor effect of nivolumab in osteosarcoma model of humanized mouse. J Hematol Oncol. 2018; 11:16. https://doi.org/10.1186/s13045-018-0560-1 [PubMed]
- 7. Xu-Monette ZY, Zhang M, Li J, Young KH. PD-1/PD-L1 Blockade: Have We Found the Key to Unleash the Antitumor Immune Response? Front Immunol. 2017; 8:1597. https://doi.org/10.3389/fimmu.2017.01597 [PubMed]
- 8. Garon EB, Rizvi NA, Hui R, Leighl N, Balmanoukian AS, Eder JP, Patnaik A, Aggarwal C, Gubens M, Horn L, Carcereny E, Ahn MJ, Felip E, et al, and KEYNOTE-001 Investigators. Pembrolizumab for the treatment of non-small-cell lung cancer. N Engl J Med. 2015; 372:2018–28. https://doi.org/10.1056/NEJMoa1501824 [PubMed]
- 9. Brahmer J, Reckamp KL, Baas P, Crinò L, Eberhardt WE, Poddubskaya E, Antonia S, Pluzanski A, Vokes EE, Holgado E, Waterhouse D, Ready N, Gainor J, et al. Nivolumab versus Docetaxel in Advanced Squamous-Cell Non-Small-Cell Lung Cancer. N Engl J Med. 2015; 373:123–35. https://doi.org/10.1056/NEJMoa1504627 [PubMed]
- 10. Hodges TR, Ott M, Xiu J, Gatalica Z, Swensen J, Zhou S, Huse JT, de Groot J, Li S, Overwijk WW, Spetzler D, Heimberger AB. Mutational burden, immune checkpoint expression, and mismatch repair in glioma: implications for immune checkpoint immunotherapy. Neuro Oncol. 2017; 19:1047–57. https://doi.org/10.1093/neuonc/nox026 [PubMed]
- 11. Rizvi H, Sanchez-Vega F, La K, Chatila W, Jonsson P, Halpenny D, Plodkowski A, Long N, Sauter JL, Rekhtman N, Hollmann T, Schalper KA, Gainor JF, et al. Molecular Determinants of Response to Anti-Programmed Cell Death (PD)-1 and Anti-Programmed Death-Ligand 1 (PD-L1) Blockade in Patients With Non-Small-Cell Lung Cancer Profiled With Targeted Next-Generation Sequencing. J Clin Oncol. 2018; 36:633–41. https://doi.org/10.1200/JCO.2017.75.3384 [PubMed]
- 12. Yarchoan M, Hopkins A, Jaffee EM. Tumor Mutational Burden and Response Rate to PD-1 Inhibition. N Engl J Med. 2017; 377:2500–01. https://doi.org/10.1056/NEJMc1713444 [PubMed]
- 13. Ancevski Hunter K, Socinski MA, Villaruz LC. PD-L1 Testing in Guiding Patient Selection for PD-1/PD-L1 Inhibitor Therapy in Lung Cancer. Mol Diagn Ther. 2018; 22:1–10. https://doi.org/10.1007/s40291-017-0308-6 [PubMed]
- 14. Janjigian YY, Sanchez-Vega F, Jonsson P, Chatila WK, Hechtman JF, Ku GY, Riches JC, Tuvy Y, Kundra R, Bouvier N, Vakiani E, Gao J, Heins ZJ, et al. Genetic Predictors of Response to Systemic Therapy in Esophagogastric Cancer. Cancer Discov. 2018; 8:49–58. https://doi.org/10.1158/2159-8290.CD-17-0787 [PubMed]
- 15. Jiang P, Gu S, Pan D, Fu J, Sahu A, Hu X, Li Z, Traugh N, Bu X, Li B, Liu J, Freeman GJ, Brown MA, et al. Signatures of T cell dysfunction and exclusion predict cancer immunotherapy response. Nat Med. 2018; 24:1550–58. https://doi.org/10.1038/s41591-018-0136-1 [PubMed]
- 16. Kaderbhaï C, Tharin Z, Ghiringhelli F. The Role of Molecular Profiling to Predict the Response to Immune Checkpoint Inhibitors in Lung Cancer. Cancers (Basel). 2019; 11:11. https://doi.org/10.3390/cancers11020201 [PubMed]
- 17. Keenan TE, Burke KP, Van Allen EM. Genomic correlates of response to immune checkpoint blockade. Nat Med. 2019; 25:389–402. https://doi.org/10.1038/s41591-019-0382-x [PubMed]
- 18. Wang S, He Z, Wang X, Li H, Liu XS. Antigen presentation and tumor immunogenicity in cancer immunotherapy response prediction. eLife. 2019; 8:8. https://doi.org/10.7554/eLife.49020 [PubMed]
- 19. Liu D, Schilling B, Liu D, Sucker A, Livingstone E, Jerby-Amon L, Zimmer L, Gutzmer R, Satzger I, Loquai C, Grabbe S, Vokes N, Margolis CA, et al. Integrative molecular and clinical modeling of clinical outcomes to PD1 blockade in patients with metastatic melanoma. Nat Med. 2019; 25:1916–27. https://doi.org/10.1038/s41591-019-0654-5 [PubMed]
- 20. Bretz AC, Parnitzke U, Kronthaler K, Dreker T, Bartz R, Hermann F, Ammendola A, Wulff T, Hamm S. Domatinostat favors the immunotherapy response by modulating the tumor immune microenvironment (TIME). J Immunother Cancer. 2019; 7:294. https://doi.org/10.1186/s40425-019-0745-3 [PubMed]
- 21. Pallocca M, Angeli D, Palombo F, Sperati F, Milella M, Goeman F, De Nicola F, Fanciulli M, Nisticò P, Quintarelli C, Ciliberto G. Combinations of immuno-checkpoint inhibitors predictive biomarkers only marginally improve their individual accuracy. J Transl Med. 2019; 17:131. https://doi.org/10.1186/s12967-019-1865-8 [PubMed]
- 22. George AP, Kuzel TM, Zhang Y, Zhang B. The Discovery of Biomarkers in Cancer Immunotherapy. Comput Struct Biotechnol J. 2019; 17:484–97. https://doi.org/10.1016/j.csbj.2019.03.015 [PubMed]
- 23. Rooney MS, Shukla SA, Wu CJ, Getz G, Hacohen N. Molecular and genetic properties of tumors associated with local immune cytolytic activity. Cell. 2015; 160:48–61. https://doi.org/10.1016/j.cell.2014.12.033 [PubMed]
- 24. Jerby-Arnon L, Shah P, Cuoco MS, Rodman C, Su MJ, Melms JC, Leeson R, Kanodia A, Mei S, Lin JR, Wang S, Rabasha B, Liu D, et al. A Cancer Cell Program Promotes T Cell Exclusion and Resistance to Checkpoint Blockade. Cell. 2018; 175:984–997.e24. https://doi.org/10.1016/j.cell.2018.09.006 [PubMed]
- 25. Eisenstein M. Making cancer immunotherapy a surer bet. Nature. 2017; 552:S72–73. https://doi.org/10.1038/d41586-017-08704-5 [PubMed]
- 26. Reck M, Rodríguez-Abreu D, Robinson AG, Hui R, Csőszi T, Fülöp A, Gottfried M, Peled N, Tafreshi A, Cuffe S, O’Brien M, Rao S, Hotta K, et al, and KEYNOTE-024 Investigators. Pembrolizumab versus Chemotherapy for PD-L1-Positive Non-Small-Cell Lung Cancer. N Engl J Med. 2016; 375:1823–33. https://doi.org/10.1056/NEJMoa1606774 [PubMed]
- 27. Ding W, LaPlant BR, Call TG, Parikh SA, Leis JF, He R, Shanafelt TD, Sinha S, Le-Rademacher J, Feldman AL, Habermann TM, Witzig TE, Wiseman GA, et al. Pembrolizumab in patients with CLL and Richter transformation or with relapsed CLL. Blood. 2017; 129:3419–27. https://doi.org/10.1182/blood-2017-02-765685 [PubMed]
- 28. Balar AV, Castellano D, O’Donnell PH, Grivas P, Vuky J, Powles T, Plimack ER, Hahn NM, de Wit R, Pang L, Savage MJ, Perini RF, Keefe SM, et al. First-line pembrolizumab in cisplatin-ineligible patients with locally advanced and unresectable or metastatic urothelial cancer (KEYNOTE-052): a multicentre, single-arm, phase 2 study. Lancet Oncol. 2017; 18:1483–92. https://doi.org/10.1016/S1470-2045(17)30616-2 [PubMed]
- 29. Sharma P, Callahan MK, Bono P, Kim J, Spiliopoulou P, Calvo E, Pillai RN, Ott PA, de Braud F, Morse M, Le DT, Jaeger D, Chan E, et al. Nivolumab monotherapy in recurrent metastatic urothelial carcinoma (CheckMate 032): a multicentre, open-label, two-stage, multi-arm, phase 1/2 trial. Lancet Oncol. 2016; 17:1590–98. https://doi.org/10.1016/S1470-2045(16)30496-X [PubMed]
- 30. Yi M, Jiao D, Xu H, Liu Q, Zhao W, Han X, Wu K. Biomarkers for predicting efficacy of PD-1/PD-L1 inhibitors. Mol Cancer. 2018; 17:129. https://doi.org/10.1186/s12943-018-0864-3 [PubMed]
- 31. Rizvi NA, Hellmann MD, Snyder A, Kvistborg P, Makarov V, Havel JJ, Lee W, Yuan J, Wong P, Ho TS, Miller ML, Rekhtman N, Moreira AL, et al. Cancer immunology. Mutational landscape determines sensitivity to PD-1 blockade in non-small cell lung cancer. Science. 2015; 348:124–28. https://doi.org/10.1126/science.aaa1348 [PubMed]
- 32. Carbone DP, Reck M, Paz-Ares L, Creelan B, Horn L, Steins M, Felip E, van den Heuvel MM, Ciuleanu TE, Badin F, Ready N, Hiltermann TJ, Nair S, et al, and CheckMate 026 Investigators. First-Line Nivolumab in Stage IV or Recurrent Non-Small-Cell Lung Cancer. N Engl J Med. 2017; 376:2415–26. https://doi.org/10.1056/NEJMoa1613493 [PubMed]
- 33. Hellmann MD, Ciuleanu TE, Pluzanski A, Lee JS, Otterson GA, Audigier-Valette C, Minenza E, Linardou H, Burgers S, Salman P, Borghaei H, Ramalingam SS, Brahmer J, et al. Nivolumab plus Ipilimumab in Lung Cancer with a High Tumor Mutational Burden. N Engl J Med. 2018; 378:2093–104. https://doi.org/10.1056/NEJMoa1801946 [PubMed]
- 34. Seo JS, Kim A, Shin JY, Kim YT. Comprehensive analysis of the tumor immune micro-environment in non-small cell lung cancer for efficacy of checkpoint inhibitor. Sci Rep. 2018; 8:14576. https://doi.org/10.1038/s41598-018-32855-8 [PubMed]
- 35. Song Q, Shang J, Yang Z, Zhang L, Zhang C, Chen J, Wu X. Identification of an immune signature predicting prognosis risk of patients in lung adenocarcinoma. J Transl Med. 2019; 17:70. https://doi.org/10.1186/s12967-019-1824-4 [PubMed]
- 36. Goel S, DeCristo MJ, Watt AC, BrinJones H, Sceneay J, Li BB, Khan N, Ubellacker JM, Xie S, Metzger-Filho O, Hoog J, Ellis MJ, Ma CX, et al. CDK4/6 inhibition triggers anti-tumour immunity. Nature. 2017; 548:471–75. https://doi.org/10.1038/nature23465 [PubMed]
- 37. Smith CC, Beckermann KE, Bortone DS, De Cubas AA, Bixby LM, Lee SJ, Panda A, Ganesan S, Bhanot G, Wallen EM, Milowsky MI, Kim WY, Rathmell WK, et al. Endogenous retroviral signatures predict immunotherapy response in clear cell renal cell carcinoma. J Clin Invest. 2018; 128:4804–20. https://doi.org/10.1172/JCI121476 [PubMed]
- 38. Li VD, Li KH, Li JT. TP53 mutations as potential prognostic markers for specific cancers: analysis of data from The Cancer Genome Atlas and the International Agency for Research on Cancer TP53 Database. J Cancer Res Clin Oncol. 2019; 145:625–36. https://doi.org/10.1007/s00432-018-2817-z [PubMed]
- 39. Aisner DL, Sholl LM, Berry LD, Rossi MR, Chen H, Fujimoto J, Moreira AL, Ramalingam SS, Villaruz LC, Otterson GA, Haura E, Politi K, Glisson B, et al, and LCMC2 investigators. The Impact of Smoking and TP53 Mutations in Lung Adenocarcinoma Patients with Targetable Mutations-The Lung Cancer Mutation Consortium (LCMC2). Clin Cancer Res. 2018; 24:1038–47. https://doi.org/10.1158/1078-0432.CCR-17-2289 [PubMed]
- 40. Dong ZY, Zhong WZ, Zhang XC, Su J, Xie Z, Liu SY, Tu HY, Chen HJ, Sun YL, Zhou Q, Yang JJ, Yang XN, Lin JX, et al. Potential Predictive Value of TP53 and KRAS Mutation Status for Response to PD-1 Blockade Immunotherapy in Lung Adenocarcinoma. Clin Cancer Res. 2017; 23:3012–24. https://doi.org/10.1158/1078-0432.CCR-16-2554 [PubMed]
- 41. Brahmer JR, Tykodi SS, Chow LQ, Hwu WJ, Topalian SL, Hwu P, Drake CG, Camacho LH, Kauh J, Odunsi K, Pitot HC, Hamid O, Bhatia S, et al. Safety and activity of anti-PD-L1 antibody in patients with advanced cancer. N Engl J Med. 2012; 366:2455–65. https://doi.org/10.1056/NEJMoa1200694 [PubMed]
- 42. Alexandrov LB, Nik-Zainal S, Wedge DC, Aparicio SA, Behjati S, Biankin AV, Bignell GR, Bolli N, Borg A, Børresen-Dale AL, Boyault S, Burkhardt B, Butler AP, et al, and Australian Pancreatic Cancer Genome Initiative, and ICGC Breast Cancer Consortium, and ICGC MMML-Seq Consortium, and ICGC PedBrain. Signatures of mutational processes in human cancer. Nature. 2013; 500:415–21. https://doi.org/10.1038/nature12477 [PubMed]
- 43. Thorsson V, Gibbs DL, Brown SD, Wolf D, Bortone DS, Ou Yang TH, Porta-Pardo E, Gao GF, Plaisier CL, Eddy JA, Ziv E, Culhane AC, Paull EO, et al. The Immune Landscape of Cancer. Immunity. 2018; 48:812–830.e14. https://doi.org/10.1016/j.immuni.2018.03.023 [PubMed]
- 44. Wolf DM, Lenburg ME, Yau C, Boudreau A, van ’t Veer LJ. Gene co-expression modules as clinically relevant hallmarks of breast cancer diversity. PLoS One. 2014; 9:e88309. https://doi.org/10.1371/journal.pone.0088309 [PubMed]
- 45. Cheng WY, Ou Yang TH, Anastassiou D. Biomolecular events in cancer revealed by attractor metagenes. PLoS Comput Biol. 2013; 9:e1002920. https://doi.org/10.1371/journal.pcbi.1002920 [PubMed]
- 46. Cheng WY, Ou Yang TH, Anastassiou D. Development of a prognostic model for breast cancer survival in an open challenge environment. Sci Transl Med. 2013; 5:181ra50. https://doi.org/10.1126/scitranslmed.3005974 [PubMed]
- 47. Bedognetti D, Hendrickx W, Ceccarelli M, Miller LD, Seliger B. Disentangling the relationship between tumor genetic programs and immune responsiveness. Curr Opin Immunol. 2016; 39:150–58. https://doi.org/10.1016/j.coi.2016.02.001 [PubMed]
- 48. Galon J, Angell HK, Bedognetti D, Marincola FM. The continuum of cancer immunosurveillance: prognostic, predictive, and mechanistic signatures. Immunity. 2013; 39:11–26. https://doi.org/10.1016/j.immuni.2013.07.008 [PubMed]
- 49. Hendrickx W, Simeone I, Anjum S, Mokrab Y, Bertucci F, Finetti P, Curigliano G, Seliger B, Cerulo L, Tomei S, Delogu LG, Maccalli C, Wang E, et al. Identification of genetic determinants of breast cancer immune phenotypes by integrative genome-scale analysis. Oncoimmunology. 2017; 6:e1253654. https://doi.org/10.1080/2162402X.2016.1253654 [PubMed]
- 50. Şenbabaoğlu Y, Gejman RS, Winer AG, Liu M, Van Allen EM, de Velasco G, Miao D, Ostrovnaya I, Drill E, Luna A, Weinhold N, Lee W, Manley BJ, et al. Tumor immune microenvironment characterization in clear cell renal cell carcinoma identifies prognostic and immunotherapeutically relevant messenger RNA signatures. Genome Biol. 2016; 17:231. https://doi.org/10.1186/s13059-016-1092-z [PubMed]
- 51. Gentles AJ, Newman AM, Liu CL, Bratman SV, Feng W, Kim D, Nair VS, Xu Y, Khuong A, Hoang CD, Diehn M, West RB, Plevritis SK, Alizadeh AA. The prognostic landscape of genes and infiltrating immune cells across human cancers. Nat Med. 2015; 21:938–45. https://doi.org/10.1038/nm.3909 [PubMed]
- 52. Bindea G, Mlecnik B, Tosolini M, Kirilovsky A, Waldner M, Obenauf AC, Angell H, Fredriksen T, Lafontaine L, Berger A, Bruneval P, Fridman WH, Becker C, et al. Spatiotemporal dynamics of intratumoral immune cells reveal the immune landscape in human cancer. Immunity. 2013; 39:782–95. https://doi.org/10.1016/j.immuni.2013.10.003 [PubMed]
- 53. Godec J, Tan Y, Liberzon A, Tamayo P, Bhattacharya S, Butte AJ, Mesirov JP, Haining WN. Compendium of Immune Signatures Identifies Conserved and Species-Specific Biology in Response to Inflammation. Immunity. 2016; 44:194–206. https://doi.org/10.1016/j.immuni.2015.12.006 [PubMed]
- 54. Subramanian A, Tamayo P, Mootha VK, Mukherjee S, Ebert BL, Gillette MA, Paulovich A, Pomeroy SL, Golub TR, Lander ES, Mesirov JP. Gene set enrichment analysis: a knowledge-based approach for interpreting genome-wide expression profiles. Proc Natl Acad Sci USA. 2005; 102:15545–50. https://doi.org/10.1073/pnas.0506580102 [PubMed]
- 55. Brunet JP, Tamayo P, Golub TR, Mesirov JP. Metagenes and molecular pattern discovery using matrix factorization. Proc Natl Acad Sci USA. 2004; 101:4164–69. https://doi.org/10.1073/pnas.0308531101 [PubMed]
- 56. Gao Y, Church G. Improving molecular cancer class discovery through sparse non-negative matrix factorization. Bioinformatics. 2005; 21:3970–75. https://doi.org/10.1093/bioinformatics/bti653 [PubMed]
- 57. Kim H, Park H. Sparse non-negative matrix factorizations via alternating non-negativity-constrained least squares for microarray data analysis. Bioinformatics. 2007; 23:1495–502. https://doi.org/10.1093/bioinformatics/btm134 [PubMed]
- 58. Gaujoux R, Seoighe C. A flexible R package for nonnegative matrix factorization. BMC Bioinformatics. 2010; 11:367. https://doi.org/10.1186/1471-2105-11-367 [PubMed]
- 59. Kim J, Mouw KW, Polak P, Braunstein LZ, Kamburov A, Kwiatkowski DJ, Rosenberg JE, Van Allen EM, D’Andrea A, Getz G. Somatic ERCC2 mutations are associated with a distinct genomic signature in urothelial tumors. Nat Genet. 2016; 48:600–06. https://doi.org/10.1038/ng.3557 [PubMed]
- 60. Ritchie ME, Phipson B, Wu D, Hu Y, Law CW, Shi W, Smyth GK. limma powers differential expression analyses for RNA-sequencing and microarray studies. Nucleic Acids Res. 2015; 43:e47. https://doi.org/10.1093/nar/gkv007 [PubMed]
- 61. Love MI, Huber W, Anders S. Moderated estimation of fold change and dispersion for RNA-seq data with DESeq2. Genome Biol. 2014; 15:550. https://doi.org/10.1186/s13059-014-0550-8 [PubMed]
- 62. Liberzon A, Subramanian A, Pinchback R, Thorvaldsdóttir H, Tamayo P, Mesirov JP. Molecular signatures database (MSigDB) 3.0. Bioinformatics. 2011; 27:1739–40. https://doi.org/10.1093/bioinformatics/btr260 [PubMed]
- 63. Lawrence MS, Stojanov P, Polak P, Kryukov GV, Cibulskis K, Sivachenko A, Carter SL, Stewart C, Mermel CH, Roberts SA, Kiezun A, Hammerman PS, McKenna A, et al. Mutational heterogeneity in cancer and the search for new cancer-associated genes. Nature. 2013; 499:214–18. https://doi.org/10.1038/nature12213 [PubMed]
- 64. Kandoth C, McLellan MD, Vandin F, Ye K, Niu B, Lu C, Xie M, Zhang Q, McMichael JF, Wyczalkowski MA, Leiserson MD, Miller CA, Welch JS, et al. Mutational landscape and significance across 12 major cancer types. Nature. 2013; 502:333–39. https://doi.org/10.1038/nature12634 [PubMed]
- 65. Klijn C, Durinck S, Stawiski EW, Haverty PM, Jiang Z, Liu H, Degenhardt J, Mayba O, Gnad F, Liu J, Pau G, Reeder J, Cao Y, et al. A comprehensive transcriptional portrait of human cancer cell lines. Nat Biotechnol. 2015; 33:306–12. https://doi.org/10.1038/nbt.3080 [PubMed]