Identification of survival-related DEGs and establishment of a prognostic model
A total of 256 patients were randomly assigned to the training (128 patients) and test (128 patients) groups. A total of 44 DEGs were selected via univariate Cox regression analysis (p<0.05). Following Lasso regression analysis, seven DEGs were selected for multivariate Cox regression analysis (optimal log(Lambda): 7; Figure 2A, 2B). Finally, five key genes highly associated with survival were used to establish the prognostic model: risk score = −0.201×exp(TSPAN7) + 0.284×exp(MYBL2) + 0.941×exp(GCSH) + 0.159×exp(FBN2) + 0.417×exp(DDX39B) (Table 1). Patients were separated into high- and low-risk groups based on this risk score; those in the high-risk group had lower survival rates (p=6.691e−05, Figure 3A). As shown in Figure 3D, these five survival-related DEGs performed satisfactorily in predicting prognosis of STS patients (area under the curve: 0.781). There were obvious differences in expression of the key genes between patients with lower and higher risk scores (Figure 3G). Moreover, those with higher risk scores had shorter survival times. Similar results were obtained for the test group, which validated the prognostic model (Figure 3B, 3E, 3H). Finally, we confirmed the value of this prognostic model by testing it in the overall patient group, which included all patients in the study (Figure 3C, 3F, 3I).
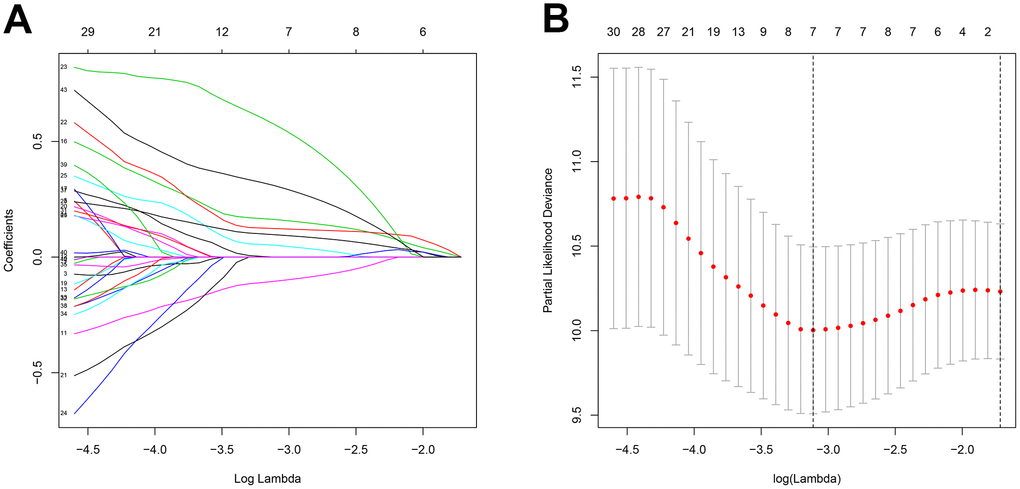
Figure 2. Feature selection using the Lasso regression model. (A) Lasso regression analysis coefficients. (B) Selection of tuning parameters in the Lasso regression analysis based on 1,000 cross-validations.
Table 1. Multivariate Cox regression analysis of key genes.
| Genes | Overall survival |
| coef | HR | 95% CI | p value |
| TSPAN7 | -0.201 | 0.818 | 0.652 | 1.026 | 0.082 |
| MYBL2 | 0.284 | 1.328 | 1.057 | 1.669 | 0.015 |
| GCSH | 0.941 | 2.562 | 1.388 | 4.728 | 0.003 |
| FBN2 | 0.159 | 1.172 | 1.006 | 1.366 | 0.041 |
| DDX39B | 0.417 | 1.518 | 1.071 | 2.150 | 0.019 |
| Note: coef: coefficient; HR: hazard ratio; CI: confidence interval. |
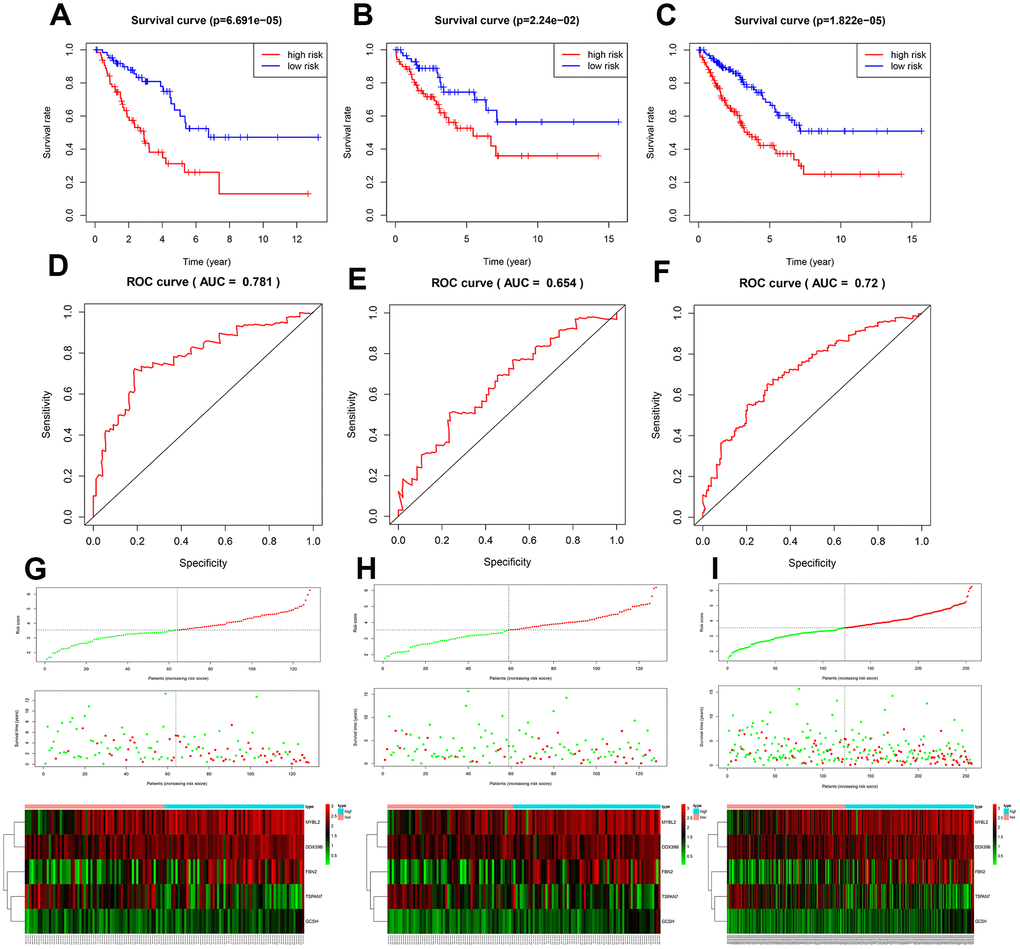
Figure 3. Assessment of the prognostic model. Survival analyses for the training (A), test (B), and overall (C) datasets. Receiver operating curves (ROC) of the prognostic model in the training (D), test (E), and overall (F) datasets. Differences in risk score, survival time, and gene expression between the high- and low-risk groups in the training (G), test (H), and overall (I) datasets.
DISCUSSION
Because it encompasses a large and heterogenous group of malignant tumors with diverse origins, STS is difficult to diagnosis and treat effectively. In addition to conventional diagnosis and treatment, identification of novel specific biomarkers might improve outcomes for both early and advanced stage STS patients [15]. In this study, we attempted to identify potential biomarkers for risk stratification and prognosis prediction in STS patients, as well as small-molecule drugs that might aid in treatment by targeting these biomarkers.
The TCGA and the GTEx databases were utilized to identify differentially expressed genes (DEGs) that might serve as potential biomarkers for STS; univariate Cox regression analysis, Lasso regression analysis, and multivariate Cox regression analysis were then used to select key genes for inclusion in the prognostic model. The DEGs of interest were mainly enriched in mitotic nuclear division, sister chromatid segregation, chromosome segregation, and nuclear division, which are highly associated with tumorigenesis. They were also involved in cell cycle, DNA replication, and the p53 signaling pathway. The p53 signaling pathway is a well-established pathway associated with various types of cancer [16], including sarcomas [17]. A prognostic model was used to generate risk scores based on expression of the five key genes, among which MYBL2 and FBN2 were upregulated, while TSPAN7, GCSH, and DDX39B were downregulated, in STS; validation studies confirmed that this risk score was highly associated with survival. The model was effective in distinguishing between high- and low-risk STS patients and between patients and healthy individuals, regardless of the histological type.
Changes in expression of the five key genes identified here have been reported in different types of cancer, including lung [18], renal [19], breast [20], colorectal [21], prostate [22], and multiple myeloma [23]. In an analysis of gene expression profiles from 13 primary and 15 metastatic uterine leiomyosarcoma cases, Davidson et al. [24] reported that TSPAN7 was overexpressed in primary uterine leiomyosarcoma; however, in our study, TSPAN7 was downregulated in all histological types of STS. This inconsistency might be due to the small sample size in the Davidson study. Consistent with our results, increased expression of TSPAN7, which can inhibit the development of multiple myeloma invivo [23], was associated with longer survival time in clear-cell renal cell carcinoma [25]. FBN2 has been identified as a diagnostic biomarker in leiomyosarcoma and rhabdomyosarcoma [26, 27]. Additionally, aberrant methylation of FBN2 has been observed in breast cancer, non-small cell lung cancer, and esophageal squamous cell carcinoma [28–30]; FBN2 methylation might negatively impact STS prognosis as well. To our knowledge, the role of GCSH has not been examined in STS, but only in breast cancer and papillary thyroid cancer [20, 31]. MYBL2 is associated with poor prognosis in numerous cancers and plays a vital role in the regulation of cell proliferation, cell survival, and differentiation [32]. For example, MYBL2 was recently found to promote progression of Ewing sarcoma [33]. Here, overexpression of MYBL2 was associated with poor outcomes in STS patients. DDX39B, a DExD RNA helicase, is involved in pre-mRNA splicing and nuclear export of mRNAs [34]. Awasthi et al. [35] found that DDX39B could promote global translation and cell proliferation through upregulation of pre-ribosomal RNA, ultimately leading to oncogenesis. In addition, DDX39B is a crucial contributor to Kaposi's sarcoma-associated herpesvirus intronless mRNA nuclear export and virus replication [36]. Because all histological types of STS were characterized by changes in the expression of these five key genes, they might be particularly useful as new prognostic biomarkers for STS. However, the specific roles of these genes in STS need to be examined in future studies.
In this study, we performed multilevel analyses to further explore associations between key genes in STS and immune infiltration, gene alterations, and GSEA pathways. Negative correlations between infiltration of six types of immune cells and risk scores indicated that increased immune cell infiltration contributed to better survival in STS, which is consistent with previous studies [11, 37]. The TCGA Research Network [11] reported that higher NK, T, and dendritic cell levels were associated with better outcomes. In contrast to our findings, Koirala et al. [38] found that increased dendritic cell (DC) and macrophage levels negatively impacted survival in human osteosarcoma. The absence of lymphatic vessels, and the resulting inhibition of antigen-presenting capacity, in human bone tissue might explain these detrimental effects of DCs [39]; this might also highlight important differences in immune infiltration between STS types containing lymphatic vessels and osteosarcoma. Conflicting results have been obtained regarding the association between macrophage infiltration and osteosarcoma prognosis [40], and additional studies are needed on this topic. In this study, we found that expression of two of the key genes, DDX39B and FBN2, was negatively correlated with infiltration of most immune cell types. MYBL2 expression was positively correlated with CD4+ T-cell infiltration, but negatively correlated with B-cell infiltration. TSPAN7 expression was negatively correlated with CD4+ T-cell infiltration and positively with B-cell infiltration. Finally, GCSH expression was not correlated with infiltration for any of the immune cell types examined. We also demonstrated that expression of PDCD1 and CD274 was higher in low-risk patients, suggesting that our prognostic model could potentially identify patients who would benefit from treatment with immune checkpoint inhibitors. Our use of five key genes together in a single model improved its prognostic value compared to the individual genes, based on the comparisons of risk scores with the individual gene expression in the correlations with immune cell infiltration. In addition, survival times were substantially reduced in patients with alterations in these key genes, indicating that they possess accurate prognostic power. Finally, a GSEA analysis revealed that the key genes promoted cell proliferation as well as cancer development and progression via different cell cycle, DNA replication, mismatch repair, and cancer-associated pathways (e.g., phosphatidylinositol signaling system [41], basal cell carcinoma, transforming growth factor beta signaling pathway [42], WNT signaling pathway [43], and the p53 signaling pathway). These signaling pathways have also been reported as important regulators in osteosarcoma and STS [43, 44]. Finally, these key genes might also affect development and progression of STS through interactions with gene fusion products and miRNAs, which not only play important regulatory roles but can also act as therapeutic targets in sarcoma [45]. For example, EWSR1 fusion is common in Ewing sarcoma [46], and EWSR1-FLI1 regulates the expression of MYBL2 [33]. Additional studies of such mechanisms might also help improve diagnosis and treatment of STS.
Our prognostic model based on five key genes was able to stratify STS patients into clinically meaningful high- and low-risk groups which differed significantly in terms of survival. The accuracy of the prognostic model was validated using the test group. In addition, univariate and multivariate Cox regression analyses of our model demonstrated that age, margin status, diagnosis of metastasis, and risk score were independent prognostic factors for STS. Prognostic predictions for STS patients are currently based on the presence of metastases as well as tumor grade, size, and depth [47, 48]. While previous studies have constructed nomograms for prognostic predictions in STS [49], gene expression is not typically included. In this study, we incorporated our risk score together with multiple clinical factors (e.g., age, sex, margin status, diagnosis of metastasis, histological type) to generate a prognostic nomogram with high predictive accuracy for STS patients.
Finally, we identified small-molecule drugs that might improve STS treatment by targeting the key genes using the Camp database. One such drug, Camptothecin, is a topoisomerase inhibitor [50] that inhibited cell proliferation and showed anticancer activity in colon, lung, ovarian, breast, liver, pancreas, and stomach cancer [51] and in Ewing sarcoma [52]. Furthermore, combinations of immune checkpoint inhibitors and the small-molecule drugs might also help improve treatments for STS [53].
This integrated analysis of multiple databases enhanced the robustness and reproducibility of our conclusions; the inclusion of information from the GTEx database was especially helpful in compensating for the paucity of control samples in the TCGA database. In addition, our inclusion of both gene expression and clinical data might render our results especially applicable to STS patients in the clinical setting. However, analysis of additional clinical data is necessary to confirm these results.