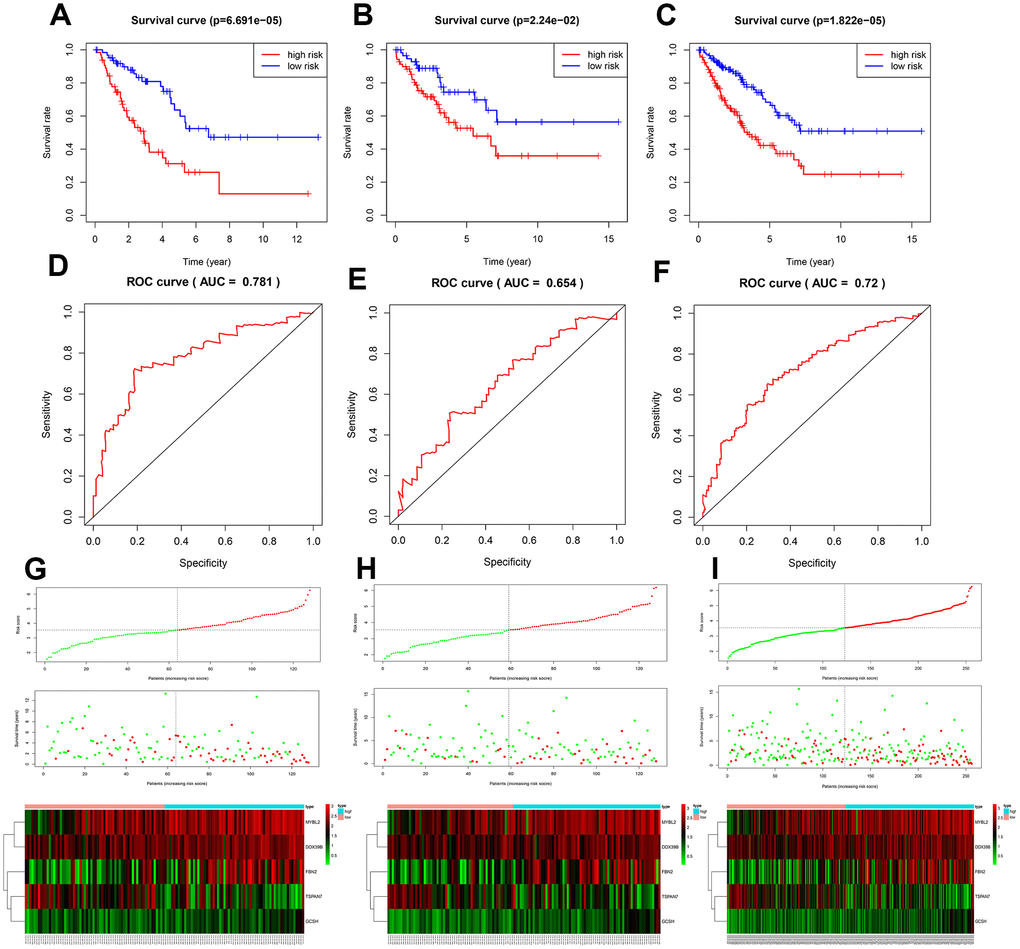
Figure 3.Assessment of the prognostic model. Survival analyses for the training (A), test (B), and overall (C) datasets. Receiver operating curves (ROC) of the prognostic model in the training (D), test (E), and overall (F) datasets. Differences in risk score, survival time, and gene expression between the high- and low-risk groups in the training (G), test (H), and overall (I) datasets.