


Introduction
Renal cell carcinoma (RCC) is one of the most aggressive cancers of the urinary system, accounting for approximately 4% of adult malignancies [1]. The most common histologic subtype clear cell RCC (ccRCC) accounts for approximately 75-80% of RCC, and up to 92% of these cancers have VHL protein inactivation [2–4]. Mutations and inactivation of VHL lead to accumulation of HIF-α proteins and upregulation of HIF-α target genes, which has been considered as a key mechanism to promote the progression of ccRCC [5]. In spite of recent advances in the comprehensive treatments like surgical operation, molecular targeted therapy, chemotherapy and radiation treatment, the 5-year overall survival rate for metastatic ccRCC patients remains as low as 10% to 20% [6]. Therefore, it is imperative to identify new biomarkers and therapeutic targets for ccRCC.
With the development of high-throughput transcriptome analysis in recent years, it has been found that over 90% of the total mammalian genome can be transcribed but does not encode proteins [7]. As a new class of non-coding RNA (ncRNA), long ncRNAs (lncRNAs) longer than 200 nucleotides have been found to be aberrantly expressed in some diseases, particularly in cancer [8, 9]. Although lncRNAs are not involved in protein-coding, they can regulate gene expression at the level of chromatin modification, transcription and post-transcriptional processing [10]. In addition, emerging studies indicate that lncRNAs are differentially expressed in ccRCC and exert critical regulatory effects on a series of cellular processes, such as proliferation, apoptosis and metastasis [11, 12].
Some lncRNAs can encode small nucleolar RNAs (snoRNAs), called small nucleolar RNA host genes (SNHGs). snoRNAs have been considered to be one of the best characterized classes of non-coding RNAs (ncRNAs) with a wide variety of cellular functions, such as chemical RNA modifications (such as methylations and pseudouridylations), pre-RNA processing and alternative splicing control [13–15]. In addition, some snoRNAs have shown differential expression patterns in various human cancers, as well as the ability to affect cell transformation, tumorigenesis, and metastasis [16–18]. For instance, SNORA21 showed oncogenic properties in human colorectal cancer, and elevated SNORA21 served as an independent factor for predicting poor survival [19]; SNORA42 expression was an independent prognostic factor for overall survival and disease-free survival of colorectal cancer [20]. Thus, the SNHGs, as the host genes of snoRNAs, may have multiple regulatory effects on tumor cell processes and play crucial roles in cancer.
Consistent with the above researches, several recent studies have demonstrated that the SNHGs might be valuable prognostic markers in some cancers. GAS5 could inhibit the progression of colorectal cancer by interacting with and triggering YAP phosphorylation and degradation [21]; SNHG15 interacted with and stabilized transcription factor Slug and promoted colon cancer progression [22]; Higher SNHG20 expression was significantly associated with advanced tumor, lymph node and metastases (TNM) stage and tumor size, as well as poorer overall survival [23]. However, there has been relatively little research on the clinical roles of SNHGs in ccRCC specifically. In this study, using RNA-seq and survival data in the Cancer Genome Atlas (TCGA)-Kidney Renal Clear Cell Carcinoma (KIRC), we examined the expression profile of some SNHGs and explored their prognostic values in ccRCC, followed by validation in a certain number of paired clinical samples (adjacent normal renal tissue and ccRCC).
Results
The identification of differentially expressed lncRNAs encoding snoRNAs in ccRCC
In TCGA-KIRC cohort, tumor tissues from 539 cases of ccRCC were subjected to RNA-seq study, among which 72 cases had matched adjacent normal tissues (Figure 1). Using RNA-seq data in TCGA-KIRC, we compared the expression of lncRNAs encoding snoRNAs between ccRCC tissues and the matched adjacent normal tissues. Results showed that compared with adjacent normal tissues, SNHG1, GAS5, SNHG3-8, SNHG11, SNHG12, SNHG15-17, SNHG20, SNHG22 and SNHG25 were significantly upregulated in ccRCC tissues, while SNHG9, SNHG10, DANCR and SNHG14 were remarkably downregulated in ccRCC tissues (Figure 2A–2C).
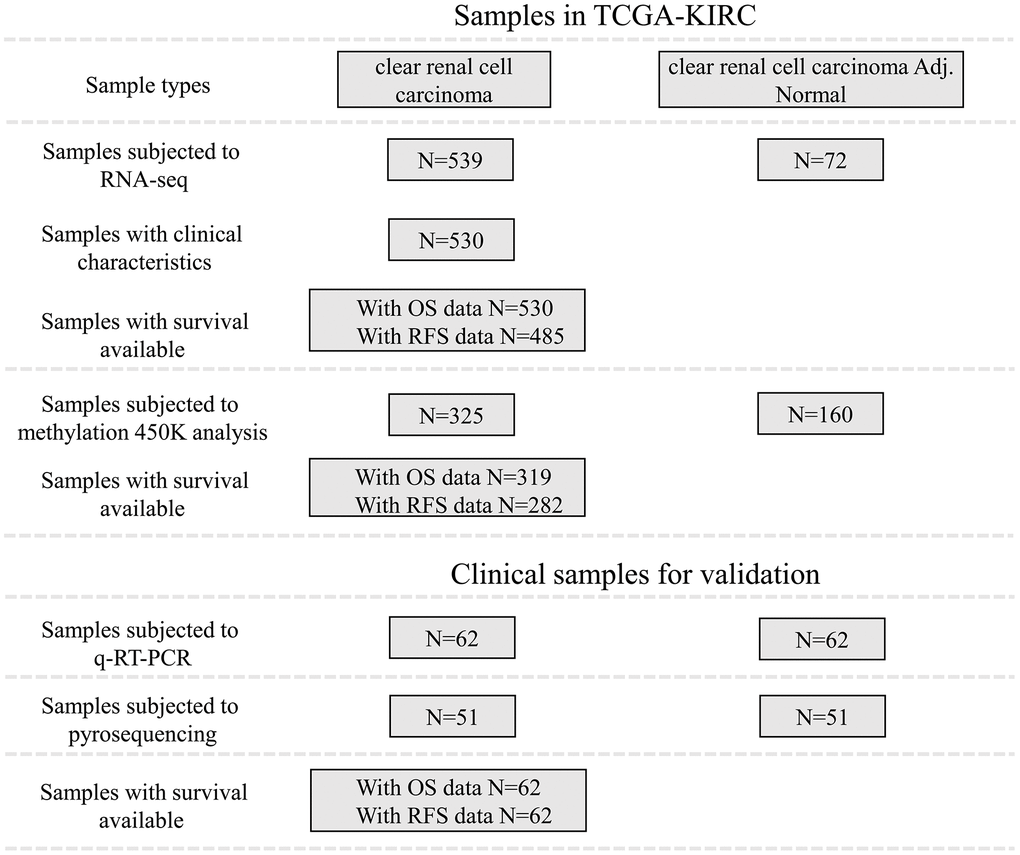
Figure 1. Patient inclusion and data availability.
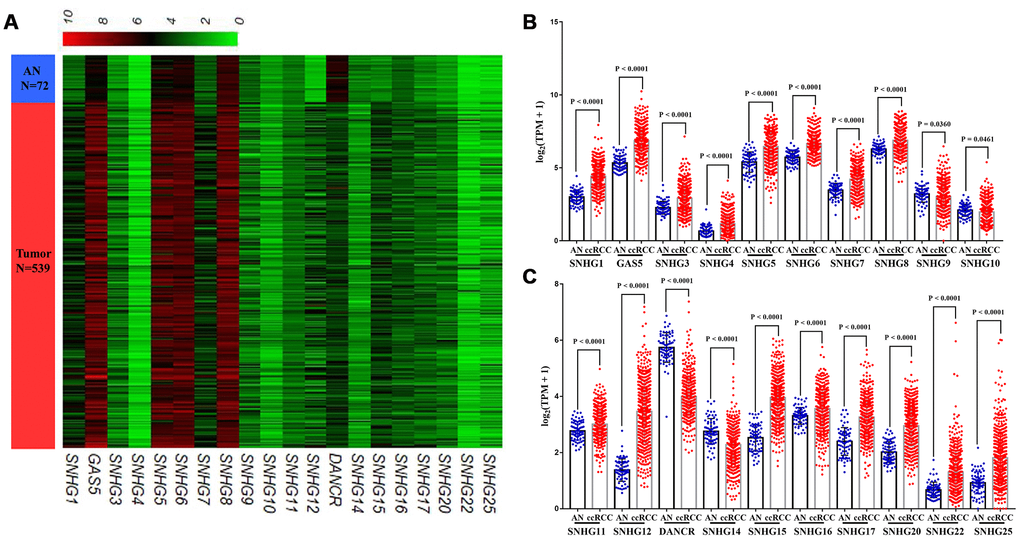
Figure 2. Expression profiles of lncRNAs encoding snoRNA in ccRCC. (A) Heatmap, (B, C) Plots chart showing the expression profile of correlation between SNHG1, GAS5, SNHG3-12, DANCR, SNHG14-17, SNHG20, SNHG22 and SNHG25 between ccRCC tissues and matched adjacent (adj.) normal (AN) tissues.
Association between lncRNAs encoding snoRNAs and survival of ccRCC patients
To explore the prognostic values of lncRNAs encoding snoRNAs, we used the TCGA-Clinical data to analyze their relevances with the Overall Survival (OS) and Relapse-Free survival (RFS) among ccRCC patients by generating Kaplan–Meier survival curves (Figure 1), and the detailed clinical characteristics of patients with ccRCC in TCGA were shown in Table 1. Results of the log-rank test showed that the high expression groups of SNHG3, SNHG4, SNHG12, SNHG15, SNHG17 and SNHG25 had significantly shorter OS, while high SNHG5 and SNHG8 expression groups had remarkably longer OS (Figure 3A). Moreover, results of the log-rank test also showed that the high SNHG15 expression group had significantly shorter RFS than its low expression group (Figure 3B).
Table 1. The clinical characteristics of 530 ccRCC patients in TCGA.
| Clinicopathologic characteristics | n (%) | |
| Age | ||
| <60 | 245 (46.2) | |
| >=60 | 285 (53.8) | |
| Overall Survival | ||
| Alive | 373 (70.4) | |
| Dead | 157 (29.6) | |
| Gender | ||
| Male | 344 (64.9) | |
| Female | 186 (35.1) | |
| Tumor stage | ||
| T1/T2 | 340 (64.2) | |
| T3/T4 | 190 (35.8) | |
| Lymphatic invasion | ||
| N0 | 239 (45.1) | |
| N1 | 16 (3.0) | |
| NX | 275 (51.9) | |
| Metastasis | ||
| M0 | 440 (83.0) | |
| M1 | 80 (15.1) | |
| MX | 10 (1.9) | |
| Pathological stage | ||
| I/II | 322 (61.1) | |
| III/IV | 205 (38.9) | |
| Historical grade | ||
| G1/G2 | 241 (45.7) | |
| G3/G4 | 286 (54.3) | |
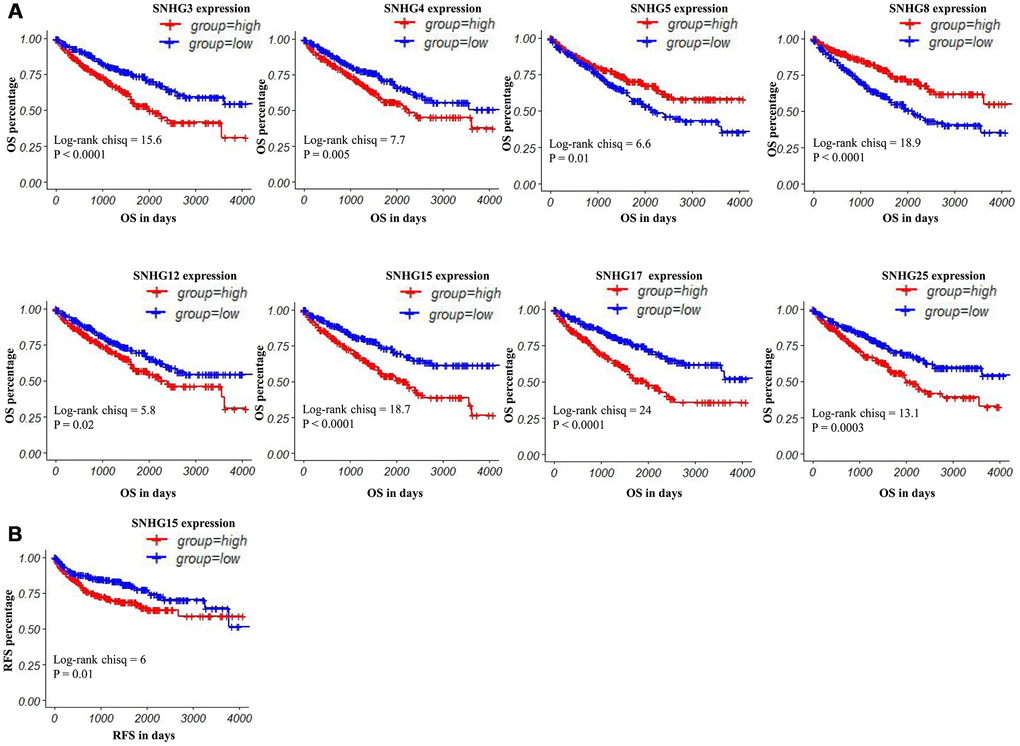
Figure 3. Kaplan–Meier curves of OS and RFS in patients with ccRCC. (A) Patients were grouped according to the median cutoff of SNHG3, SNHG4, SNHG5, SNHG8, SNHG12, SNHG15, SNHG17 and SNHG25 expression for OS detection. (B) Patients were grouped according to the median cutoff of SNHG15 expression for RFS detection.
In univariate analysis, advanced tumor stage/pathological stage/histological grade, metastasis, increased SNHG3/SNHG4 expression and decreased SNHG5/SNHG8 expression were potential risk factors of shorter OS. After adjustment for confounding factors, the multivariate analysis indicated that only advanced pathological stage, metastasis and increased SNHG3 expression were independently associated with shorter OS in ccRCC patients (Table 2). In terms of RFS, advanced tumor stage/pathological stage/histological grade, metastasis and increased SNHG15 expression were potential risk factors of shorter RFS. Moreover, the following multivariate analysis showed that advanced pathological stage/histological grade, metastasis and increased SNHG15 expression were independent predictors of shorter RFS in ccRCC patients (Table 3).
Table 2. Univariate and multivariate analysis of OS in patients with ccRCC.
| Parameters | Univariate analysis | Multivariate analysis | ||||||
| P | HR | 95%CI | P | HR | 95%CI | |||
| Lower | Upper | Lower | Upper | |||||
| Age(Continuous) | 0.4410 | 1.1280 | 0.8306 | 1.5310 | ||||
| Gender | ||||||||
| Male | 1.0000 | |||||||
| Female | 0.8190 | 1.0380 | 0.7555 | 1.4260 | ||||
| Tumor stage | ||||||||
| T1/T2 | 1.0000 | |||||||
| T3/T4 | <0.0001 | 3.2030 | 2.3470 | 4.3680 | 0.8367 | 0.9364 | 0.5014 | 1.7490 |
| Metastasis | ||||||||
| No | 1.0000 | |||||||
| yes | <0.0001 | 4.4130 | 3.2270 | 6.0350 | <0.0001 | 2.6229 | 1.7469 | 3.9380 |
| Pathological stage | ||||||||
| I/II | 1.0000 | |||||||
| III/IV | <0.0001 | 3.8760 | 2.8010 | 5.3630 | 0.0071 | 2.6986 | 1.3103 | 5.5580 |
| Histological grade | ||||||||
| G1/G2 | 1.0000 | |||||||
| G3/G4 | 0.0236 | 1.4390 | 1.0500 | 1.9720 | 0.0780 | 0.7172 | 0.4956 | 1.0380 |
| SNHG3 | 0.0008 | 2.4240 | 2.0543 | 2.9474 | 0.0362 | 1.3401 | 1.0556 | 1.7010 |
| SNHG4 | 0.0178 | 1.3300 | 1.0510 | 1.6830 | 0.4216 | 1.1586 | 0.8091 | 1.6590 |
| SNHG5 | 0.0011 | 0.7783 | 0.6698 | 0.9044 | 0.0631 | 0.8366 | 0.6931 | 1.0100 |
| SNHG8 | 0.0146 | 0.7908 | 0.6551 | 0.9547 | 0.6159 | 0.9400 | 0.7382 | 1.1970 |
| SNHG12 | 0.2140 | 1.0980 | 0.9473 | 1.2730 | ||||
| SNHG15 | 0.1050 | 1.1830 | 0.9655 | 1.4510 | ||||
| SNHG17 | 0.1630 | 1.1810 | 0.9349 | 1.4910 | ||||
| SNHG25 | 0.1590 | 1.1240 | 0.9550 | 1.3240 | ||||
Table 3. Univariate and multivariate analysis of RFS in patients with ccRCC.
| Parameters | Univariate analysis | Multivariate analysis | ||||||
| P | HR | 95%CI | P | HR | 95%CI | |||
| Lower | Upper | Lower | Upper | |||||
| Age (Continuous) | 0.8050 | 1.0020 | 0.9864 | 1.0180 | ||||
| Gender | ||||||||
| Male | 1.0000 | |||||||
| Female | 0.0680 | 0.6767 | 0.4449 | 1.0290 | ||||
| Tumor stage | ||||||||
| T1/T2 | 1.0000 | |||||||
| T3/T4 | <0.0001 | 4.5180 | 3.0690 | 6.6510 | 0.1967 | 0.6334 | 0.3167 | 1.2669 |
| Metastasis | ||||||||
| No | 1.0000 | |||||||
| yes | <0.0001 | 12.0300 | 8.0760 | 17.9100 | <0.0001 | 4.6964 | 2.9147 | 7.5673 |
| Pathological stage | ||||||||
| I/II | 1.0000 | |||||||
| III/IV | <0.0001 | 6.8300 | 4.4650 | 10.4500 | 0.0002 | 4.8308 | 2.1181 | 11.0177 |
| Histological grade | ||||||||
| G1/G2 | 1.0000 | |||||||
| G3/G4 | <0.0001 | 3.3350 | 2.1480 | 5.1760 | 0.0190 | 1.7529 | 1.0966 | 2.8020 |
| SNHG15 | 0.0010 | 1.5440 | 1.1920 | 2.0000 | 0.0248 | 1.3750 | 1.0412 | 1.8158 |
In addition, these SNHGs expression were closely related to some clinical parameters of ccRCC, including tumor stage, lymphatic invasion, metastasis, pathological stage and histological grade (Table 4, Figure 4). Compared with early-stage (T1/T2) ccRCC, the expression levels of SNHG3, SNHG4, SNHG15 and SNHG17 were significantly higher in advanced-stage (T3/T4) ccRCC. Moreover, SNHG3, SNHG4 and SNHG15 were highly expressed in high histological grade ccRCC compared to low histological grade ccRCC. Furthermore, the expression levels of SNHG3 and SNHG15 in ccRCC with remote metastasis were remarkably higher.
Table 4. The correlation between SNHGs expression and the clinical characteristics of ccRCC patients in TCGA-KIRC.
| lncRNAs | Tumor stage | Lymphatic invasion | Metastasis | Pathological stage | Histological grade | |||||
| T1/T2 vs.T3/T4 | No vs.Yes | No vs.Yes | I/II vs.III/IV | G1/G2 vs.G3/G4 | ||||||
| t | p | t | p | t | p | t | p | t | p | |
| SNHG3 | -3.181 | 0.002 | -2.195 | 0.043 | -2.971 | 0.004 | -1.390 | 0.165 | -1.994 | 0.047 |
| SNHG4 | -2.796 | 0.005 | -2.017 | 0.061 | -1.679 | 0.096 | -0.909 | 0.364 | -2.824 | 0.005 |
| SNHG5 | 2.062 | 0.040 | 3.943 | 0.001 | 1.258 | 0.211 | 1.105 | 0.270 | 2.638 | 0.0086 |
| SNHG8 | 5.690 | <0.0001 | 2.462 | 0.023 | 2.389 | 0.019 | 2.453 | 0.015 | 5.891 | <0.0001 |
| SNHG12 | -1.532 | 0.127 | -1.429 | 0.172 | -1.839 | 0.070 | 0.347 | 0.729 | -0.931 | 0.3522 |
| SNHG15 | -3.943 | <0.0001 | -0.180 | 0.859 | -3.658 | 0.0004 | -3.506 | 0.001 | -2.472 | 0.0138 |
| SNHG17 | -3.036 | 0.003 | -1.406 | 0.178 | -2.560 | 0.012 | -1.370 | 0.171 | -1.559 | 0.1197 |
| SNHG25 | -1.556 | 0.121 | -1.439 | 0.169 | -1.922 | 0.057 | -2.162 | 0.031 | -2.444 | 0.0149 |
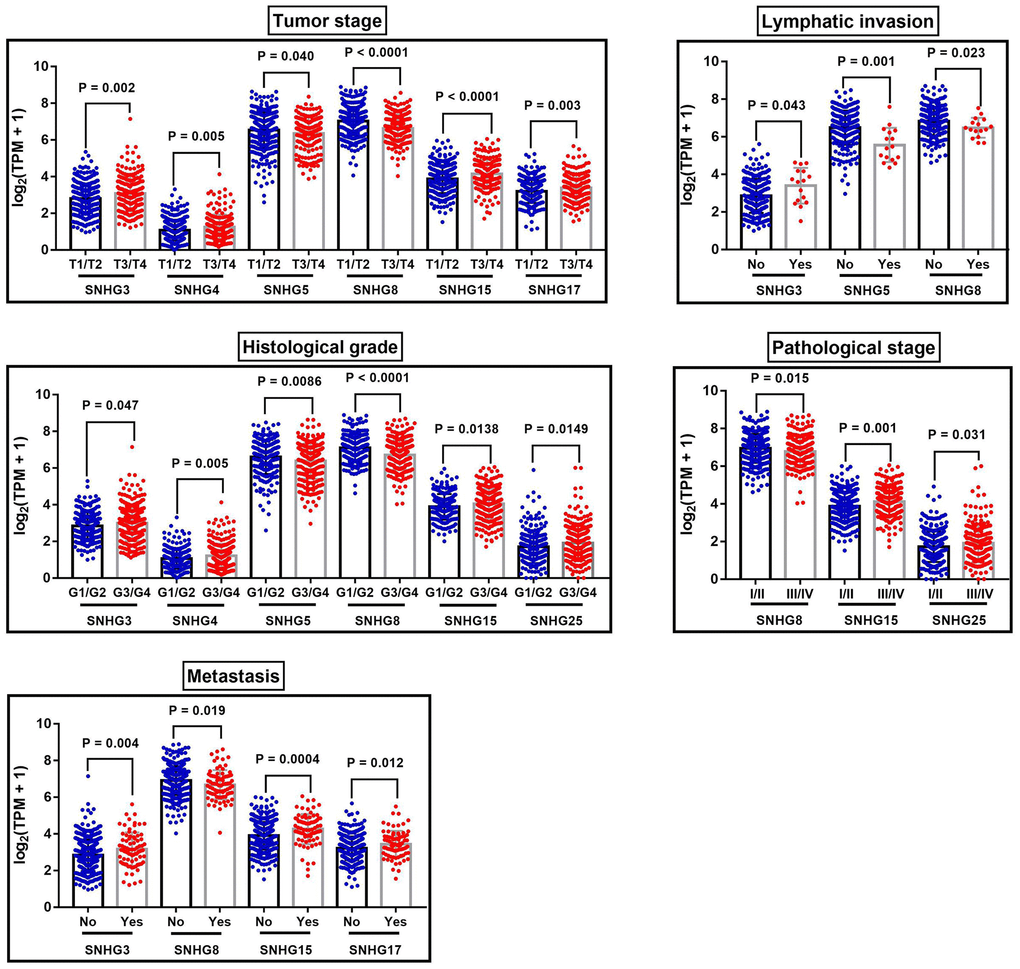
Figure 4. The correlation between SNHGs expression and the clinical characteristics of ccRCC patients. The correlation between SNHGs expression and tumor stage, lymphatic invasion, histological grade, pathological stage and metastasis.
SNHG3 and SNHG15 expression was regulated by DNA methylation
In TCGA-KIRC, 325 ccRCC tissues samples and 160 adjacent normal tissues samples were subjected to DNA methylation analysis simultaneously (Figure 1). Using the methylation data obtained from the Infinium Human Methylation450 BeadChip, we compared the methylation status of 12 CpG sites in SNHG3 DNA, 13 CpG sites in SNHG15 DNA, 22 CpG sites in SNHG12 DNA and 24 CpG sites in SNHG17 DNA (Table 5). The heatmap constructed on beta values of these CpG sites across all 485 samples was shown in Figure 5A–5D. The analysis results showed that compared with adjacent normal tissues, 2 sites of SNHG3 DNA, 3 sites of SNHG15 DNA, 6 sites of SNHG12 DNA and 8 sites of SNHG17 DNA were significantly hypomethylated in ccRCC (Figure 5E–5H).
Table 5. The detailed information of CpG sites of SNHG3, SNHG15, SNHG12 and SNHG17 DNA.
| Composite element REF | Chromosome | Start | End | CGI_Coordinate |
| SNHG3 | ||||
| cg07807470 | chr1 | 28510838 | 28510839 | CGI:chr1:28518141-28518781 |
| cg08935021 | chr1 | 28506029 | 28506030 | CGI:chr1:28518141-28518781 |
| cg10700647 | chr1 | 28506126 | 28506127 | CGI:chr1:28518141-28518781 |
| cg15161854 | chr1 | 28509627 | 28509628 | CGI:chr1:28518141-28518781 |
| cg16013246 | chr1 | 28505956 | 28505957 | CGI:chr1:28518141-28518781 |
| cg16013618 | chr1 | 28507076 | 28507077 | CGI:chr1:28518141-28518781 |
| cg22238707 | chr1 | 28506552 | 28506553 | CGI:chr1:28518141-28518781 |
| cg23738833 | chr1 | 28505869 | 28505870 | CGI:chr1:28518141-28518781 |
| cg24469114 | chr1 | 28506476 | 28506477 | CGI:chr1:28518141-28518781 |
| cg25775721 | chr1 | 28505362 | 28505363 | CGI:chr1:28518141-28518781 |
| cg26419621 | chr1 | 28507275 | 28507276 | CGI:chr1:28518141-28518781 |
| cg26793226 | chr1 | 28506061 | 28506062 | CGI:chr1:28518141-28518781 |
| SNHG15 | ||||
| cg00762623 | chr7 | 44986421 | 44986422 | CGI:chr7:44986359-44987027 |
| cg00953154 | chr7 | 44986021 | 44986022 | CGI:chr7:44986359-44987027 |
| cg02422847 | chr7 | 44986984 | 44986985 | CGI:chr7:44986359-44987027 |
| cg02698620 | chr7 | 44986980 | 44986981 | CGI:chr7:44986359-44987027 |
| cg03440944 | chr7 | 44983730 | 44983731 | CGI:chr7:44986359-44987027 |
| cg06057141 | chr7 | 44986818 | 44986819 | CGI:chr7:44986359-44987027 |
| cg07097673 | chr7 | 44986749 | 44986750 | CGI:chr7:44986359-44987027 |
| cg11881910 | chr7 | 44986660 | 44986661 | CGI:chr7:44986359-44987027 |
| cg12393589 | chr7 | 44988044 | 44988045 | CGI:chr7:44986359-44987027 |
| cg16459265 | chr7 | 44985481 | 44985482 | CGI:chr7:44986359-44987027 |
| cg18205465 | chr7 | 44986944 | 44986945 | CGI:chr7:44986359-44987027 |
| cg18544085 | chr7 | 44986751 | 44986752 | CGI:chr7:44986359-44987027 |
| cg22557029 | chr7 | 44986812 | 44986813 | CGI:chr7:44986359-44987027 |
| SNHG12 | ||||
| cg00261162 | chr1 | 28580966 | 28580967 | CGI:chr1:28581557-28582287 |
| cg01198591 | chr1 | 28582493 | 28582494 | CGI:chr1:28581557-28582287 |
| cg03542031 | chr1 | 28579698 | 28579699 | CGI:chr1:28581557-28582287 |
| cg04206337 | chr1 | 28581041 | 28581042 | CGI:chr1:28581557-28582287 |
| cg04872869 | chr1 | 28582125 | 28582126 | CGI:chr1:28581557-28582287 |
| cg07033395 | chr1 | 28580026 | 28580027 | CGI:chr1:28581557-28582287 |
| cg07944736 | chr1 | 28581714 | 28581715 | CGI:chr1:28581557-28582287 |
| cg09513672 | chr1 | 28582258 | 28582259 | CGI:chr1:28581557-28582287 |
| cg10053149 | chr1 | 28581997 | 28581998 | CGI:chr1:28581557-28582287 |
| cg11191040 | chr1 | 28581122 | 28581123 | CGI:chr1:28581557-28582287 |
| cg11573859 | chr1 | 28581227 | 28581228 | CGI:chr1:28581557-28582287 |
| cg11753765 | chr1 | 28582446 | 28582447 | CGI:chr1:28581557-28582287 |
| cg12640482 | chr1 | 28579061 | 28579062 | CGI:chr1:28581557-28582287 |
| cg15160573 | chr1 | 28582130 | 28582131 | CGI:chr1:28581557-28582287 |
| cg15601452 | chr1 | 28579870 | 28579871 | CGI:chr1:28581557-28582287 |
| cg16724557 | chr1 | 28581391 | 28581392 | CGI:chr1:28581557-28582287 |
| cg17459893 | chr1 | 28582020 | 28582021 | CGI:chr1:28581557-28582287 |
| cg19265143 | chr1 | 28581125 | 28581126 | CGI:chr1:28581557-28582287 |
| cg19712659 | chr1 | 28579844 | 28579845 | CGI:chr1:28581557-28582287 |
| cg20497554 | chr1 | 28581859 | 28581860 | CGI:chr1:28581557-28582287 |
| cg22033189 | chr1 | 28582039 | 28582040 | CGI:chr1:28581557-28582287 |
| cg26328951 | chr1 | 28580002 | 28580003 | CGI:chr1:28581557-28582287 |
| SNHG17 | ||||
| cg00615913 | chr20 | 38434453 | 38434454 | CGI:chr20:38434882-38435463 |
| cg01153946 | chr20 | 38433978 | 38433979 | CGI:chr20:38434882-38435463 |
| cg03079640 | chr20 | 38435631 | 38435632 | CGI:chr20:38434882-38435463 |
| cg03260166 | chr20 | 38431074 | 38431075 | CGI:chr20:38434882-38435463 |
| cg04560741 | chr20 | 38427432 | 38427433 | CGI:chr20:38434882-38435463 |
| cg04981166 | chr20 | 38428775 | 38428776 | CGI:chr20:38434882-38435463 |
| cg06473773 | chr20 | 38435086 | 38435087 | CGI:chr20:38434882-38435463 |
| cg07234199 | chr20 | 38431182 | 38431183 | CGI:chr20:38434882-38435463 |
| cg08271622 | chr20 | 38425321 | 38425322 | CGI:chr20:38434882-38435463 |
| cg09744151 | chr20 | 38429772 | 38429773 | CGI:chr20:38434882-38435463 |
| cg11363483 | chr20 | 38429853 | 38429854 | CGI:chr20:38434882-38435463 |
| cg11609780 | chr20 | 38431293 | 38431294 | CGI:chr20:38434882-38435463 |
| cg13610455 | chr20 | 38426257 | 38426258 | CGI:chr20:38434882-38435463 |
| cg15199754 | chr20 | 38435363 | 38435364 | CGI:chr20:38434882-38435463 |
| cg16754665 | chr20 | 38435462 | 38435463 | CGI:chr20:38434882-38435463 |
| cg17308044 | chr20 | 38435758 | 38435759 | CGI:chr20:38434882-38435463 |
| cg19077271 | chr20 | 38435352 | 38435353 | CGI:chr20:38434882-38435463 |
| cg19197795 | chr20 | 38435356 | 38435357 | CGI:chr20:38434882-38435463 |
| cg19537490 | chr20 | 38428539 | 38428540 | CGI:chr20:38434882-38435463 |
| cg23747525 | chr20 | 38435446 | 38435447 | CGI:chr20:38434882-38435463 |
| cg24310959 | chr20 | 38426237 | 38426238 | CGI:chr20:38434882-38435463 |
| cg24629392 | chr20 | 38428723 | 38428724 | CGI:chr20:38434882-38435463 |
| cg24832710 | chr20 | 38435451 | 38435452 | CGI:chr20:38434882-38435463 |
| cg27628552 | chr20 | 38435861 | 38435862 | CGI:chr20:38434882-38435463 |
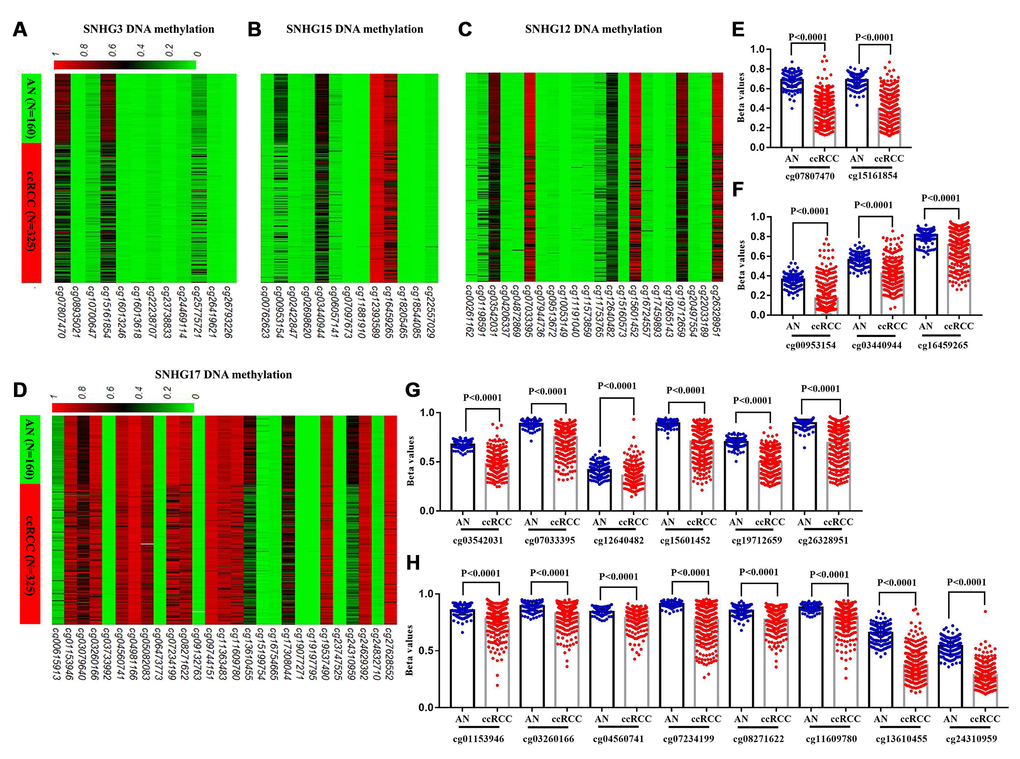
Figure 5. Comparison of SNHG3, SNHG15, SNHG12 and SNHG17 DNA methylation in ccRCC and adjacent normal tissues. (A–D) Heatmaps and (E–H) statistical comparison of the difference in methylation in CpG sites of SNHG3, SNHG15, SNHG12 and SNHG17 DNA, between 325 ccRCC and 160 adjacent normal tissues.
To further explore the potential regulatory effect of DNA methylation on SNHG3, SNHG15, SNHG12 and SNHG17 expression, we analyzed the correlation between the 4 lncRNAs expression and the methylation status of their CpG sites. Correlation analysis results showed that the expressions of SNHG3, SNHG15, SNHG12 and SNHG17 were negatively associated with the methylation levels of 2 sites (cg07807470 r=-0.1963, cg15161854 r=-0.2752), 3 sites (cg00953154 r=-0.4113, cg03440944 r=-0.3342, cg16459265 r=-0.4082), 6 sites (cg03542031 r=-0.5038, cg07033395 r=-0.394, cg12640482 r=-0.3214, cg15601452 r=-0.3814, cg19712659 r=-0.5023, cg26328951 r=-0.4231) and 3 sites (cg04560741 r=-0.1919, cg13610455 r=-0.2631, cg24310959 r=-0.2744), respectively (Figure 6A–6D). Moreover, results of the log-rank test showed that low methylation levels of cg07807470 (SNHG3), cg15161854 (SNHG3), cg00953154 (SNHG15), cg16459265 (SNHG15) and cg07033395 (SNHG12) were significantly associated with the shorter OS of ccRCC patients (Figure 6E–6G). Furthermore, low methylation levels of cg07807470 (SNHG3), cg15161854 (SNHG3) and cg16459265 (SNHG15) were also related to the shorter RFS (Figure 6H, 6I). Taken together, these results indicated that the expressions of SNHG3 and SNHG15 were more likely to be modulated by DNA methylation in ccRCC.
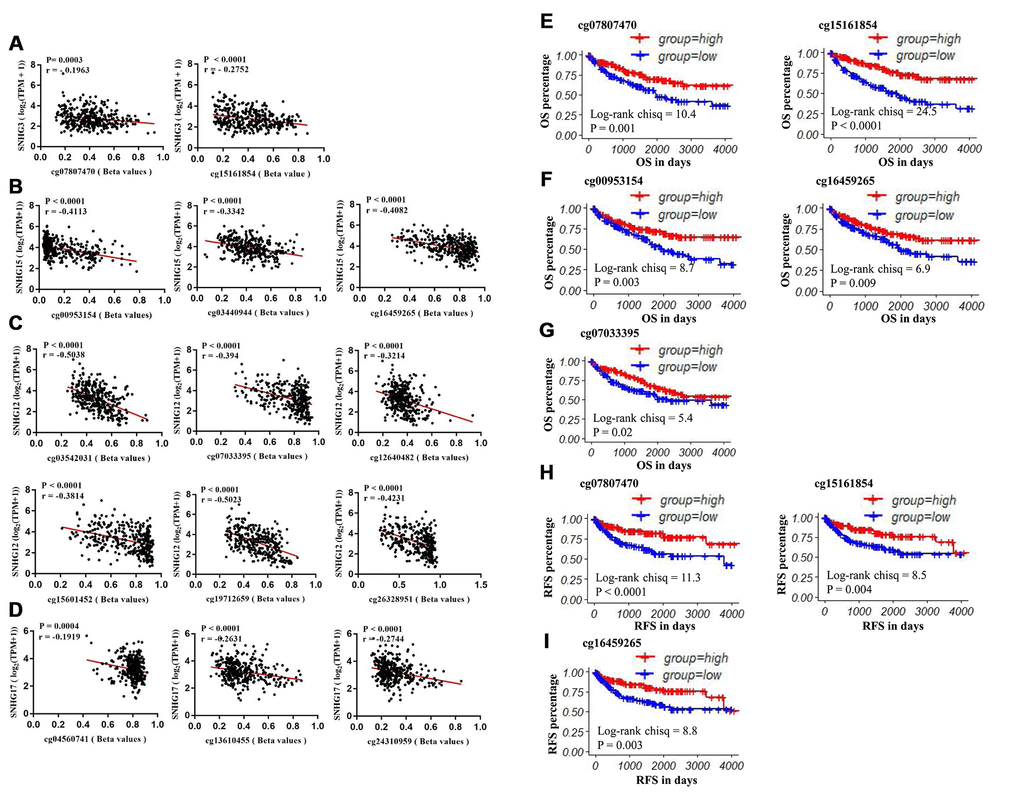
Figure 6. The prognostic value of CpG sites that are negatively correlated with SNHG3, SNHG15, SNHG12 and SNHG17 expression. (A) The correlation between SNHG3 expression and the methylation status of cg07807470 and cg15161854. (B) The correlation between SNHG15 expression and the methylation status of cg00953154, cg03440944 and cg16459265. (C) The correlation between SNHG12 expression and the methylation status of cg03542031, cg07033395, cg12640482, cg15601452, cg19712659 and cg26328951. (D) The correlation between SNHG12 expression and the methylation status of cg04560741, cg13610455 and cg24310959. (E–G) Patients were grouped according to the median cutoff of cg07807470, cg15161854, cg00953154, cg16459265 and cg0703395 methylation status for OS detection. (H–I) Patients were grouped according to the median cutoff of cg07807470, cg15161854 and cg16459265 methylation status for RFS detection.
The validation of the expression patterns and the DNA methylation status of SNHG3 and SNHG15 based on clinical samples
62 paired clinical samples were utilized to validate the expression patterns of SNHG3 and SNHG15, and 15 paired clinical samples were used to examine the DNA methylation status of 4 CpG sites (cg07807470, cg15161854, cg00953154, cg16459265) (Figure 1), and the clinical information of these 62 ccRCC patients are also showed in Table 6. q-RT-PCR was performed to confirm the expression of SNHG3 and SNHG15 in these 62 paired clinical samples. Consistent with the results from TCGA datasets, the expression levels of SNHG3 and SNHG15 were remarkably higher in ccRCC tissues than that of adjacent normal renal tissues (Figure 7A). Results of the log-rank test showed that high expression of SNHG3 and SNHG15 was associated with the shorter OS, and high expression of SNHG15 was also related to the shorter RFS. Moreover, the expression levels of SNHG3 and SNHG15 were significantly higher in advanced-stage ccRCC than in early-stage ccRCC (Figure 7B).
Table 6. The clinical characteristics of 62 ccRCC patients used for validation.
| Clinicopathologic characteristics | n (%) |
| Age | |
| <60 | 33 (53.2) |
| >=60 | 29 (46.8) |
| Overall Survival | |
| Alive | 42 (67.7) |
| Dead | 20 (32.3) |
| Tumor size | |
| < 2cm | 7 (11.3) |
| >= 2 cm, <5cm | 40 (64.5) |
| >= 5cm | 15 (24.2) |
| Gender | |
| Male | 46 (74.2) |
| Female | 16 (25.8) |
| Tumor stage | |
| T1/T2 | 41 (66.1) |
| T3/T4 | 21 (33.9) |
| Historical Grade | |
| G1/G2 | 39 (62.9) |
| G3/G4 | 23 (37.1) |
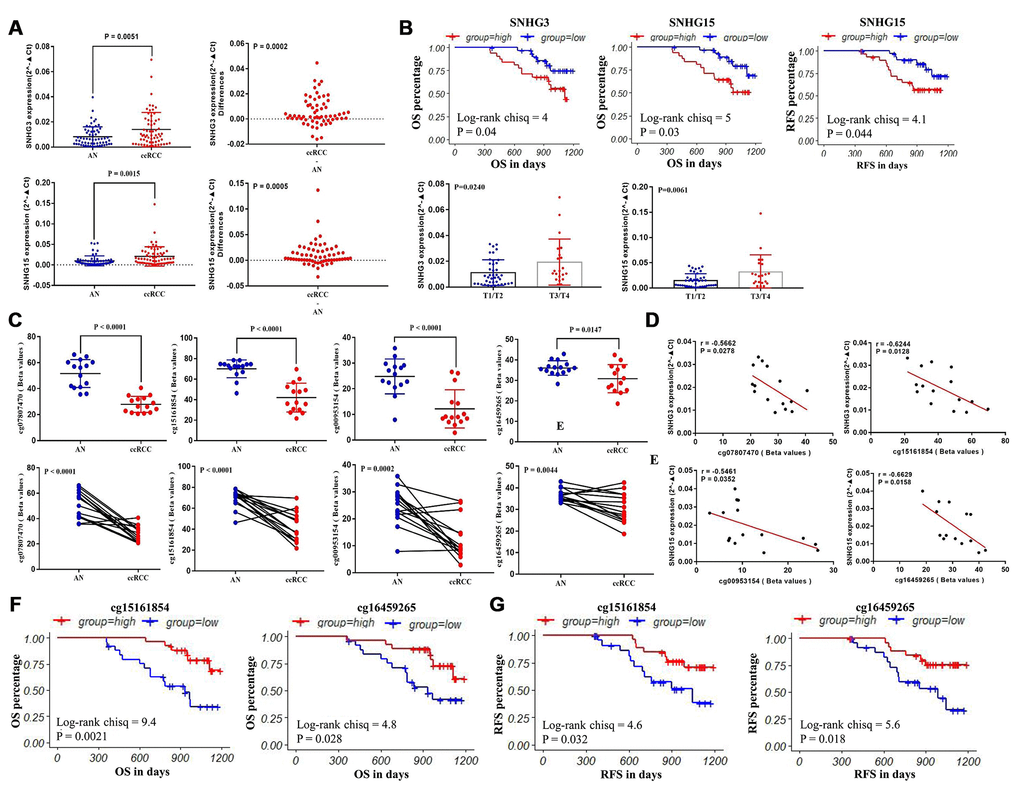
Figure 7. The validation of the expression patterns and the methylation status of SNHG3 and SNHG15. (A) q-RT-PCR analysis of SNHG3 and SNHG15 expression in ccRCC and adjacent normal renal tissues. (B) Patients were grouped according to the median cutoff of SNHG3 and SNHG15 expression for OS detection, patients were grouped according to the median cutoff of SNHG15 expression for RFS detection, and the correlation between SNHG3 and SNHG15 expression and the tumor stage of ccRCC patients. (C) Pyrosequencing analysis of cg07807470, cg15161854, cg00953154 and cg16459265 methylation levels between ccRCC and matched adjacent normal tissues. (D) The methylation levels of cg07807470 and cg15161854 were negatively associated with the expression of SNHG3. (E) The methylation levels of cg00953154 and cg16459265 were negatively associated with the expression of SNHG15. (F) Patients were grouped according to the median cutoff of cg15161854 and cg16459265 methylation status for OS detection. (G) Patients were grouped according to the median cutoff of cg15161854 and cg16459265 methylation status for RFS detection.
In addition, the methylation status of 4 CpG sites (cg07807470, cg15161854, cg00953154 and cg16459265) in 15 paired clinical samples were tested through pyrosequencing. In the whole population, the methylation levels of 4 methylation sites were consistent with the TCGA cohort. The methylation levels of cg07807470, cg15161854, cg00953154 and cg16459265 were significantly lower in ccRCC compared with adjacent normal tissues (Figure 7C). The representative results of pyrosequencing for methylation status in two paired samples were shown in Supplementary Figure 1. Besides, the methylation levels of cg07807470 (r=-0.5662) and cg15161854 (r=-0.6244) were significantly negatively correlated with SNHG3 expression (Figure 7D), while the methylation levels of cg00953154 (r=-0.5461) and cg16459265 (r=-0.6629) were negatively associated with SNHG15 expression (Figure 7E), which were consistent with the results from the TCGA datasets. Furthermore, the methylation levels of cg15161854 with a higher correlation with SNHG3 expression and cg16459265 with a higher correlation with SNHG15 expression in another 36 available ccRCC samples were tested through pyrosequencing for survival analysis. Consistent with the survival analysis results of TCGA samples, our results showed that low methylation levels of cg15161854 and cg16459265 were associated with the shorter OS (Figure 7F) and RFS (Figure 7G) of ccRCC patients.
Discussion
Because nearly 1/3 of ccRCC patients have localized or distant metastasis at the initial diagnosis and almost all ccRCC show radiotherapy and chemotherapy resistance finally, the 5-year survival rates of ccRCC patients remains as low as 20% [6, 24, 25]. Therefore, finding new and effective prognostic biomarkers is critical for patients with ccRCC due to the disappointing clinical outcomes.
The past few years have seen the emergence of certain snoRNAs as potential regulators of cell fate, and insight into the molecular mechanisms by which snoRNAs may carry out these regulatory functions, in addition to the modification of rRNAs, has started to appear in the scientific literature [26]. Interestingly, the modification of ribosomal biogenesis was associated with the development of cancer, suggesting that the classical function of snoRNA may contribute to the development of cancer [27, 28]. In addition to the initial evidence of snoRNA involvement in cancer development, increasing evidence has demonstrated that dysregulated small nucleolar RNA host genes may contribute to multiple cancer progression. For example, SNHG1 was upregulated in human colorectal cancer tissues, and high SNHG1 expression was associated with shorter OS [29]; SNHG1 contributed to sorafenib resistance by activating the Akt pathway in hepatocellular carcinoma cells [30]; SNHG17 was upregulated in non-small-cell lung cancer (NSCLC), and the knockdown of SNHG17 inhibited the proliferation and migration and promoted the apoptosis of NSCLC cells [31]. However, there has been relatively little research on the clinical roles of small nucleolar RNA host genes in ccRCC.
In our study, we compared the expression patterns of 20 small nucleolar RNA host genes in ccRCC and adjacent normal tissues based on TCGA-KIRC data. Results showed that compared with adjacent normal tissues, SNHG1, GAS5, SNHG3-8, SNHG11, SNHG12, SNHG15-17, SNHG20, SNHG22 and SNHG25 were significantly upregulated in ccRCC tissues, while SNHG9, SNHG10, DANCR and SNHG14 were remarkably downregulated in ccRCC tissues. Moreover, after adjustment for confounding factors, increased SNHG3 expression was a potential risk factor of shorter OS, while upregulated SNHG15 expression was an independent predictor of shorter RFS in ccRCC. When concerning the relationship between these lncRNAs and the progression of ccRCC, SNHG3 and SNHG15 were closely related to some clinical parameters of ccRCC, such as tumor stage, histological grade and remote metastasis. In addition, we also performed q-RT-PCR to verify the expression of SNHG3 and SNHG15 with 62 paired clinical samples. Results of the log-rank test showed that high expression of SNHG3 and SNHG15 was associated with the shorter OS, and the expression levels of SNHG3 and SNHG15 were significantly higher in advanced-stage ccRCC than in early-stage ccRCC. Although survival data from both the validation samples and the TCGA samples showed that the prognosis of ccRCC patients with high expression of SNHG3 and SNHG15 was poor, the median survival time of validation patients was much shorter than that of TCGA patients (about 1000 days vs. 1800-2000 days). Clinically, approximately 30% of localized ccRCC patients will nevertheless develop recurrence or metastasis after surgical resection of their tumor [32]. At present, several prognostic factors for patients with recurrent RCC after a nephrectomy for localized disease were established. In a previous study, each RCC patient was given a total risk score of 0 to 5, with one point for each of five prognostic variables (recurrence < 12 months after nephrectomy, serum calcium > 10 mg/dL, hemoglobin < lower limit of normal, lactate dehydrogenase > 1.5x upper limit of normal, and Karnofsky performance status < 80%), and patients were categorized into low- (score = 0), intermediate- (score = 1 to 2), and high-risk subgroups (score = 3 to 5) [33]. The result showed that the median survival time for low-risk, intermediate-risk, and high-risk patients was 76, 25, and 6 months, respectively. Therefore, in addition to the above 5 factors, more studies are needed on the impact of other factors, such as living environment, underlying diseases and medical conditions, on the median survival time of RCC patients.
Consistent with our results, SNHG3 and SNHG15 have been reported to be significantly upregulated in several types of cancer. SNHG3 was overexpressed in colorectal cancer [34], ovarian cancer [35], osteosarcoma [36] and hepatocellular carcinoma [37], and its upregulation was associated with poor OS. Moreover, a recent study demonstrated that the higher expression of SNHG3 could predict worse clinical prognosis, and knockdown of SNHG3 could significantly inhibit the proliferation and metastasis of ccRCC in vitro and in vivo [38]. Similarly, SNHG15 was also overexpressed in colorectal cancer [22, 39], thyroid carcinoma [40] and osteosarcoma [41]. Besides, SNHG15 could promote cell proliferation, invasion and drug resistance in colorectal cancer, suggesting its potential as prognostic marker and target for RNA-based therapies [42]. Furthermore, SNHG15 was significantly upregulated in RCC tissues and cell lines compared with its adjacent normal tissues and a proximal tubule epithelial cell line, and SNHG15 knockdown could inhibit RCC proliferation, invasion and migration [43]. Taken together, all the results indicated that the highly expressed SNHG3 and SNHG15 played crucial roles in the occurrence and development of ccRCC.
Epigenetic alterations such as DNA methylation, histone modification, and loss of genome imprinting play crucial roles in the formation and progression of cancer [44]. Over the past decade, many researches have indicated the presence of abnormal DNA methylation in various types of tumor [45–47]. In addition, it is well known that abnormal DNA methylation includes global hypomethylation and regional hypermethylation, in which regional hypermethylation is usually associated with gene silencing. For example, hypermethylation of the CpG shore of the Shh gene resulted in Shh loss, and inhibition of DNA methylation increased Shh expression to halt the initiation of bladder cancer at the early stage of progression [48]; DNA methylation at an enhancer of the three prime repair exonuclease 2 gene (TREX2) was linked to decreased TREX2 gene expression and protein expression, which may affect drug-induced DNA damage repair in laryngeal cancer [49]; and Epigenetic Silencing of miRNA-338-5p and miRNA-421 drived SPINK1-Positive Prostate Cancer [50]. Besides, a recent study reported that downregulation of CLDN7 due to promoter hypermethylation contributed to human ccRCC progression and poor prognosis [51], indicating DNA methylation may also play vital roles in ccRCC. However, all of above studies have focused on the effect of DNA methylation on mRNA or miRNA, and the regulation of DNA methylation on lncRNA was rarely reported.
During our study, we examined the correlation between SNHG3, SNHG15, SNHG12 and SNHG17 expression and their DNA methylation status. Results showed that the expression levels of SNHG3 and SNHG15 were more likely to be modulated by methylation in ccRCC. The methylation levels of cg07807470 and cg15161854 were negatively associated with SNHG3 expression, and the methylation levels of cg00953154, cg03440944 and cg16459265 were negatively correlated with SNHG15 expression in ccRCC. Moreover, low methylation levels of cg07807470, cg15161854, cg00953154 and cg16459265 were significantly associated with poor OS of ccRCC patients. Low methylation levels of cg07807470, cg15161854 and cg16459265 were also related to the shorter RFS. In addition, we verified the methylation status of the 4 CpG sites and their correlation with their corresponding SNHGs with 15 paired clinical samples by pyrosequencing and q-RT-PCR. Furthermore, the methylation levels of cg15161854 with a higher correlation with SNHG3 expression and cg16459265 with a higher correlation with SNHG15 expression in another 36 available ccRCC samples were tested through pyrosequencing for survival analysis. Consistent with the survival analysis results of TCGA samples, our results showed that low methylation levels of cg15161854 and cg16459265 were associated with the shorter OS and RFS of ccRCC patients. Taken together, SNHG3 and SNHG15 expression levels might be substantially modulated by DNA methylation in ccRCC.
In summary, we for the first time comprehensively determined the clinical significance of small nucleolar RNA host genes and the effect of DNA methylation on their expression in ccRCC. Although, we identified that SNHG3 and SNHG15 may have great clinical value to act as diagnostic biomarkers and indicators to evaluate the survival and progression of ccRCC, the number of cases can still be improved. Currently, the mechanisms of SNHG3 and SNHG15 in regulating the prognosis of patients with ccRCC are still not fully understood. More experiments are needed to further validate the regulation of DNA methylation on SNHG3 and SNHG15 expression.
Materials and Methods
Ethics statement
All procedures performed in studies involving human participants were in accordance with the ethical standards of the institutional and/or national research committee and with the 1964 Helsinki declaration and its later amendments or comparable ethical standards. This study was approved by the Biomedical Research Ethics Committee of Peking University First Hospital.
TCGA datasets
Level-3 RNA-sequencing data, the clinicopathological and survival data of patients with ccRCC were downloaded from TCGA (https://portal.gdc.cancer.gov/). The data availability of the patients included were summarized in Figure 1. Briefly, 539 ccRCC and 72 adjacent normal renal tissues were included in this study. Their clinical and survival data, including tumor stage, lymph node, metastasis, pathological stage, neoplasm histologic grade, OS and RFS, were downloaded. In addition, DNA methylation data (measured by the Infinium Human- Methylation450 BeadChip) that contains the data of 325 ccRCC and 160 adjacent normal renal tissues were also downloaded.
Clinical samples for validation
A total of 62 paired tissues samples (adjacent normal renal tissue and ccRCC) were collected from ccRCC patients who underwent radical or partial nephrectomy at Peking University First Hospital. All the samples were immediately snap frozen in liquid nitrogen for long-term preservation until RNA or DNA extraction. This study was approved by the Biomedical Research Ethics Committee of Peking University First Hospital (Beijing, China, IRB00001052-18004). Written informed consent was also obtained from all patients.
Total RNA extraction and quantitative real-time PCR
Total RNA was extracted from the 124 tissue samples using the TRIzol reagent (Invitrogen; Thermo Fisher Scientific Inc.), according to the manufacturer’s instructions. cDNA was generated using reverse transcription (TansGEN, Beijing, China). q-RT-PCR was performed using the ABI PRISM 7000 Fluorescent Quantitative PCR System (Applied Biosystems, Foster City, CA, USA), according to the manufacturer’s instructions, and normalized to GAPDH. All experiments were repeated at least three times. The detailed primer sequences included in this study are shown in Supplementary Table 1.
Pyrosequencing
Genomic DNA was extracted from 15 paired clinical samples using the QIAamp DNA FFPE Tissue kit (QIAGEN, Hilden, Germany). The concentration and purity of these DNA samples were determined with a spectrophotometer (NANO-DROP 2000, Thermo Scientific, Waltham, MA, USA). Bisulfite conversion of total 500 ng purified DNA in each sample was performed with QIAGEN 59124-EpiTect Plus DNA Bisufite Kit according to manufacturer’s instructions. The bisulfite conversed DNA was amplified with Kapa Biosystems Hs Polymerase With Dntps250u KK5516 (KAPA, USA) with reaction setup: 34.8ul PCR-grade water, 10ul 5x KAPA buffer, 1ul dNTP (10Mm/each), 1ul forward prime (50pM/ul), 1ul reverse primers (50pM/ul), 2ul bisulfite-treated DNA (25ng) and 0.2ul Taq (5U/ul) in total 50 μL each reaction and with following thermal cycle condition: initial denaturation at 95 °C for 3 mins, denaturation at 94 °C for 30 s, annealing at 50 °C for 30 s, extension at 72 °C for 1 min executed for 40 cycles followed by extension at 72 °C for 7 min and hold at 4 °C. The amplicons were then subjected to pyrosequencing with PyroMark Q96 ID (Qiagen, Hilden, Germany). All primers used are presented in Supplementary Table 1.
Statistical analysis
Welch’s unequal variances t-test was used to detect differences in continuous variables. The Pearson’s correlation test was conducted to assess the correlations between lncRNAs and hypoxia. The extent of correlations between the expression of SNHG3, SNHG12 and SNHG17 and their CpG sites’ DNA methylation levels were also evaluated. The receiver operating characteristic (ROC) curve was used to assess the diagnostic effectiveness of these aberrantly expressed lncRNAs in ccRCC. The prognostic roles of lncRNAs were examined with the Kaplan–Meier method, and the log-rank test was conducted to determine the significance of the difference between the survival curves. The univariate and multivariate cox analyses of these lncRNAs were also performed. A P-value < 0.05 represented statistical significance. The statistical analyses were all carried out by R language and GraphPad Prism 7.00.
Author Contributions
W.Y and K.Z: design, analysis and interpretation of data, drafting of the manuscript, critical revision of the manuscript; L.L: statistical analysis; K.M and B.H: acquisition of data; W.Y, Y.G and K.G: critical revision of the manuscript for important intellectual content, administrative support, obtaining funding, supervision, wrote and edited the manuscript. All authors read and approved the final manuscript.
Acknowledgments
We would like to express our sincere gratitude to TCGA program, which provides the high quality genomic data.
Conflicts of Interest
All the authors declare that there are no conflicts of interest concerning this article.
Funding
This work was supported by the National Natural Science Foundation of China (grant 81872081), and the Fundamental Research Funds for the Central Universities (grant BMU2018JI002).
References
- 1. Ramana J. RCDB: Renal Cancer Gene Database. BMC Res Notes. 2012; 5:246. https://doi.org/10.1186/1756-0500-5-246 [PubMed]
- 2. Hsieh JJ, Purdue MP, Signoretti S, Swanton C, Albiges L, Schmidinger M, Heng DY, Larkin J, Ficarra V. Renal cell carcinoma. Nat Rev Dis Primers. 2017; 3:17009. https://doi.org/10.1038/nrdp.2017.9 [PubMed]
- 3. Choueiri TK, Motzer RJ. Systemic Therapy for Metastatic Renal-Cell Carcinoma. N Engl J Med. 2017; 376:354–66. https://doi.org/10.1056/NEJMra1601333 [PubMed]
- 4. Sato Y, Yoshizato T, Shiraishi Y, Maekawa S, Okuno Y, Kamura T, Shimamura T, Sato-Otsubo A, Nagae G, Suzuki H, Nagata Y, Yoshida K, Kon A, et al. Integrated molecular analysis of clear-cell renal cell carcinoma. Nat Genet. 2013; 45:860–67. https://doi.org/10.1038/ng.2699 [PubMed]
- 5. Linehan WM, Ricketts CJ. The metabolic basis of kidney cancer. Semin Cancer Biol. 2013; 23:46–55. https://doi.org/10.1016/j.semcancer.2012.06.002 [PubMed]
- 6. Hsieh JJ, Le VH, Oyama T, Ricketts CJ, Ho TH, Cheng EH. Chromosome 3p Loss-Orchestrated VHL, HIF, and Epigenetic Deregulation in Clear Cell Renal Cell Carcinoma. J Clin Oncol. 2018; 36:JCO2018792549. https://doi.org/10.1200/JCO.2018.79.2549 [PubMed]
- 7. Ponting CP, Oliver PL, Reik W. Evolution and functions of long noncoding RNAs. Cell. 2009; 136:629–41. https://doi.org/10.1016/j.cell.2009.02.006 [PubMed]
- 8. Huarte M. The emerging role of lncRNAs in cancer. Nat Med. 2015; 21:1253–61. https://doi.org/10.1038/nm.3981 [PubMed]
- 9. Lin C, Yang L. Long Noncoding RNA in Cancer: Wiring Signaling Circuitry. Trends Cell Biol. 2018; 28:287–301. https://doi.org/10.1016/j.tcb.2017.11.008 [PubMed]
- 10. Mercer TR, Dinger ME, Mattick JS. Long non-coding RNAs: insights into functions. Nat Rev Genet. 2009; 10:155–59. https://doi.org/10.1038/nrg2521 [PubMed]
- 11. Li JK, Chen C, Liu JY, Shi JZ, Liu SP, Liu B, Wu DS, Fang ZY, Bao Y, Jiang MM, Yuan JH, Qu L, Wang LH. Long noncoding RNA MRCCAT1 promotes metastasis of clear cell renal cell carcinoma via inhibiting NPR3 and activating p38-MAPK signaling. Mol Cancer. 2017; 16:111. https://doi.org/10.1186/s12943-017-0681-0 [PubMed]
- 12. Zhai W, Zhu R, Ma J, Gong D, Zhang H, Zhang J, Chen Y, Huang Y, Zheng J, Xue W. A positive feed-forward loop between LncRNA-URRCC and EGFL7/P-AKT/FOXO3 signaling promotes proliferation and metastasis of clear cell renal cell carcinoma. Mol Cancer. 2019; 18:81. https://doi.org/10.1186/s12943-019-0998-y [PubMed]
- 13. Tollervey D, Kiss T. Function and synthesis of small nucleolar RNAs. Curr Opin Cell Biol. 1997; 9:337–42. https://doi.org/10.1016/S0955-0674(97)80005-1 [PubMed]
- 14. Bouchard-Bourelle P, Desjardins-Henri C, Mathurin-St-Pierre D, Deschamps-Francoeur G, Fafard-Couture E, Garant JM, Elela SA, Scott MS. snoDB: an interactive database of human snoRNA sequences, abundance and interactions. Nucleic Acids Res. 2020; 48:D220–D225. https://doi.org/10.1093/nar/gkz884 [PubMed]
- 15. Kiss-László Z, Henry Y, Bachellerie JP, Caizergues-Ferrer M, Kiss T. Site-specific ribose methylation of preribosomal RNA: a novel function for small nucleolar RNAs. Cell. 1996; 85:1077–88. https://doi.org/10.1016/S0092-8674(00)81308-2 [PubMed]
- 16. Liao J, Yu L, Mei Y, Guarnera M, Shen J, Li R, Liu Z, Jiang F. Small nucleolar RNA signatures as biomarkers for non-small-cell lung cancer. Mol Cancer. 2010; 9:198. https://doi.org/10.1186/1476-4598-9-198 [PubMed]
- 17. Martens-Uzunova ES, Jalava SE, Dits NF, van Leenders GJ, Møller S, Trapman J, Bangma CH, Litman T, Visakorpi T, Jenster G. Diagnostic and prognostic signatures from the small non-coding RNA transcriptome in prostate cancer. Oncogene. 2012; 31:978–91. https://doi.org/10.1038/onc.2011.304 [PubMed]
- 18. Gee HE, Buffa FM, Camps C, Ramachandran A, Leek R, Taylor M, Patil M, Sheldon H, Betts G, Homer J, West C, Ragoussis J, Harris AL. The small-nucleolar RNAs commonly used for microRNA normalisation correlate with tumour pathology and prognosis. Br J Cancer. 2011; 104:1168–77. https://doi.org/10.1038/sj.bjc.6606076 [PubMed]
- 19. Yoshida K, Toden S, Weng W, Shigeyasu K, Miyoshi J, Turner J, Nagasaka T, Ma Y, Takayama T, Fujiwara T, Goel A. SNORA21 - An Oncogenic Small Nucleolar RNA, with a Prognostic Biomarker Potential in Human Colorectal Cancer. EBioMedicine. 2017; 22:68–77. https://doi.org/10.1016/j.ebiom.2017.07.009 [PubMed]
- 20. Okugawa Y, Toiyama Y, Toden S, Mitoma H, Nagasaka T, Tanaka K, Inoue Y, Kusunoki M, Boland CR, Goel A. Clinical significance of SNORA42 as an oncogene and a prognostic biomarker in colorectal cancer. Gut. 2017; 66:107–17. https://doi.org/10.1136/gutjnl-2015-309359 [PubMed]
- 21. Ni W, Yao S, Zhou Y, Liu Y, Huang P, Zhou A, Liu J, Che L, Li J. Long noncoding RNA GAS5 inhibits progression of colorectal cancer by interacting with and triggering YAP phosphorylation and degradation and is negatively regulated by the m6A reader YTHDF3. Mol Cancer. 2019; 18:143. https://doi.org/10.1186/s12943-019-1079-y [PubMed]
- 22. Jiang H, Li T, Qu Y, Wang X, Li B, Song J, Sun X, Tang Y, Wan J, Yu Y, Zhan J, Zhang H. Long non-coding RNA SNHG15 interacts with and stabilizes transcription factor Slug and promotes colon cancer progression. Cancer Lett. 2018; 425:78–87. https://doi.org/10.1016/j.canlet.2018.03.038 [PubMed]
- 23. Chen Z, Chen X, Chen P, Yu S, Nie F, Lu B, Zhang T, Zhou Y, Chen Q, Wei C, Wang W, Wang Z. Long non-coding RNA SNHG20 promotes non-small cell lung cancer cell proliferation and migration by epigenetically silencing of P21 expression. Cell Death Dis. 2017; 8:e3092. https://doi.org/10.1038/cddis.2017.484 [PubMed]
- 24. Najjar YG, Rini BI. Novel agents in renal carcinoma: a reality check. Ther Adv Med Oncol. 2012; 4:183–94. https://doi.org/10.1177/1758834012443725 [PubMed]
- 25. Wang G, Zhang ZJ, Jian WG, Liu PH, Xue W, Wang TD, Meng YY, Yuan C, Li HM, Yu YP, Liu ZX, Wu Q, Zhang DM, Zhang C. Novel long noncoding RNA OTUD6B-AS1 indicates poor prognosis and inhibits clear cell renal cell carcinoma proliferation via the Wnt/β-catenin signaling pathway. Mol Cancer. 2019; 18:15. https://doi.org/10.1186/s12943-019-0942-1 [PubMed]
- 26. Williams GT, Farzaneh F. Are snoRNAs and snoRNA host genes new players in cancer? Nat Rev Cancer. 2012; 12:84–88. https://doi.org/10.1038/nrc3195 [PubMed]
- 27. Pelletier J, Thomas G, Volarević S. Ribosome biogenesis in cancer: new players and therapeutic avenues. Nat Rev Cancer. 2018; 18:51–63. https://doi.org/10.1038/nrc.2017.104 [PubMed]
- 28. Shiue CN, Berkson RG, Wright AP. c-Myc induces changes in higher order rDNA structure on stimulation of quiescent cells. Oncogene. 2009; 28:1833–42. https://doi.org/10.1038/onc.2009.21 [PubMed]
- 29. Xu M, Chen X, Lin K, Zeng K, Liu X, Pan B, Xu X, Xu T, Hu X, Sun L, He B, Pan Y, Sun H, Wang S. The long noncoding RNA SNHG1 regulates colorectal cancer cell growth through interactions with EZH2 and miR-154-5p. Mol Cancer. 2018; 17:141. https://doi.org/10.1186/s12943-018-0894-x [PubMed]
- 30. Li W, Dong X, He C, Tan G, Li Z, Zhai B, Feng J, Jiang X, Liu C, Jiang H, Sun X. LncRNA SNHG1 contributes to sorafenib resistance by activating the Akt pathway and is positively regulated by miR-21 in hepatocellular carcinoma cells. J Exp Clin Cancer Res. 2019; 38:183. https://doi.org/10.1186/s13046-019-1177-0 [PubMed]
- 31. Xu T, Yan S, Jiang L, Yu S, Lei T, Yang D, Lu B, Wei C, Zhang E, Wang Z. Gene Amplification-Driven Long Noncoding RNA SNHG17 Regulates Cell Proliferation and Migration in Human Non-Small-Cell Lung Cancer. Mol Ther Nucleic Acids. 2019; 17:405–13. https://doi.org/10.1016/j.omtn.2019.06.008 [PubMed]
- 32. Li QK, Pavlovich CP, Zhang H, Kinsinger CR, Chan DW. Challenges and opportunities in the proteomic characterization of clear cell renal cell carcinoma (ccRCC): A critical step towards the personalized care of renal cancers. Semin Cancer Biol. 2019; 55:8–15. https://doi.org/10.1016/j.semcancer.2018.06.004 [PubMed]
- 33. Eggener SE, Yossepowitch O, Pettus JA, Snyder ME, Motzer RJ, Russo P. Renal cell carcinoma recurrence after nephrectomy for localized disease: predicting survival from time of recurrence. J Clin Oncol. 2006; 24:3101–06. https://doi.org/10.1200/JCO.2005.04.8280 [PubMed]
- 34. Huang W, Tian Y, Dong S, Cha Y, Li J, Guo X, Yuan X. The long non-coding RNA SNHG3 functions as a competing endogenous RNA to promote malignant development of colorectal cancer. Oncol Rep. 2017; 38:1402–10. https://doi.org/10.3892/or.2017.5837 [PubMed]
- 35. Hong L, Chen W, Wu D, Wang Y. Upregulation of SNHG3 expression associated with poor prognosis and enhances malignant progression of ovarian cancer. Cancer Biomark. 2018; 22:367–74. https://doi.org/10.3233/CBM-170710 [PubMed]
- 36. Zheng S, Jiang F, Ge D, Tang J, Chen H, Yang J, Yao Y, Yan J, Qiu J, Yin Z, Ni Y, Zhao L, Chen X, et al. LncRNA SNHG3/miRNA-151a-3p/RAB22A axis regulates invasion and migration of osteosarcoma. Biomed Pharmacother. 2019; 112:108695. https://doi.org/10.1016/j.biopha.2019.108695 [PubMed]
- 37. Zhang T, Cao C, Wu D, Liu L. SNHG3 correlates with malignant status and poor prognosis in hepatocellular carcinoma. Tumour Biol. 2016; 37:2379–85. https://doi.org/10.1007/s13277-015-4052-4 [PubMed]
- 38. Zhang C, Qu Y, Xiao H, Xiao W, Liu J, Gao Y, Li M, Liu J. LncRNA SNHG3 promotes clear cell renal cell carcinoma proliferation and migration by upregulating TOP2A. Exp Cell Res. 2019; 384:111595. https://doi.org/10.1016/j.yexcr.2019.111595 [PubMed]
- 39. Huang L, Lin H, Kang L, Huang P, Huang J, Cai J, Xian Z, Zhu P, Huang M, Wang L, Xian CJ, Wang J, Dong J. Aberrant expression of long noncoding RNA SNHG15 correlates with liver metastasis and poor survival in colorectal cancer. J Cell Physiol. 2019; 234:7032–39. https://doi.org/10.1002/jcp.27456 [PubMed]
- 40. Wu DM, Wang S, Wen X, Han XR, Wang YJ, Shen M, Fan SH, Zhang ZF, Shan Q, Li MQ, Hu B, Lu J, Chen GQ, Zheng YL. LncRNA SNHG15 acts as a ceRNA to regulate YAP1-Hippo signaling pathway by sponging miR-200a-3p in papillary thyroid carcinoma. Cell Death Dis. 2018; 9:947. https://doi.org/10.1038/s41419-018-0975-1 [PubMed]
- 41. Liu K, Hou Y, Liu Y, Zheng J. LncRNA SNHG15 contributes to proliferation, invasion and autophagy in osteosarcoma cells by sponging miR-141. J Biomed Sci. 2017; 24:46. https://doi.org/10.1186/s12929-017-0353-9 [PubMed]
- 42. Saeinasab M, Bahrami AR, González J, Marchese FP, Martinez D, Mowla SJ, Matin MM, Huarte M. SNHG15 is a bifunctional MYC-regulated noncoding locus encoding a lncRNA that promotes cell proliferation, invasion and drug resistance in colorectal cancer by interacting with AIF. J Exp Clin Cancer Res. 2019; 38:172. https://doi.org/10.1186/s13046-019-1169-0 [PubMed]
- 43. Du Y, Kong C, Zhu Y, Yu M, Li Z, Bi J, Li Z, Liu X, Zhang Z, Yu X. Knockdown of SNHG15 suppresses renal cell carcinoma proliferation and EMT by regulating the NF-κB signaling pathway. Int J Oncol. 2018; 53:384–94. https://doi.org/10.3892/ijo.2018.4395 [PubMed]
- 44. Strmiska V, Michalek P, Lackova Z, Guran R, Krizkova S, Vanickova L, Zitka O, Stiborova M, Eckschlager T, Klejdus B, Pacik D, Tvrdikova E, Keil C, et al. Sarcosine is a prostate epigenetic modifier that elicits aberrant methylation patterns through the SAMe-Dnmts axis. Mol Oncol. 2019; 13:1002–17. https://doi.org/10.1002/1878-0261.12439 [PubMed]
- 45. Neumeyer S, Popanda O, Edelmann D, Butterbach K, Toth C, Roth W, Bläker H, Jiang R, Herpel E, Jäkel C, Schmezer P, Jansen L, Alwers E, et al. Genome-wide DNA methylation differences according to oestrogen receptor beta status in colorectal cancer. Epigenetics. 2019; 14:477–93. https://doi.org/10.1080/15592294.2019.1595998 [PubMed]
- 46. Li S, Yuan Y, Xiao H, Dai J, Ye Y, Zhang Q, Zhang Z, Jiang Y, Luo J, Hu J, Chen C, Wang G. Discovery and validation of DNA methylation markers for overall survival prognosis in patients with thymic epithelial tumors. Clin Epigenetics. 2019; 11:38. https://doi.org/10.1186/s13148-019-0619-z [PubMed]
- 47. Johansson A, Palli D, Masala G, Grioni S, Agnoli C, Tumino R, Giurdanella MC, Fasanelli F, Sacerdote C, Panico S, Mattiello A, Polidoro S, Jones ME, et al. Epigenome-wide association study for lifetime estrogen exposure identifies an epigenetic signature associated with breast cancer risk. Clin Epigenetics. 2019; 11:66. https://doi.org/10.1186/s13148-019-0664-7 [PubMed]
- 48. Kim S, Kim Y, Kong J, Kim E, Choi JH, Yuk HD, Lee H, Kim HR, Lee KH, Kang M, Roe JS, Moon KC, Kim S, et al. Epigenetic regulation of mammalian Hedgehog signaling to the stroma determines the molecular subtype of bladder cancer. eLife. 2019; 8:8. https://doi.org/10.7554/eLife.43024 [PubMed]
- 49. Weigel C, Chaisaingmongkol J, Assenov Y, Kuhmann C, Winkler V, Santi I, Bogatyrova O, Kaucher S, Bermejo JL, Leung SY, Chan TL, Lasitschka F, Bohrer MH, et al. DNA methylation at an enhancer of the three prime repair exonuclease 2 gene (TREX2) is linked to gene expression and survival in laryngeal cancer. Clin Epigenetics. 2019; 11:67. https://doi.org/10.1186/s13148-019-0666-5 [PubMed]
- 50. Bhatia V, Yadav A, Tiwari R, Nigam S, Goel S, Carskadon S, Gupta N, Goel A, Palanisamy N, Ateeq B. Epigenetic Silencing of miRNA-338-5p and miRNA-421 Drives SPINK1-Positive Prostate Cancer. Clin Cancer Res. 2019; 25:2755–68. https://doi.org/10.1158/1078-0432.CCR-18-3230 [PubMed]
- 51. Li Y, Gong Y, Ning X, Peng D, Liu L, He S, Gong K, Zhang C, Li X, Zhou L. Downregulation of CLDN7 due to promoter hypermethylation is associated with human clear cell renal cell carcinoma progression and poor prognosis. J Exp Clin Cancer Res. 2018; 37:276. https://doi.org/10.1186/s13046-018-0924-y [PubMed]