


Introduction
DNA methylation has contributed to the understanding of the complexities of genomic instability and gene regulation without altering the DNA sequence [1]. Aberrations in DNA methylation status are closely associated with tumor progression and prognosis of patients especially in blood cancers including acute myeloid leukemia (AML) [1, 2]. During malignant transformation, CpG islands in the promoter region of numerous genes become hypermethylated, silencing the expression of suppressor genes, and leading to a loss in the control of cell apoptosis, proliferation, and differentiation [1]. Conversely, hypomethylation of oncogenes enhances the tumorigenic potential of normal cells [1]. The process of DNA methylation controlled by several molecules such as DNA methyltransferases (DNMTs) has been well characterized [3, 4], but the underlying mechanism of demethylation remains to be elucidated. In recent years, Ten-eleven translocation (TET) proteins have been identified and expand the understanding about mechanisms of DNA demethylation [5].
The TET protein family includes TET1, TET2 and TET3, which can modify 5-methylcytosine (5-mC) by oxidation to 5-hydroxymethylcytosine (5-hmC) and further 5-formylcytosine (5-fC) and 5-carboxycytosine (5-caC) [6–8]. TET family members (TETs) were dysregulated in multiple malignances, and loss-of-function mutations or decreased expression of TETs inhibited the DNA demethylation pathway, which prevents the removal of 5mC from genomic DNA [5]. Functional studies have revealed the direct role of TET2 in blood cancers especially in AML. Cimmino et al reported that restoration of TET2 reversed aberrant hematopoietic stem and progenitor cell self-renewal in vitro and in vivo, and suppressed human leukemic colony formation and leukemia progression of primary human leukemia patient-derived xenografts [9]. Rasmussen et al indicated that loss of TET2 in hematopoietic cells lead to DNA hypermethylation of active enhancers and induction of leukemogenesis [10]. TET2 mutations frequently occur in AML, myelodysplastic syndromes (MDS) and chronic myelomonocytic leukemia (CMML), whereas TET1 and TET3 mutations rarely happen [11, 12]. Moreover, TET2 mutations were important prognostic factors in AML and also predicted response to hypomethylating agents in MDS patients [13]. However, few studies investigated TETs expression and its clinical significance in AML [14, 15]. Herein, we determined the clinical significance of TETs expression in AML among The Cancer Genome Atlas (TCGA) databases.
Results
TETs expression associated with AML among human cancer cell lines
By assembling the Cancer Cell Line Encyclopedia (CCLE), we found that TETs expression especially TET2 and TET3 was highly expressed in AML cell lines among 40 types of human cancer cell lines (Figure 1A–1C). Moreover, The Human Protein Atlas (HPA) also presented that TET2 and TET3 expression was also highly associated with myeloid cell lines (Figure 1D–1F). The detailed comparison of TETs expression in AML cell lines was assessed by using the European Bioinformatics Institute (EMBL-EBI) website (Figure 1G–1I). In addition, TET1/2/3 mutations in human cancer cell lines were given in Supplementary Table 1.
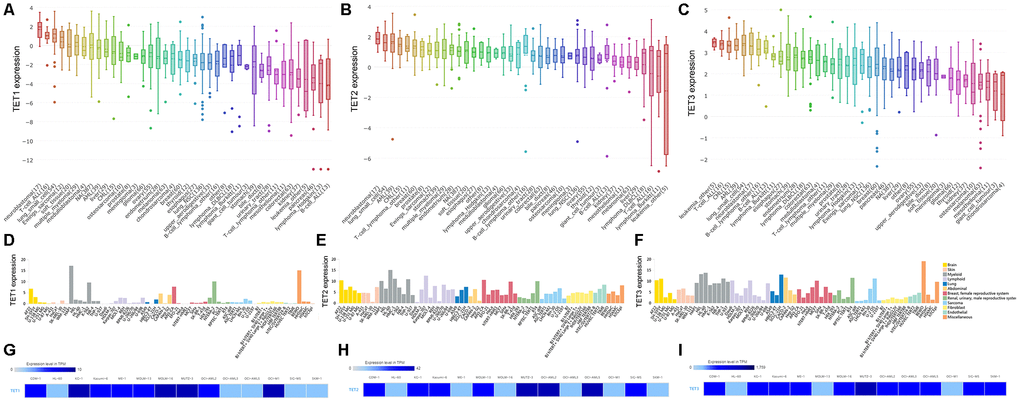
Figure 1. The expression of TETs in human cancer cell lines including AML cell lines. (A–C) The expression of TETs in human cancer cell lines, analyzing by the Cancer Cell Line Encyclopedia (CCLE) dataset (https://www.broadinstitute.org/ccle). (D–F) The expression of TETs in human cancer cell lines, analyzing by The Human Protein Atlas (HPA) dataset (https://www.proteinatlas.org/). (G–I) The expression of TETs in leukemia cell lines, analyzed by the European Bioinformatics Institute (EMBL-EBI) dataset (https://www.ebi.ac.uk).
TETs expression associated with AML patients among human cancers
We further evaluated TETs expression in AML patients by using the Gene Expression Profiling Interactive Analysis (GEPIA) dataset including TCGA and the Genotype-Tissue Expression (GTEx) projects. Aberrant expression of all TETs members was only observed in AML patients among 33 types of human cancers (Figure 2A–2C). TET1 expression was significantly reduced in AML patients, whereas TET2 and TET3 expression was significantly increased in AML patients (Figure 2D–2F). Moreover, TET1 expression did not show a significant correlation with TET2/TET3 expression in AML patients, whereas TET2 expression was positively correlated with TET3 expression in AML patients (Figure 2G–2I). In addition, TET1 and TET3 mutations were identified in none of these AML patients, whereas TET2 mutation was identified in 8.5% (17/200) of these AML patients.
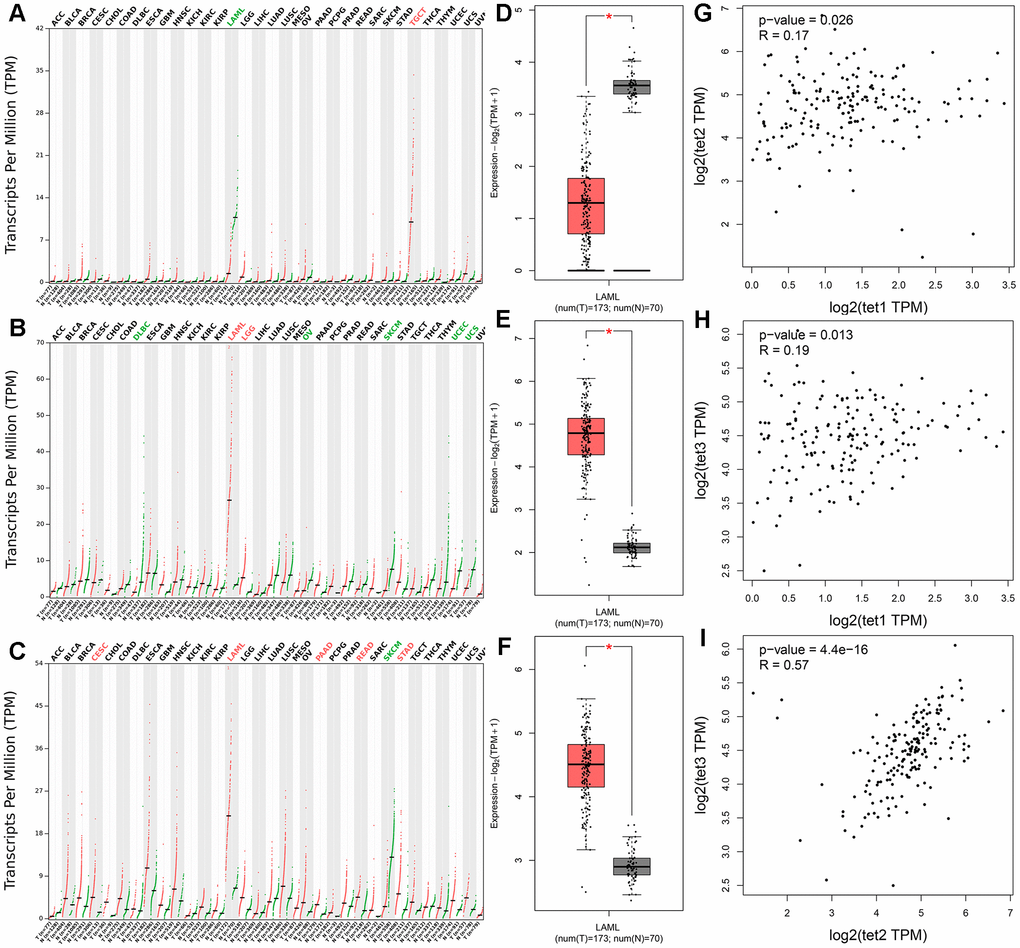
Figure 2. The expression of TETs in human cancers including AML patients. (A–C) The expression of TETs in pan-cancer analyzed by the Gene Expression Profiling Interactive Analysis (GEPIA) dataset (http://gepia.cancer-pku.cn/). Tumor abbreviations: ACC: Adrenocortical carcinoma; BLCA: Bladder Urothelial Carcinoma; BRCA: Breast invasive carcinoma; CESC: Cervical squamous cell carcinoma and endocervical adenocarcinoma; CHOL: Cholangiocarcinoma; COAD: Colon adenocarcinoma; DLBC: Lymphoid Neoplasm Diffuse Large B-cell Lymphoma; ESCA: Esophageal carcinoma; GBM: Glioblastoma multiforme; HNSC: Head and Neck squamous cell carcinoma; KICH: Kidney Chromophobe; KIRC: Kidney renal clear cell carcinoma; KIRP: Kidney renal papillary cell carcinoma; LAML: Acute Myeloid Leukemia; LGG: Brain Lower Grade Glioma; LIHC: Liver hepatocellular carcinoma; LUAD: Lung adenocarcinoma; LUSC: Lung squamous cell carcinoma; MESO: Mesothelioma; OV: Ovarian serous cystadenocarcinoma; PAAD: Pancreatic adenocarcinoma; PCPG: Pheochromocytoma and Paraganglioma; PRAD: Prostate adenocarcinoma; READ: Rectum adenocarcinoma; SARC: Sarcoma; SKCM: Skin Cutaneous Melanoma; STAD: Stomach adenocarcinoma; TGCT: Testicular Germ Cell Tumors; THCA: Thyroid carcinoma; THYM: Thymoma; UCEC: Uterine Corpus Endometrial Carcinoma; UCS: Uterine Carcinosarcoma; UVM: Uveal Melanoma. Tumor abbreviations showed in black indicated no TETs over- or under-expression, in red color indicated TETs overexpression, whereas in green color indicated TETs underexpression. (D–F) The expression of TETs in AML analyzed by the GEPIA dataset (http://gepia.cancer-pku.cn/). (G–I) The correction between TETs in AML analyzed by the GEPIA dataset (http://gepia.cancer-pku.cn/).
Prognostic value of TETs expression in AML
In order to evaluate the prognostic value of TETs expression in AML, we further divided these patients into two groups based on median level of TET1/2/3 transcript respectively (TET1low vs. TET1high; TET2low vs. TET2high; TET3low vs. TET3high). Based on Kaplan-Meier analysis, we did not observe the significant associations of TET1 and TET2 expression with overall survival (OS) and disease-free survival (DFS) among both total AML and non-M3 AML (Figure 3). However, TET3high patients showed markedly longer OS and DFS than TET3low patients among total AML (Figure 3, P=0.018 and 0.019, respectively). Moreover, if French-American-British (FAB)-M3 patients were excluded, patients with high expression of TET3 also had significantly longer OS and DFS than those with low expression of TET3 (Figure 3, P=0.006 and 0.007, respectively). We next determined the prognostic effect of TET3 expression in AML by using Cox regression analysis. Both univariate and multivariate analysis showed that TET3 expression may act as an independent prognostic factor for OS and DFS in total AML (Table 1, P=0.011 and 0.026, respectively) and non-M3 AML (Table 2, P=0.038 and 0.026, respectively).
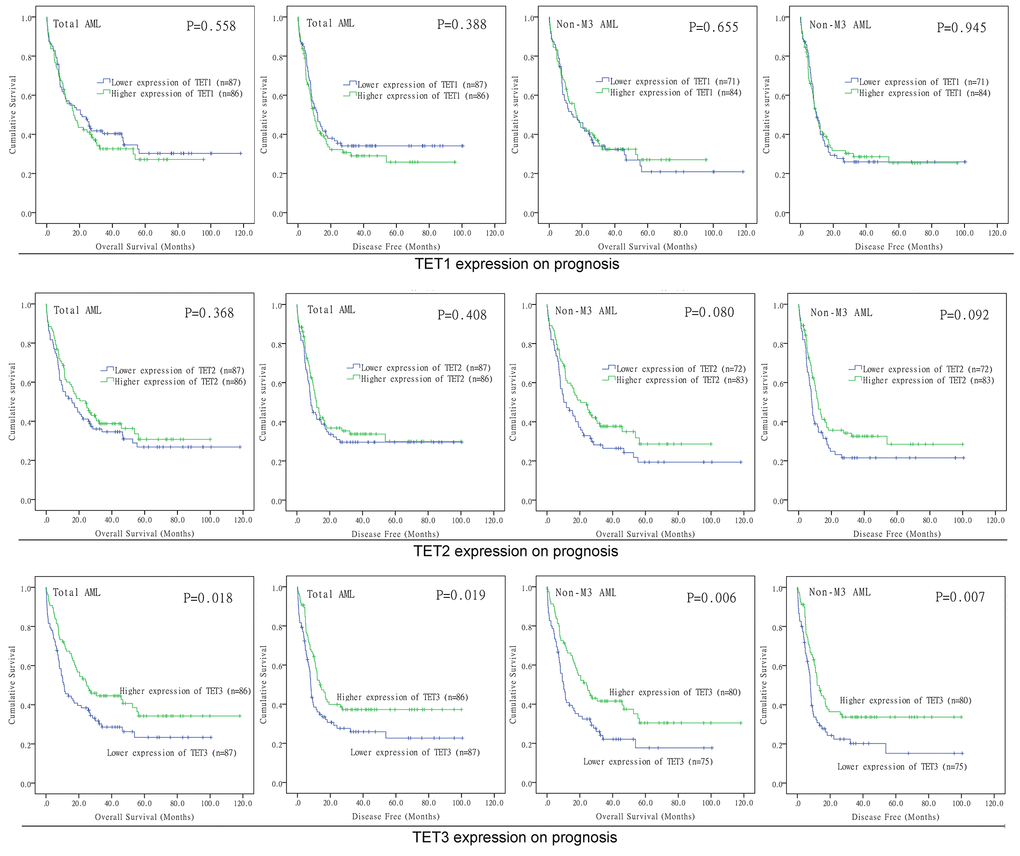
Figure 3. The impact of TETs expression on survival of AML patients. Kaplan–Meier survival curves of TETs expression on overall survival and disease free survival in both chemotherapy and hematopoietic stem cell transplantation groups.
Table 1. Cox regression analyses of variables for OS and DFS in total AML patients.
| Variables | OS | DFS | |||||||||||||||||||||||||||||||||||||||||||||||||||||||||||||||||||||||||||||||||||||||||||||||||
| Univariate analysis | Multivariate analysis | Univariate analysis | Multivariate analysis | ||||||||||||||||||||||||||||||||||||||||||||||||||||||||||||||||||||||||||||||||||||||||||||||||
| HR (95% CI) | P | HR (95% CI) | P | HR (95% CI) | P | HR (95% CI) | P | ||||||||||||||||||||||||||||||||||||||||||||||||||||||||||||||||||||||||||||||||||||||||||||
| TET3 expression | 0.644 (0.445-0.932) | 0.020 | 0.610 (0.416-0.895) | 0.011 | 0.647 (0.447-0.936) | 0.021 | 0.647 (0.441-0.950) | 0.026 | |||||||||||||||||||||||||||||||||||||||||||||||||||||||||||||||||||||||||||||||||||||||||||
| Age | 1.040 (1.027-1.054) | 0.000 | 1.023 (1.007-1.039) | 0.005 | 1.035 (1.022-1.048) | 0.000 | 1.022 (1.007-1.038) | 0.005 | |||||||||||||||||||||||||||||||||||||||||||||||||||||||||||||||||||||||||||||||||||||||||||
| WBC | 1.003 (0.999-1.006) | 0.119 | 1.008 (1.004-1.012) | 0.000 | 1.003 (1.000-1.006) | 0.091 | 1.008 (1.004-1.012) | 0.000 | |||||||||||||||||||||||||||||||||||||||||||||||||||||||||||||||||||||||||||||||||||||||||||
| Karyotype risk | 1.854 (1.465-2.346) | 0.000 | 1.687 (1.236-2.303) | 0.001 | 1.829 (1.448-2.311) | 0.000 | 1.853 (1.398-2.455) | 0.000 | |||||||||||||||||||||||||||||||||||||||||||||||||||||||||||||||||||||||||||||||||||||||||||
| Treatment regimen | 0.551 (0.389-0.780) | 0.001 | 0.398 (0.254-0.623) | 0.000 | 0.615 (0.434-0.871) | 0.006 | 0.476 (0.308-0.734) | 0.001 | |||||||||||||||||||||||||||||||||||||||||||||||||||||||||||||||||||||||||||||||||||||||||||
| FLT3 mutations | 1.269 (0.869-1.852) | 0.217 | 1.254 (0.859-1.829) | 0.241 | |||||||||||||||||||||||||||||||||||||||||||||||||||||||||||||||||||||||||||||||||||||||||||||||
| NPM1 mutations | 1.220 (0.837-1.778) | 0.301 | 1.268 (0.869-1.848) | 0.218 | |||||||||||||||||||||||||||||||||||||||||||||||||||||||||||||||||||||||||||||||||||||||||||||||
| CEBPA mutations | 0.913 (0.464-1.796) | 0.792 | 1.053 (0.535-2.073) | 0.881 | |||||||||||||||||||||||||||||||||||||||||||||||||||||||||||||||||||||||||||||||||||||||||||||||
| DNMT3A mutations | 1.615 (1.104-2.362) | 0.014 | 1.433 (0.919-2.234) | 0.113 | 1.511 (1.035-2.206) | 0.033 | 1.308 (0.839-2.040) | 0.236 | |||||||||||||||||||||||||||||||||||||||||||||||||||||||||||||||||||||||||||||||||||||||||||
| IDH1 mutations | 0.843 (0.466-1.527) | 0.574 | 0.890 (0.492-1.611) | 0.700 | |||||||||||||||||||||||||||||||||||||||||||||||||||||||||||||||||||||||||||||||||||||||||||||||
| IDH2 mutations | 1.113 (0.649-1.910) | 0.697 | 0.987 (0.576-1.691) | 0.963 | |||||||||||||||||||||||||||||||||||||||||||||||||||||||||||||||||||||||||||||||||||||||||||||||
| TET2 mutations | 0.953 (0.514-1.767) | 0.879 | 0.945 (0.510-1.751) | 0.857 | |||||||||||||||||||||||||||||||||||||||||||||||||||||||||||||||||||||||||||||||||||||||||||||||
| RUNX1 mutations | 1.853 (1.077-3.186) | 0.026 | 2.169 (1.157-4.064) | 0.016 | 1.644 (0.959-2.817) | 0.071 | 1.742 (0.937-3.240) | 0.079 | |||||||||||||||||||||||||||||||||||||||||||||||||||||||||||||||||||||||||||||||||||||||||||
| TP53 mutations | 3.687 (2.144-6.339) | 0.000 | 2.311 (1.187-4.497) | 0.014 | 3.257 (1.912-5.549) | 0.000 | 2.174 (1.128-4.189) | 0.020 | |||||||||||||||||||||||||||||||||||||||||||||||||||||||||||||||||||||||||||||||||||||||||||
| OS: overall survival; DFS: disease-free survival; HR: hazard ratio; CI: confidence interval; WBC: white blood cells. Variables in multivariate analysis including TET3 expression (Low vs. High), age, WBC, karyotype (favorable vs. intermediate vs. poor), treatment regimen (with transplantation vs. without transplantation) and gene mutations (mutant vs. wild-type). | |||||||||||||||||||||||||||||||||||||||||||||||||||||||||||||||||||||||||||||||||||||||||||||||||||
Table 2. Cox regression analyses of variables for OS and DFS in non-M3 AML patients.
| Variables | OS | DFS | |||||||||||||||||||||||||||||||||||||||||||||||||||||||||||||||||||||||||||||||||||||||||||||||||
| Univariate analysis | Multivariate analysis | Univariate analysis | Multivariate analysis | ||||||||||||||||||||||||||||||||||||||||||||||||||||||||||||||||||||||||||||||||||||||||||||||||
| HR (95% CI) | P | HR (95% CI) | P | HR (95% CI) | P | HR (95% CI) | P | ||||||||||||||||||||||||||||||||||||||||||||||||||||||||||||||||||||||||||||||||||||||||||||
| TET3 expression | 0.589 (0.403-0.862) | 0.006 | 0.644 (0.425-0.975) | 0.038 | 0.597 (0.408-0.873) | 0.008 | 0.632 (0.422-0.945) | 0.026 | |||||||||||||||||||||||||||||||||||||||||||||||||||||||||||||||||||||||||||||||||||||||||||
| Age | 1.033 (1.019-1.047) | 0.000 | 1.011 (0.994-1.027) | 0.203 | 1.027 (1.014-1.041) | 0.000 | 1.012 (0.996-1.028) | 0.136 | |||||||||||||||||||||||||||||||||||||||||||||||||||||||||||||||||||||||||||||||||||||||||||
| WBC | 1.001 (0.997-1.005) | 0.609 | 1.001 (0.998-1.005) | 0.450 | |||||||||||||||||||||||||||||||||||||||||||||||||||||||||||||||||||||||||||||||||||||||||||||||
| Karyotype risk | 1.698 (1.308-2.205) | 0.000 | 2.188 (1.592-3.008) | 0.000 | 1.674 (1.292-2.169) | 0.000 | 1.822 (1.356-2.448) | 0.000 | |||||||||||||||||||||||||||||||||||||||||||||||||||||||||||||||||||||||||||||||||||||||||||
| Treatment regimen | 0.445 (0.311-0.636) | 0.000 | 0.297 (0.195-0.453) | 0.000 | 0.518 (0.363-0.740) | 0.000 | 0.371 (0.246-0.559) | 0.000 | |||||||||||||||||||||||||||||||||||||||||||||||||||||||||||||||||||||||||||||||||||||||||||
| FLT3 mutations | 1.334 (0.903-1.969) | 0.148 | 1.534 (0.953-2.469) | 0.078 | 1.330 (0.902-1.963) | 0.150 | 1.625 (1.032-2.558) | 0.036 | |||||||||||||||||||||||||||||||||||||||||||||||||||||||||||||||||||||||||||||||||||||||||||
| NPM1 mutations | 1.049 (0.717-1.535) | 0.804 | 1.099 (0.751-1.608) | 0.628 | |||||||||||||||||||||||||||||||||||||||||||||||||||||||||||||||||||||||||||||||||||||||||||||||
| CEBPA mutations | 0.802 (0.407-1.581) | 0.523 | 0.940 (0.477-1.852) | 0.857 | |||||||||||||||||||||||||||||||||||||||||||||||||||||||||||||||||||||||||||||||||||||||||||||||
| DNMT3A mutations | 1.414 (0.964-2.074) | 0.077 | 1.520 (0.970-2.382) | 0.068 | 1.329 (0.907-1.947) | 0.144 | 1.362 (0.868-2.138) | 0.179 | |||||||||||||||||||||||||||||||||||||||||||||||||||||||||||||||||||||||||||||||||||||||||||
| IDH1 mutations | 0.735 (0.405-1.333) | 0.311 | 0.778 (0.429-1.410) | 0.408 | |||||||||||||||||||||||||||||||||||||||||||||||||||||||||||||||||||||||||||||||||||||||||||||||
| IDH2 mutations | 0.972 (0.566-1.671) | 0.918 | 0.857 (0.499-1.471) | 0.575 | |||||||||||||||||||||||||||||||||||||||||||||||||||||||||||||||||||||||||||||||||||||||||||||||
| TET2 mutations | 0.837 (0.451-1.554) | 0.573 | 0.830 (0.447-1.542) | 0.556 | |||||||||||||||||||||||||||||||||||||||||||||||||||||||||||||||||||||||||||||||||||||||||||||||
| RUNX1 mutations | 1.661 (0.965-2.860) | 0.067 | 2.955 (1.580-5.678) | 0.001 | 1.466 (0.854-2.515) | 0.165 | 2.101 (1.139-3.874) | 0.017 | |||||||||||||||||||||||||||||||||||||||||||||||||||||||||||||||||||||||||||||||||||||||||||
| TP53 mutations | 3.214 (1.840-5.614) | 0.000 | 2.578 (1.317-5.045) | 0.006 | 2.818 (1.629-4.875) | 0.000 | 2.239 (1.164-4.308) | 0.016 | |||||||||||||||||||||||||||||||||||||||||||||||||||||||||||||||||||||||||||||||||||||||||||
| OS: overall survival; DFS: disease-free survival; HR: hazard ratio; CI: confidence interval; WBC: white blood cells. Variables in multivariate analysis including TET3 expression (Low vs. High), age, WBC, karyotype (favorable vs. intermediate vs. poor), treatment regimen (with transplantation vs. without transplantation) and gene mutations (mutant vs. wild-type). | |||||||||||||||||||||||||||||||||||||||||||||||||||||||||||||||||||||||||||||||||||||||||||||||||||
In addition, the positive impact of high TET3 expression on OS in cytogenetically normal AML (CN-AML) patients was also validated by Gene Expression Omnibus (GEO) data (GSE12417) via online web tool Genomicscape (Figure 4A–4D).
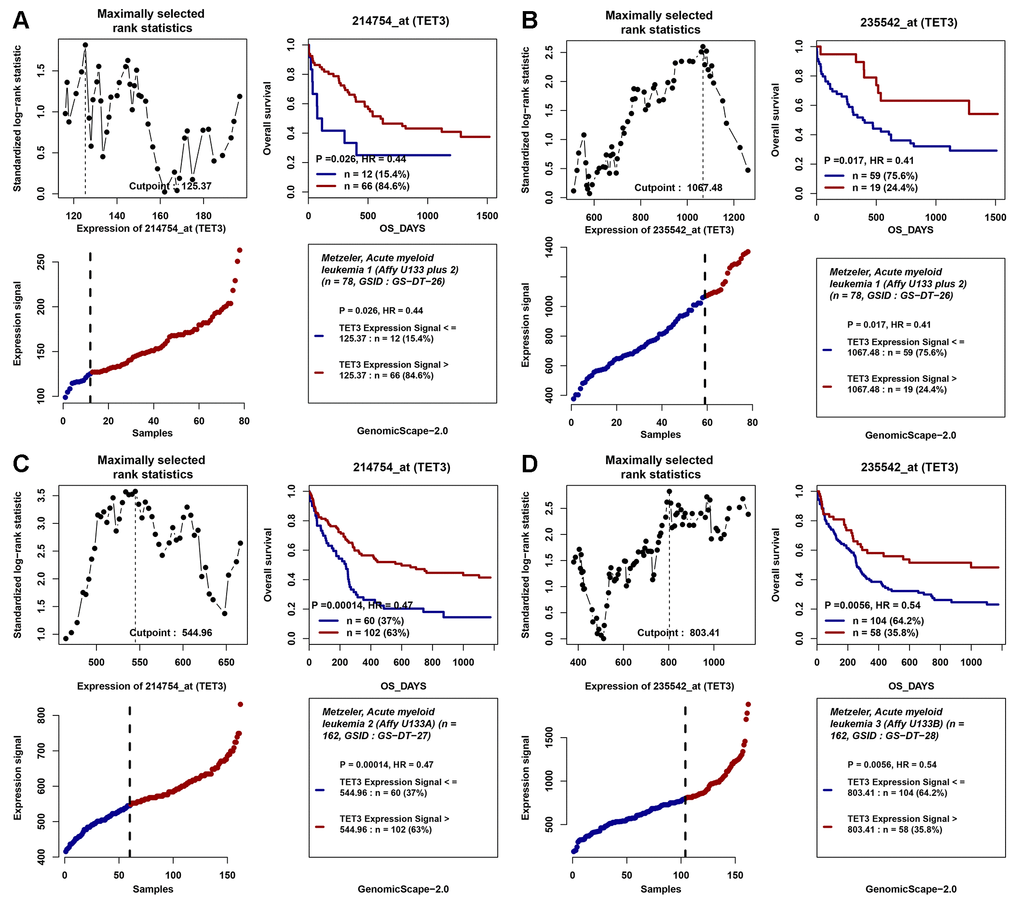
Figure 4. The impact of TET3 expression on overall survival of AML patients. (A–D) Two independent cohorts of 162 and 78 cytogenetically normal AML (CN-AML) patients were obtained from Gene Expression Omnibus (GEO) data (http://www.ncbi.nlm.nih.gov/geo/; accession number GSE12417). Survival analysis was performed through the online web tool Genomicscape (http://genomicscape.com/microarray/survival.php). (A) probe 214754_at (TET3) in 78 CN-AML patients; (B) probe 235542_at (TET3) in 78 CN-AML patients; (C) probe 214754_at (TET3) in 162 CN-AML patients; (D) probe 235542_at (TET3) in 162 CN-AML patients.
Association between TET3 expression and clinical/molecular characteristics
Due to the significant association of TET3 expression with AML prognosis, we next analyzed the clinical relevance of TET3 expression with clinical/molecular characteristics in AML. As presented in Table 3. There were no significant differences between TET3high and TET3low groups in sex, age, white blood cells (WBC), bone marrow (BM)/peripheral blood (PB) blasts, and the distributions of cytogenetics (P>0.05). Significant difference was observed between two groups in the distribution of FAB subtypes (P=0.009). TET3high patients was frequently occurred in FAB-M1/M4 (P=0.083 and 0.022, respectively), and less frequently occurred in FAB-M0 (P=0.016). Among common gene mutations, high expression of TET3 was associated with FLT3 wild-type and NRAS mutation (P=0.018 and 0.018, respectively). No significant differences were found between TET3 expression with other gene mutations (P>0.05). Since TET2 mutation is frequent molecular event in AML, we further analyzed the relationship between TET2 mutation and TET1/2/3 expression in AML patients. As presented in Supplementary Figure 1, no significant differences were found between TET2 mutation (TET2mu) and TET2 wild-type (TET2WT) regarding TET1/2/3 expression (P>0.05).
Table 3. Correlation of TET3 expression with clinic-pathologic characteristics in AML.
| Patient's parameters | TET3 expression | ||||||||||||||||||||||||||||||||||||||||||||||||||||||||||||||||||||||||||||||||||||||||||||||||||
| Low (n=87) | High (n=86) | P | |||||||||||||||||||||||||||||||||||||||||||||||||||||||||||||||||||||||||||||||||||||||||||||||||
| Sex, male/female | 44/43 | 48/38 | 0.543 | ||||||||||||||||||||||||||||||||||||||||||||||||||||||||||||||||||||||||||||||||||||||||||||||||
| Median age, years (range) | 60 (21-88) | 57 (18-82) | 0.113 | ||||||||||||||||||||||||||||||||||||||||||||||||||||||||||||||||||||||||||||||||||||||||||||||||
| Median WBC, ×109/L (range) | 15.1 (0.5-297.4) | 17 (0.4-223.8) | 0.678 | ||||||||||||||||||||||||||||||||||||||||||||||||||||||||||||||||||||||||||||||||||||||||||||||||
| Median PB blasts, % (range) | 45 (0-98) | 29 (0-97) | 0.370 | ||||||||||||||||||||||||||||||||||||||||||||||||||||||||||||||||||||||||||||||||||||||||||||||||
| Median BM blasts, % (range) | 75 (32-100) | 72 (30-100) | 0.294 | ||||||||||||||||||||||||||||||||||||||||||||||||||||||||||||||||||||||||||||||||||||||||||||||||
| FAB classifications | 0.009 | ||||||||||||||||||||||||||||||||||||||||||||||||||||||||||||||||||||||||||||||||||||||||||||||||||
| M0 | 13 | 3 | |||||||||||||||||||||||||||||||||||||||||||||||||||||||||||||||||||||||||||||||||||||||||||||||||
| M1 | 17 | 27 | |||||||||||||||||||||||||||||||||||||||||||||||||||||||||||||||||||||||||||||||||||||||||||||||||
| M2 | 21 | 17 | |||||||||||||||||||||||||||||||||||||||||||||||||||||||||||||||||||||||||||||||||||||||||||||||||
| M3 | 11 | 5 | |||||||||||||||||||||||||||||||||||||||||||||||||||||||||||||||||||||||||||||||||||||||||||||||||
| M4 | 11 | 23 | |||||||||||||||||||||||||||||||||||||||||||||||||||||||||||||||||||||||||||||||||||||||||||||||||
| M5 | 9 | 9 | |||||||||||||||||||||||||||||||||||||||||||||||||||||||||||||||||||||||||||||||||||||||||||||||||
| M6 | 1 | 1 | |||||||||||||||||||||||||||||||||||||||||||||||||||||||||||||||||||||||||||||||||||||||||||||||||
| M7 | 3 | 0 | |||||||||||||||||||||||||||||||||||||||||||||||||||||||||||||||||||||||||||||||||||||||||||||||||
| No data | 1 | 1 | |||||||||||||||||||||||||||||||||||||||||||||||||||||||||||||||||||||||||||||||||||||||||||||||||
| Cytogenetics | 0.637 | ||||||||||||||||||||||||||||||||||||||||||||||||||||||||||||||||||||||||||||||||||||||||||||||||||
| normal | 39 | 41 | |||||||||||||||||||||||||||||||||||||||||||||||||||||||||||||||||||||||||||||||||||||||||||||||||
| t(15;17) | 10 | 5 | |||||||||||||||||||||||||||||||||||||||||||||||||||||||||||||||||||||||||||||||||||||||||||||||||
| t(8;21) | 3 | 4 | |||||||||||||||||||||||||||||||||||||||||||||||||||||||||||||||||||||||||||||||||||||||||||||||||
| inv(16) | 3 | 7 | |||||||||||||||||||||||||||||||||||||||||||||||||||||||||||||||||||||||||||||||||||||||||||||||||
| +8 | 5 | 3 | |||||||||||||||||||||||||||||||||||||||||||||||||||||||||||||||||||||||||||||||||||||||||||||||||
| del(5) | 1 | 0 | |||||||||||||||||||||||||||||||||||||||||||||||||||||||||||||||||||||||||||||||||||||||||||||||||
| -7/del(7) | 3 | 4 | |||||||||||||||||||||||||||||||||||||||||||||||||||||||||||||||||||||||||||||||||||||||||||||||||
| 11q23 | 1 | 2 | |||||||||||||||||||||||||||||||||||||||||||||||||||||||||||||||||||||||||||||||||||||||||||||||||
| others | 7 | 7 | |||||||||||||||||||||||||||||||||||||||||||||||||||||||||||||||||||||||||||||||||||||||||||||||||
| complex | 12 | 13 | |||||||||||||||||||||||||||||||||||||||||||||||||||||||||||||||||||||||||||||||||||||||||||||||||
| No data | 3 | 0 | |||||||||||||||||||||||||||||||||||||||||||||||||||||||||||||||||||||||||||||||||||||||||||||||||
| Gene mutation | |||||||||||||||||||||||||||||||||||||||||||||||||||||||||||||||||||||||||||||||||||||||||||||||||||
| FLT3 (+/-) | 32/55 | 17/69 | 0.018 | ||||||||||||||||||||||||||||||||||||||||||||||||||||||||||||||||||||||||||||||||||||||||||||||||
| NPM1 (+/-) | 22/65 | 25/61 | 0.611 | ||||||||||||||||||||||||||||||||||||||||||||||||||||||||||||||||||||||||||||||||||||||||||||||||
| DNMT3A (+/-) | 24/63 | 18/68 | 0.376 | ||||||||||||||||||||||||||||||||||||||||||||||||||||||||||||||||||||||||||||||||||||||||||||||||
| IDH2 (+/-) | 6/81 | 11/75 | 0.212 | ||||||||||||||||||||||||||||||||||||||||||||||||||||||||||||||||||||||||||||||||||||||||||||||||
| IDH1 (+/-) | 7/80 | 9/77 | 0.611 | ||||||||||||||||||||||||||||||||||||||||||||||||||||||||||||||||||||||||||||||||||||||||||||||||
| TET2 (+/-) | 8/79 | 7/79 | 1.000 | ||||||||||||||||||||||||||||||||||||||||||||||||||||||||||||||||||||||||||||||||||||||||||||||||
| RUNX1 (+/-) | 7/80 | 8/78 | 0.794 | ||||||||||||||||||||||||||||||||||||||||||||||||||||||||||||||||||||||||||||||||||||||||||||||||
| TP53 (+/-) | 8/79 | 6/80 | 0.782 | ||||||||||||||||||||||||||||||||||||||||||||||||||||||||||||||||||||||||||||||||||||||||||||||||
| NRAS (+/-) | 2/85 | 10/76 | 0.018 | ||||||||||||||||||||||||||||||||||||||||||||||||||||||||||||||||||||||||||||||||||||||||||||||||
| CEBPA (+/-) | 5/82 | 8/78 | 0.404 | ||||||||||||||||||||||||||||||||||||||||||||||||||||||||||||||||||||||||||||||||||||||||||||||||
| WT1 (+/-) | 4/83 | 6/80 | 0.535 | ||||||||||||||||||||||||||||||||||||||||||||||||||||||||||||||||||||||||||||||||||||||||||||||||
| PTPN11 (+/-) | 2/85 | 6/80 | 0.168 | ||||||||||||||||||||||||||||||||||||||||||||||||||||||||||||||||||||||||||||||||||||||||||||||||
| KIT (+/-) | 3/84 | 4/82 | 0.720 | ||||||||||||||||||||||||||||||||||||||||||||||||||||||||||||||||||||||||||||||||||||||||||||||||
| U2AF1 (+/-) | 2/85 | 5/81 | 0.278 | ||||||||||||||||||||||||||||||||||||||||||||||||||||||||||||||||||||||||||||||||||||||||||||||||
| KRAS (+/-) | 3/84 | 4/82 | 0.720 | ||||||||||||||||||||||||||||||||||||||||||||||||||||||||||||||||||||||||||||||||||||||||||||||||
| SMC1A (+/-) | 4/83 | 3/83 | 1.000 | ||||||||||||||||||||||||||||||||||||||||||||||||||||||||||||||||||||||||||||||||||||||||||||||||
| SMC3 (+/-) | 3/84 | 4/82 | 0.720 | ||||||||||||||||||||||||||||||||||||||||||||||||||||||||||||||||||||||||||||||||||||||||||||||||
| PHF6 (+/-) | 2/85 | 3/83 | 0.682 | ||||||||||||||||||||||||||||||||||||||||||||||||||||||||||||||||||||||||||||||||||||||||||||||||
| STAG2 (+/-) | 2/85 | 3/83 | 0.682 | ||||||||||||||||||||||||||||||||||||||||||||||||||||||||||||||||||||||||||||||||||||||||||||||||
| RAD21 (+/-) | 2/85 | 2/84 | 1.000 | ||||||||||||||||||||||||||||||||||||||||||||||||||||||||||||||||||||||||||||||||||||||||||||||||
| AML, acute myeloid leukemia; WBC, white blood cells; PB, peripheral blood; BM, bone marrow; FAB, French-American-British classification. | |||||||||||||||||||||||||||||||||||||||||||||||||||||||||||||||||||||||||||||||||||||||||||||||||||
TET3 expression may guide treatment choice between chemotherapy and HSCT
Because low expression of TET3 predicted poor clinical outcome in AML, we intended to investigate whether patients with low expression of TET3 could benefit from hematopoietic stem cell transplantation (HSCT). We compared OS and DFS between patients with and without HSCT among both TET3high and TET3low groups. In TET3high groups, although patients who received HSCT presented longer OS and DFS compared with patients who did not receive HSCT among both total AML (Figure 5A and 5B, P=0.052 and 0.221, respectively) and non-M3-AML (Figure 5C and 5D, P=0.021 and 0.128, respectively), the P did not attach statistical significance especially for DFS. However, in TET3low groups, patients who accepted HSCT showed significantly longer OS and DFS than patients who did not accept HSCT among both total AML (Figure 5E and 5F, P=0.003 and 0.005, respectively) and non-M3-AML (Figure 5G and 5H, P<0.001 and 0.001, respectively).
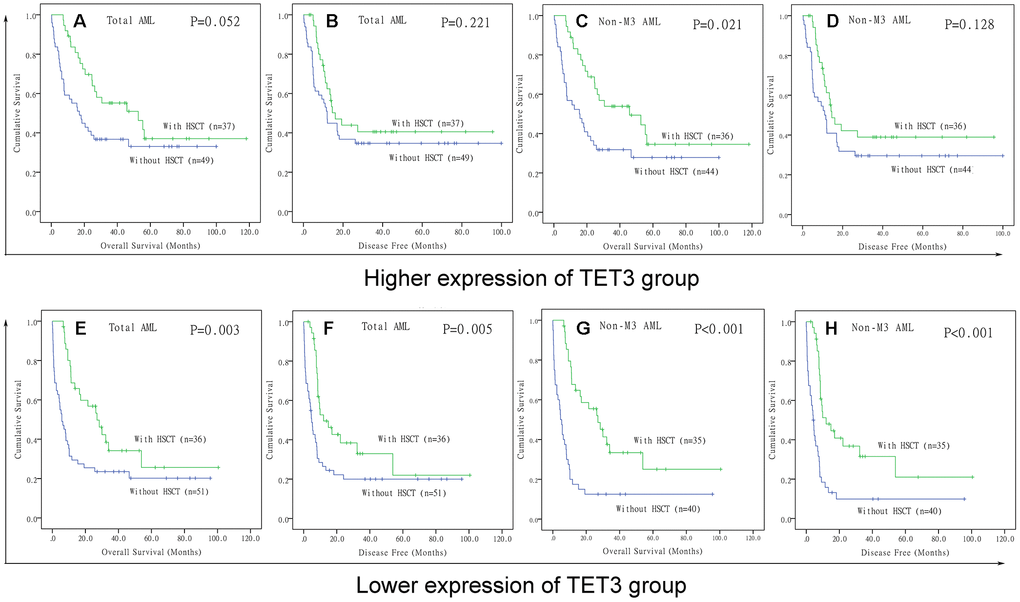
Figure 5. The effect of hematopoietic stem cell transplantation on survival of AML patients among different TET3 expression groups. (A–D) Kaplan–Meier survival curves of overall survival and disease free survival in low TET3 expression group. (E–H) Kaplan–Meier survival curves of overall survival and disease free survival in high TET3 expression group.
Correlations between TET3 expression and molecular signature
To gain insights into the biological function of TET3 in AML, we first compared the transcriptomes of TET3high and TET3low groups. A total of 464 differentially expressed genes were identified (FDR<0.05, |log2 FC|>1.5; Figure 6A and 6B; Supplementary Table 2), in which 300 genes were positively correlated with TET3 expression, and 164 were negatively correlated. Positively correlated genes such as CDKN2B and ZIC2 were reported to have anti-leukemia effects [16, 17]. Among the negatively associated genes, several genes including PAX2, IL2RA, SOX11, and PAK7 played as oncogenes in leukemia [18–21]. Furthermore, the Gene Ontology analysis was also showed in Figure 6C.
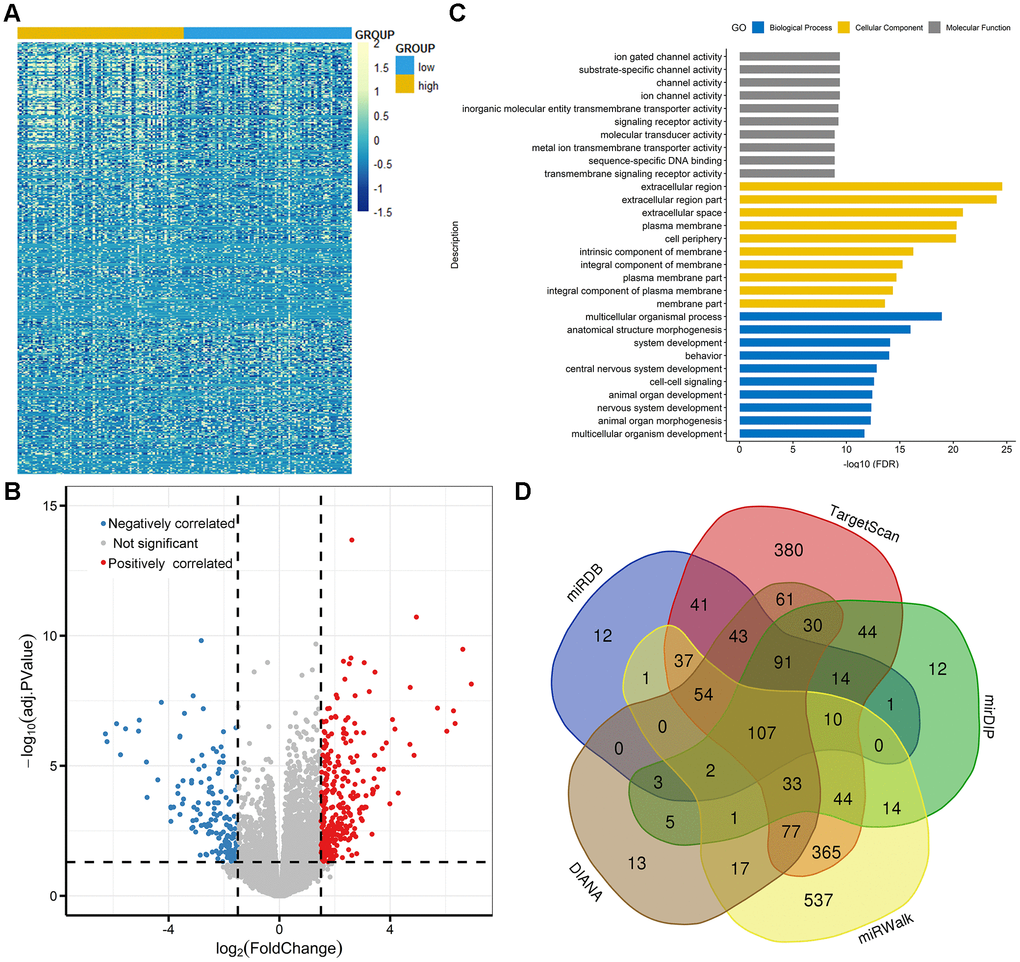
Figure 6. Molecular signatures associated with TET3 in AML. (A) Expression heatmap of differentially expressed genes between TET3low and TET3high AML patients (FDR<0.05, P<0.05 and |log2 FC|>1.5). (B) Volcano plot of differentially expressed genes between TET3low and TET3high AML patients. (C) Gene Ontology analysis of DEGs conducted using online website of STRING (http://string-db.org). (D) Venn results of microRNAs which could target TET3 predicted by DIANA (http://diana.imis.athena-innovation.gr/DianaTools/index.php? r=microT_CDS/index), miRDB (http://mirdb.org/miRDB/), mirDIP (http://ophid.utoronto.ca/mirDIP/), TargetScan (http://www.targetscan. org/vert_72/), and miRWalk (http://mirwalk.umm.uni-heidelberg.de/).
We next derived microRNA expression signatures associated with TET3 expression, and only 5 microRNAs were significantly correlated (FDR<0.05, |log2 FC|>1.5; Supplementary Table 3). MiR-196a-2 and miR-1269 were positively correlated with TET3 expression. Previous studies showed the anti-leukemia role of miR-196a as ERG regulators contributed to AML biology [22]. Negatively correlated microRNAs included miR-1247, miR-205, and miR-935. Interestingly, of these microRNAs, none of them were identified as predicted microRNAs that direct target TET3 (Figure 6D, Supplementary Table 4).
Discussion
Aberrant promoter methylation, an important hallmark of cancer cells, is considered as a major mechanism underlying the activation/inactivation of tumor-related genes [1]. In addition to DNMTs, TET gene family encodes proteins that represent crucial factors in the active DNA demethylation pathway [3–5]. A loss-of-function mutation in the TET2 gene is associated with leukemogenesis, drug response, and treatment outcome [11]. However, few studies investigated TETs expression and its clinical significance in AML [14, 15]. Herein, we systemically explored the TETs expression and its clinical significance in AML, and we hope that our findings could provide new insight into AML biology, improve treatment designs, and enhance the accuracy of prognosis for patients with AML. In this study, we showed that TETs expression showed differentially expressed in AML, which indicated different role of TETs during AML pathogenesis. In solid tumors, a number of studies showed the direct role of TETs in cancer biology. For example, two studies have showed that TET1 was a tumor suppressor gene that inhibited colon cancer growth by derepressing inhibitors of the WNT pathway [23, 24]. Xu et al disclosed that tumor suppressive role of TET2 promoted cancer immunity and immunotherapy efficacy [25]. Moreover, TET2 controlled chemoresistant slow-cycling cancer cell survival and tumor recurrence [26]. Cui et al demonstrated that TET3 as a potential tumor suppressor induced by the nuclear receptor TLX to regulate the growth and self-renewal in glioblastoma stem cells [27]. Moreover, several tumor suppressors, including BTG2, TUSC1, BAK1, LATS2, FZD6 and PPP2R1B, were regarded as common targets of TET3 [27]. Additionally, TET3 expression was decreased in ovarian cancer tissues, acted as a suppressor of ovarian cancer by demethylating miR-30d precursor gene promoter to block TGF-β1-induced epithelial-mesenchymal transition [28]. In our study, we showed that TET1 expression was significantly decreased in AML, whereas TET2 and TET3 expression was significantly increased in AML. Notably, we did not observe the direct association of TET3 with these factors, and found that several tumor suppressor genes (CDKN2B, ZIC2, and miR-196a) and oncogenes (PAX2, IL2RA, SOX11, and PAK7) were associated with TET3 in AML biology [16–22]. Moreover, these genes were important factors as cellular component or involving in many crucial biological processes contributing to cancer development. Lastly, TET3 was differently expressed among the distributions of FAB subtypes in AML. These results suggested that the biological network of TETs in cancer was dependent on cancer type and stage specific.
Although previous studies showed the significant associations of TET1 and TET2 expression with AML prognosis [14, 15], herein, we only observed that TET3 expression acted as an independent prognostic factor in AML, and could be overcame by HSCT. It was very interesting that TET3 expression was increased in AML, and its high expression showed a positive effect in AML. Possible reason was that TET3 expression may play a different role between cancer occurrence and development, and further functional studies are needed to explore the underlying mechanism in AML development. The expression pattern and clinical significance of TET3 have been determined in several human cancers. Several studies revealed that high expression of TET3 was revealed in renal cell carcinoma as well as endometrial cancers, and high mRNA levels of TET3 were independent predictors of poor outcome in renal cell carcinoma patients [29, 30]; whereas, several other investigations reported that TET3 was low-expressed in diverse human cancers. For instance, Bronowicka-Kłys et al showed that TET3 transcript levels were lower in stage III samples of cervical cancer [31]. Moreover, TET3 mRNA was decreased in chronic lymphocytic leukemia cells compared with healthy B cells [32]. In colorectal cancer, reduced transcript level of TET3 was observed in cancerous tissue compared with their histopathologically unchanged counterparts [33]. In addition, Misawa et al reported that TET3 methylation was highly associated with poor survival in T1 and T2 tumor stages of oropharyngeal cancer and oral cancer patients [34]. All these results further indicated that the role of TET3 in diverse human cancers was specific among different cancer types.
In summary, our study demonstrated that TETs showed significant expression differences in AML, and TET3 expression acted as a potential prognostic biomarker in AML, which may guide treatment choice between chemotherapy and HSCT.
Materials and Methods
CCLE, HPA, and EMBL-EBI dataset
Firstly, TETs expression in human cancer cell lines is assessed by the CCLE dataset (https://www. broadinstitute.org/ccle), which provides public access to genomic data, analysis, and visualization for about 1000 cell lines [35]. Secondly, we also used The HPA dataset (https://www.proteinatlas.org/) to verify TETs expression in human cancer cell lines [36]. Lastly, TETs expression in AML cell lines is verified by the EMBL-EBI dataset (https://www.ebi.ac.uk), which has provided free and open access to a range of bioinformatics applications for sequence analysis since 1998 [37].
GEPIA dataset
TETs expression in AML patients and normal controls was analyzed by the GEPIA web (http://gepia.cancer-pku.cn/), whose data from TCGA and the GTEx projects [38].
Patients from TCGA and GEO
A total of 173 AML patients with available TETs expression data from TCGA (https://cancergenome.nih.gov/ and http://www.cbioportal.org/) were identified and included in this study [39]. Clinical and molecular characteristics were obtained, including, age, sex, WBC counts, PB blasts, BM blasts, FAB subtypes, and the frequencies of genetic mutations as presented in Table 3. After induction chemotherapy, consolidation treatment included chemotherapy (100 patients received) and HSCT (73 patients accepted).
In addition, two cohorts of 162 and 78 CN-AML patients from GEO data (GSE12417) were also included. The online web tool Genomicscape (http://genomicscape.com/microarray/survival.php) was applied to validate the prognostic value of TETs expression among CN-AML patients.
Bioinformatics analysis
The details for the identification of microRNAs targeting TET3 were reported as our previous study [40].
Statistical analysis
Statistical analysis and figures creation were performed on SPSS 22.0 software. Mann-Whitney’s U test was used for the comparison of continuous variables, whereas Pearson Chi-square analysis or Fisher exact test was applied for the comparison of categorical variables. The prognostic effect of TETs expression on DFS and OS was evaluated analyzed though Kaplan-Meier analysis and Cox regression analysis. The two-tailed P value < 0.05 in all statistical analysis was defined as statistically significant.
Ethical approval
All procedures performed in studies involving human participants were approved by the Ethics Committee of the Affiliated People’s Hospital of Jiangsu University and the Washington University Human Studies Committee and with the 1964 Helsinki declaration and its later amendments or comparable ethical standards. Informed consent was obtained from all patients included in this study.
Supplementary Materials
Author Contributions
Jingdong Zhou conceived and designed the study; Tingjuan Zhang, Yangli Zhao and Yangjing Zhao analyzed the data; Jingdong Zhou wrote the paper. All authors read and approved the final manuscript.
Conflicts of Interest
The authors declare that they have no conflict of interest.
Funding
The work was supported by National Natural Science foundation of China (81900166), Zhenjiang Clinical Research Center of Hematology (SS2018009).
References
- 1. Taby R, Issa JP. Cancer epigenetics. CA Cancer J Clin. 2010; 60:376–92. https://doi.org/10.3322/caac.20085 [PubMed]
- 2. Fong CY, Morison J, Dawson MA. Epigenetics in the hematologic malignancies. Haematologica. 2014; 99:1772–83. https://doi.org/10.3324/haematol.2013.092007 [PubMed]
- 3. Okano M, Bell DW, Haber DA, Li E. DNA methyltransferases Dnmt3a and Dnmt3b are essential for de novo methylation and mammalian development. Cell. 1999; 99:247–57. https://doi.org/10.1016/S0092-8674(00)81656-6 [PubMed]
- 4. Zhang ZM, Lu R, Wang P, Yu Y, Chen D, Gao L, Liu S, Ji D, Rothbart SB, Wang Y, Wang GG, Song J. Structural basis for DNMT3A-mediated de novo DNA methylation. Nature. 2018; 554:387–91. https://doi.org/10.1038/nature25477 [PubMed]
- 5. Rasmussen KD, Helin K. Role of TET enzymes in DNA methylation, development, and cancer. Genes Dev. 2016; 30:733–50. https://doi.org/10.1101/gad.276568.115 [PubMed]
- 6. Tahiliani M, Koh KP, Shen Y, Pastor WA, Bandukwala H, Brudno Y, Agarwal S, Iyer LM, Liu DR, Aravind L, Rao A. Conversion of 5-methylcytosine to 5-hydroxymethylcytosine in mammalian DNA by MLL partner TET1. Science. 2009; 324:930–35. https://doi.org/10.1126/science.1170116 [PubMed]
- 7. Ito S, D’Alessio AC, Taranova OV, Hong K, Sowers LC, Zhang Y. Role of Tet proteins in 5mC to 5hmC conversion, ES-cell self-renewal and inner cell mass specification. Nature. 2010; 466:1129–33. https://doi.org/10.1038/nature09303 [PubMed]
- 8. Ito S, Shen L, Dai Q, Wu SC, Collins LB, Swenberg JA, He C, Zhang Y. Tet proteins can convert 5-methylcytosine to 5-formylcytosine and 5-carboxylcytosine. Science. 2011; 333:1300–03. https://doi.org/10.1126/science.1210597 [PubMed]
- 9. Cimmino L, Dolgalev I, Wang Y, Yoshimi A, Martin GH, Wang J, Ng V, Xia B, Witkowski MT, Mitchell-Flack M, Grillo I, Bakogianni S, Ndiaye-Lobry D, et al. Restoration of TET2 Function Blocks Aberrant Self-Renewal and Leukemia Progression. Cell. 2017; 170:1079–1095.e20. https://doi.org/10.1016/j.cell.2017.07.032 [PubMed]
- 10. Rasmussen KD, Jia G, Johansen JV, Pedersen MT, Rapin N, Bagger FO, Porse BT, Bernard OA, Christensen J, Helin K. Loss of TET2 in hematopoietic cells leads to DNA hypermethylation of active enhancers and induction of leukemogenesis. Genes Dev. 2015; 29:910–22. https://doi.org/10.1101/gad.260174.115 [PubMed]
- 11. Solary E, Bernard OA, Tefferi A, Fuks F, Vainchenker W. The Ten-Eleven Translocation-2 (TET2) gene in hematopoiesis and hematopoietic diseases. Leukemia. 2014; 28:485–96. https://doi.org/10.1038/leu.2013.337 [PubMed]
- 12. Abdel-Wahab O, Mullally A, Hedvat C, Garcia-Manero G, Patel J, Wadleigh M, Malinge S, Yao J, Kilpivaara O, Bhat R, Huberman K, Thomas S, Dolgalev I, et al. Genetic characterization of TET1, TET2, and TET3 alterations in myeloid malignancies. Blood. 2009; 114:144–47. https://doi.org/10.1182/blood-2009-03-210039 [PubMed]
- 13. Bejar R, Lord A, Stevenson K, Bar-Natan M, Pérez-Ladaga A, Zaneveld J, Wang H, Caughey B, Stojanov P, Getz G, Garcia-Manero G, Kantarjian H, Chen R, et al. TET2 mutations predict response to hypomethylating agents in myelodysplastic syndrome patients. Blood. 2014; 124:2705–12. https://doi.org/10.1182/blood-2014-06-582809 [PubMed]
- 14. Zhang TJ, Zhou JD, Yang DQ, Wang YX, Wen XM, Guo H, Yang L, Lian XY, Lin J, Qian J. TET2 expression is a potential prognostic and predictive biomarker in cytogenetically normal acute myeloid leukemia. J Cell Physiol. 2018; 233:5838–46. https://doi.org/10.1002/jcp.26373 [PubMed]
- 15. Wang J, Li F, Ma Z, Yu M, Guo Q, Huang J, Yu W, Wang Y, Jin J. High Expression of TET1 Predicts Poor Survival in Cytogenetically Normal Acute Myeloid Leukemia From Two Cohorts. EBioMedicine. 2018; 28:90–96. https://doi.org/10.1016/j.ebiom.2018.01.031 [PubMed]
- 16. Haidar MA, Cao XB, Manshouri T, Chan LL, Glassman A, Kantarjian HM, Keating MJ, Beran MS, Albitar M. p16INK4A and p15INK4B gene deletions in primary leukemias. Blood. 1995; 86:311–15. https://doi.org/10.1182/blood.V86.1.311.bloodjournal861311 [PubMed]
- 17. Chen X, Yang S, Zeng J, Chen M. miR-1271-5p inhibits cell proliferation and induces apoptosis in acute myeloid leukemia by targeting ZIC2. Mol Med Rep. 2019; 19:508–14. https://doi.org/10.3892/mmr.2018.9680 [PubMed]
- 18. Siehl JM, Thiel E, Heufelder K, Snarski E, Schwartz S, Mailänder V, Keilholz U. Possible regulation of Wilms’ tumour gene 1 (WT1) expression by the paired box genes PAX2 and PAX8 and by the haematopoietic transcription factor GATA-1 in human acute myeloid leukaemias. Br J Haematol. 2003; 123:235–42. https://doi.org/10.1046/j.1365-2141.2003.04622.x [PubMed]
- 19. Min WS, Kim HJ, Choi Y, Jeong HY, Kim CC. Interpretation of interleukin-2 receptor alpha positive cells during induction chemotherapy for adult acute myelogenous leukaemia patients. Hematol Oncol. 2007; 25:76–83. https://doi.org/10.1002/hon.807 [PubMed]
- 20. Tosic N, Petrovic I, Grujicic NK, Davidovic S, Virijevic M, Vukovic NS, Pavlovic S, Stevanovic M. Prognostic significance of SOX2, SOX3, SOX11, SOX14 and SOX18 gene expression in adult de novo acute myeloid leukemia. Leuk Res. 2018; 67:32–38. https://doi.org/10.1016/j.leukres.2018.02.001 [PubMed]
- 21. Quan L, Cheng Z, Dai Y, Jiao Y, Shi J, Fu L. Prognostic significance of PAK family kinases in acute myeloid leukemia. Cancer Gene Ther. 2020; 27:30–37. https://doi.org/10.1038/s41417-019-0090-1 [PubMed]
- 22. Coskun E, von der Heide EK, Schlee C, Kühnl A, Gökbuget N, Hoelzer D, Hofmann WK, Thiel E, Baldus CD. The role of microRNA-196a and microRNA-196b as ERG regulators in acute myeloid leukemia and acute T-lymphoblastic leukemia. Leuk Res. 2011; 35:208–13. https://doi.org/10.1016/j.leukres.2010.05.007 [PubMed]
- 23. Neri F, Dettori D, Incarnato D, Krepelova A, Rapelli S, Maldotti M, Parlato C, Paliogiannis P, Oliviero S. TET1 is a tumour suppressor that inhibits colon cancer growth by derepressing inhibitors of the WNT pathway. Oncogene. 2015; 34:4168–76. https://doi.org/10.1038/onc.2014.356 [PubMed]
- 24. Guo H, Zhu H, Zhang J, Wan B, Shen Z. TET1 suppresses colon cancer proliferation by impairing β-catenin signal pathway. J Cell Biochem. 2019; 120:12559–65. https://doi.org/10.1002/jcb.28522 [PubMed]
- 25. Xu YP, Lv L, Liu Y, Smith MD, Li WC, Tan XM, Cheng M, Li Z, Bovino M, Aubé J, Xiong Y. Tumor suppressor TET2 promotes cancer immunity and immunotherapy efficacy. J Clin Invest. 2019; 130:4316–31. https://doi.org/10.1172/JCI129317 [PubMed]
- 26. Puig I, Tenbaum SP, Chicote I, Arqués O, Martínez-Quintanilla J, Cuesta-Borrás E, Ramírez L, Gonzalo P, Soto A, Aguilar S, Eguizabal C, Caratù G, Prat A, et al. TET2 controls chemoresistant slow-cycling cancer cell survival and tumor recurrence. J Clin Invest. 2018; 128:3887–905. https://doi.org/10.1172/JCI96393 [PubMed]
- 27. Cui Q, Yang S, Ye P, Tian E, Sun G, Zhou J, Sun G, Liu X, Chen C, Murai K, Zhao C, Azizian KT, Yang L, et al. Downregulation of TLX induces TET3 expression and inhibits glioblastoma stem cell self-renewal and tumorigenesis. Nat Commun. 2016; 7:10637. https://doi.org/10.1038/ncomms10637 [PubMed]
- 28. Ye Z, Li J, Han X, Hou H, Chen H, Zheng X, Lu J, Wang L, Chen W, Li X, Zhao L. TET3 inhibits TGF-β1-induced epithelial-mesenchymal transition by demethylating miR-30d precursor gene in ovarian cancer cells. J Exp Clin Cancer Res. 2016; 35:72. https://doi.org/10.1186/s13046-016-0350-y [PubMed]
- 29. Chen D, Maruschke M, Hakenberg O, Zimmermann W, Stief CG, Buchner A. TOP2A, HELLS, ATAD2, and TET3 Are Novel Prognostic Markers in Renal Cell Carcinoma. Urology. 2017; 102:265.e1–7. https://doi.org/10.1016/j.urology.2016.12.050 [PubMed]
- 30. Ciesielski P, Jóźwiak P, Wójcik-Krowiranda K, Forma E, Cwonda Ł, Szczepaniec S, Bieńkiewicz A, Bryś M, Krześlak A. Differential expression of ten-eleven translocation genes in endometrial cancers. Tumour Biol. 2017; 39:1010428317695017. https://doi.org/10.1177/1010428317695017 [PubMed]
- 31. Bronowicka-Kłys DE, Roszak A, Pawlik P, Sajdak S, Sowińska A, Jagodziński PP. Transcript levels of ten-eleven translocation type 1-3 in cervical cancer and non-cancerous cervical tissues. Oncol Lett. 2017; 13:3921–27. https://doi.org/10.3892/ol.2017.5930 [PubMed]
- 32. Van Damme M, Crompot E, Meuleman N, Maerevoet M, Mineur P, Bron D, Lagneaux L, Stamatopoulos B. Characterization of TET and IDH gene expression in chronic lymphocytic leukemia: comparison with normal B cells and prognostic significance. Clin Epigenetics. 2016; 8:132. https://doi.org/10.1186/s13148-016-0298-y [PubMed]
- 33. Rawłuszko-Wieczorek AA, Siera A, Horbacka K, Horst N, Krokowicz P, Jagodziński PP. Clinical significance of DNA methylation mRNA levels of TET family members in colorectal cancer. J Cancer Res Clin Oncol. 2015; 141:1379–92. https://doi.org/10.1007/s00432-014-1901-2 [PubMed]
- 34. Misawa K, Imai A, Mochizuki D, Mima M, Endo S, Misawa Y, Kanazawa T, Mineta H. Association of TET3 epigenetic inactivation with head and neck cancer. Oncotarget. 2018; 9:24480–93. https://doi.org/10.18632/oncotarget.25333 [PubMed]
- 35. Barretina J, Caponigro G, Stransky N, Venkatesan K, Margolin AA, Kim S, Wilson CJ, Lehár J, Kryukov GV, Sonkin D, Reddy A, Liu M, Murray L, et al. The Cancer Cell Line Encyclopedia enables predictive modelling of anticancer drug sensitivity. Nature. 2012; 483:603–07. https://doi.org/10.1038/nature11003 [PubMed]
- 36. Uhlén M, Björling E, Agaton C, Szigyarto CA, Amini B, Andersen E, Andersson AC, Angelidou P, Asplund A, Asplund C, Berglund L, Bergström K, Brumer H, et al. A human protein atlas for normal and cancer tissues based on antibody proteomics. Mol Cell Proteomics. 2005; 4:1920–32. https://doi.org/10.1074/mcp.M500279-MCP200 [PubMed]
- 37. Li W, Cowley A, Uludag M, Gur T, McWilliam H, Squizzato S, Park YM, Buso N, Lopez R. The EMBL-EBI bioinformatics web and programmatic tools framework. Nucleic Acids Res. 2015; 43:W580–4. https://doi.org/10.1093/nar/gkv279 [PubMed]
- 38. Tang Z, Li C, Kang B, Gao G, Li C, Zhang Z. GEPIA: a web server for cancer and normal gene expression profiling and interactive analyses. Nucleic Acids Res. 2017; 45:W98–102. https://doi.org/10.1093/nar/gkx247 [PubMed]
- 39. Ley TJ, Miller C, Ding L, Raphael BJ, Mungall AJ, Robertson A, Hoadley K, Triche TJ
Jr , Laird PW, Baty JD, Fulton LL, Fulton R, Heath SE, et al, and Cancer Genome Atlas Research Network. Genomic and epigenomic landscapes of adult de novo acute myeloid leukemia. N Engl J Med. 2013; 368:2059–74. https://doi.org/10.1056/NEJMoa1301689 [PubMed] - 40. Zhou JD, Zhang TJ, Xu ZJ, Gu Y, Ma JC, Li XX, Guo H, Wen XM, Zhang W, Yang L, Liu XH, Lin J, Qian J. BCL2 overexpression: clinical implication and biological insights in acute myeloid leukemia. Diagn Pathol. 2019; 14:68. https://doi.org/10.1186/s13000-019-0841-1 [PubMed]