Submit an Article
Navigate
Home
Editorial Board
Editorial Policies
Current Volume
Archive
Scientific Integrity
Publication Ethics Statements
Interviews with Outstanding Authors
Newsroom
Sponsored Conferences
Podcast
Contact
Special Collections
Submit an Article
Online ISSN: 1945-4589
Research Paper
|
Volume 12, Issue 6
|
pp. 5031–5047
Expression and prognosis analysis of
TET
family in acute myeloid leukemia
Back to article
Figure 6
(6 of 6)
−
100%
+
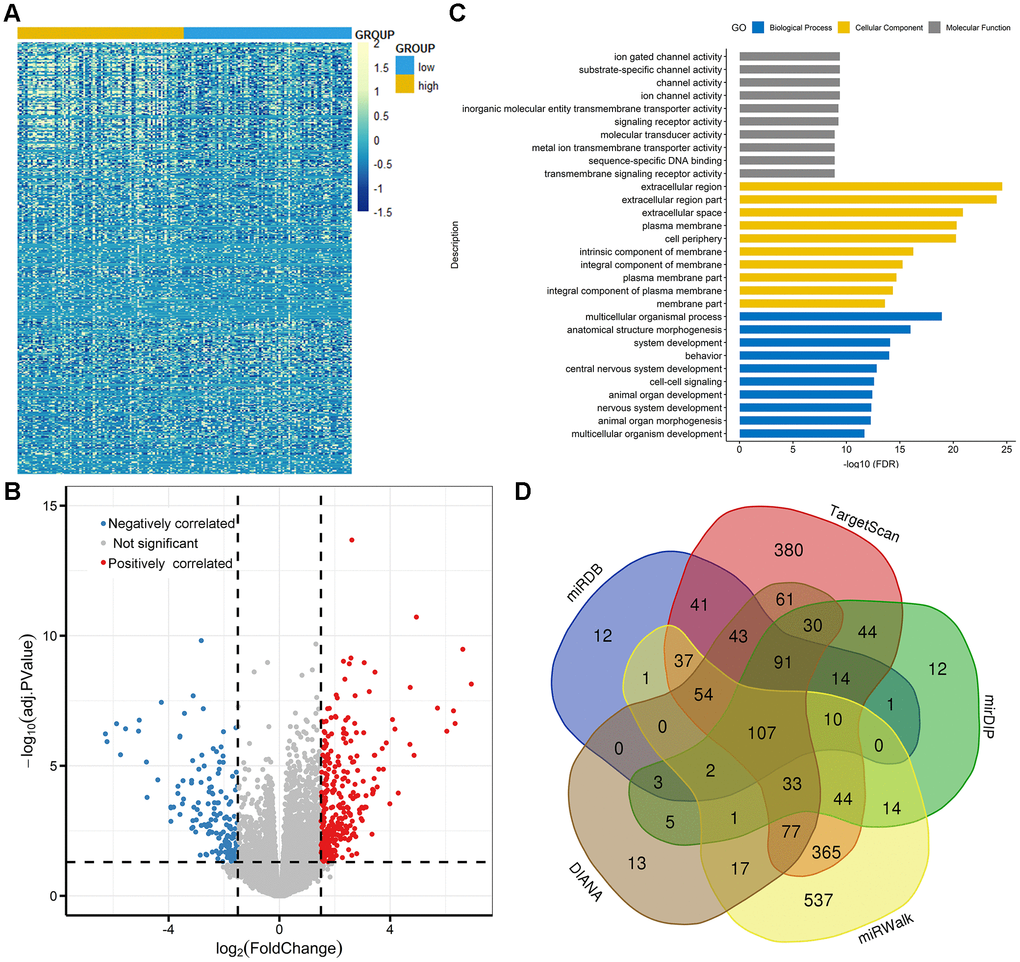
Figure 6.
Molecular signatures associated with
TET3
in AML.
(
A
) Expression heatmap of differentially expressed genes between
TET3
low
and
TET3
high
AML patients (FDR<0.05,
P
<0.05 and |log2 FC|>1.5). (
B
) Volcano plot of differentially expressed genes between
TET3
low
and
TET3
high
AML patients. (
C
) Gene Ontology analysis of DEGs conducted using online website of STRING (
http://string-db.org
). (
D
) Venn results of microRNAs which could target
TET3
predicted by DIANA (
http://diana.imis.athena-innovation.gr/DianaTools/index.php? r=microT_CDS/index
), miRDB (
http://mirdb.org/miRDB/
), mirDIP (
http://ophid.utoronto.ca/mirDIP/
), TargetScan (
http://www.targetscan. org/vert_72/
), and miRWalk (
http://mirwalk.umm.uni-heidelberg.de/
).