


Introduction
Estimating the lifespan of erythrocytes is useful for the differential diagnosis of anemia, as it is known that the erythrocyte lifespan in hemolytic patients is shortened [1]. Previously, obtaining the lifespan or mean age of erythrocytes was very difficult; therefore, it was seldom measured. Furthermore, supply of 51Cr, which is needed for measuring erythrocyte lifespan, was ceased in Japan in 2015 due to low demand. This left Japanese doctors unable to measure the erythrocyte lifespan of patients by means of 51Cr. Biotin-labeling [2, 3] is also used to measure the erythrocyte lifespan, however its procedure is very laborious as well, requiring aseptic labeling of the erythrocytes and repeated blood samplings. Breath carbon monoxide (CO) measurement [4, 5] also may be useful to estimate erythrocyte turnover; however, this technique cannot be applied to smokers. We have proposed a method to estimate erythrocyte mean age from HbA1c and average glucose [6]. However, the method needed a glycation constant to be determined by another method. Some indices such as reticulocyte and haptogloblin were not sensitive enough to indicate mild hemolysis. Cases with latent hemolysis were reported which showed normal reticulocyte and normal haptogloblin levels, and yet, they showed shortened erythrocyte lifespan [7–9].
Creatine in the cells is maintained by creatine transporters. Deficiency in these transporters leads to symptoms [10, 11]. Young erythrocytes have adequate transporter activity resulting in intracellular creatine being tens of times higher than in plasma. However, the activity of the transporter gradually diminishes, so that old erythrocytes cannot maintain this concentration gradient.
Erythrocyte creatine (EC) has been demonstrated to be an excellent indicator of hemolysis [12, 13]. Estimation of mean erythrocyte age (MRBC) using EC would be more convenient than the 51Cr method, as it requires only one blood sample. Though an increase in EC value has been correlated with shorter lifespan of erythrocytes, EC value itself has not previously been used for the estimation of MRBC directly. An estimation of MRBC would be more useful for quantitative assessment of patients than simple EC value. Moreover, MRBC derived by EC may be comparable with MRBC derived by other methods.
In this study, we aimed to formulate an equation to obtain MRBC from EC concentration based on a model.
Results
Relationship between MRBC and loge EC
A significant linear relationship (r = −0.9475, df =19, t = 12.92, p = 7.368 × 10⁻¹¹) was observed between 51Cr-derived MRBC and loge EC (Figure 1). The relationship appears to be mono-exponential which is concurrent with the prediction by our model (Supplement) that the relationship would be bi- or mono-exponential.
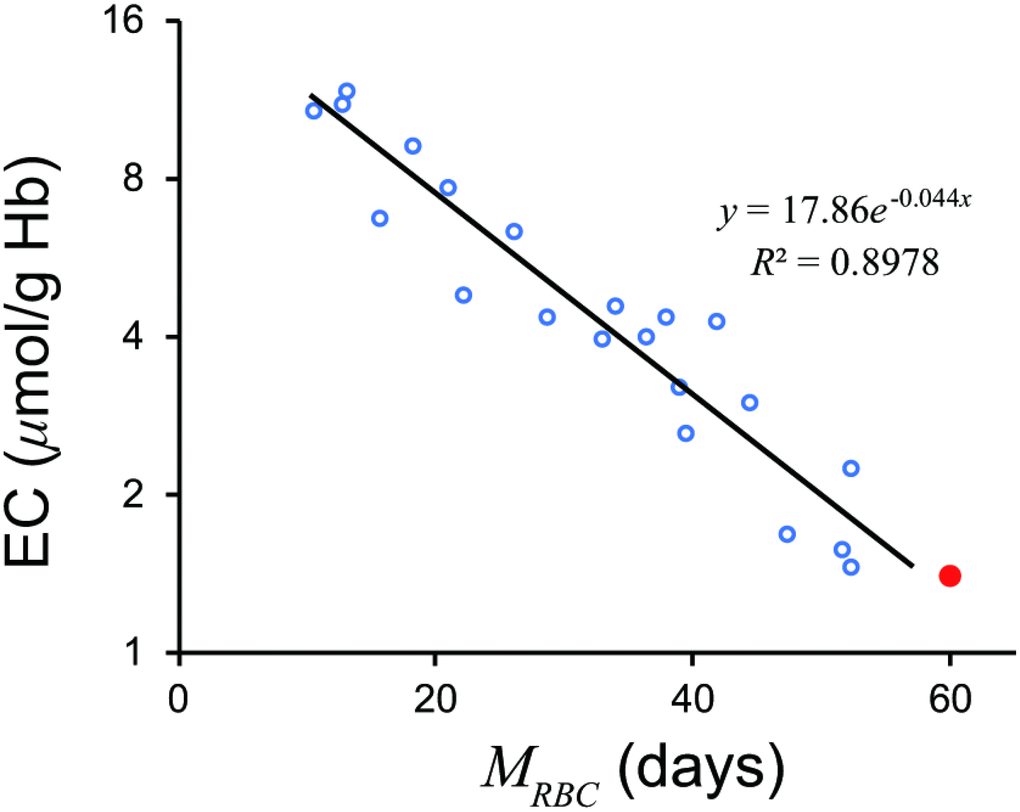
Figure 1. Relationship between MRBC and loge EC. A significant linear relationship was observed. A red closed circle denotes a standard value; MRBC = 60 days, EC = 1.4μmol/g Hb. A black line denotes a regression line. EC, erythrocyte creatine; MRBC, mean erythrocyte age.
A regression line was as follows.
A standard value of EC of 1.4 μmol/g Hb gives an MRBC of 58.14 days.
Equation (2) accurately estimated MRBC from EC values (Figure 2).
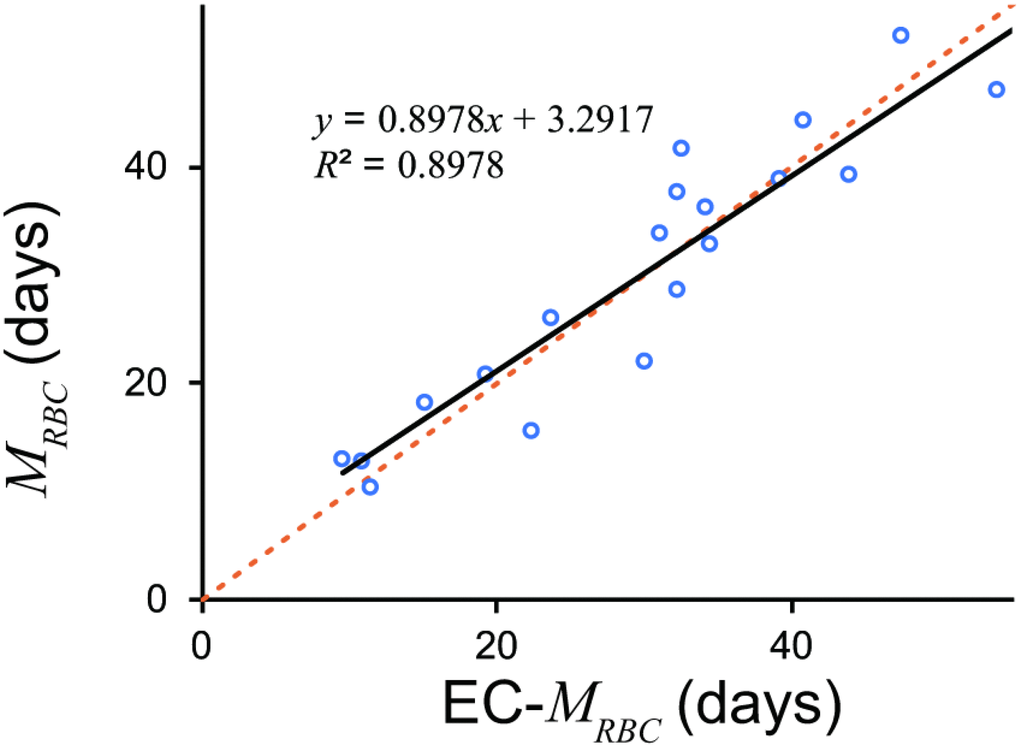
Figure 2. MRBC estimated by EC and 51Cr. EC derived MRBC showed excellent estimation. An orange dotted line denotes line of identification (y = x). A black line denotes a regression line. EC, erythrocyte creatine; MRBC, mean erythrocyte age.
Discussion
The current study successfully established a reliable method of estimating MRBC from EC based on a creatine model (Supplement). We would be able to determine a glycation constant for the method to estimate erythrocyte mean age from HbA1c and average glucose [14].
Although Fehr et al. [13] divided patients into a severe hemolytic disease group and a group with milder forms of hemolysis, our model suggested that logarithm of EC may combine the two groups (Figure 3). The regression formula passed close to a standard value of EC, 1.4 μmol/g Hb and 60 days of MRBC, which proves the validity of the formula.
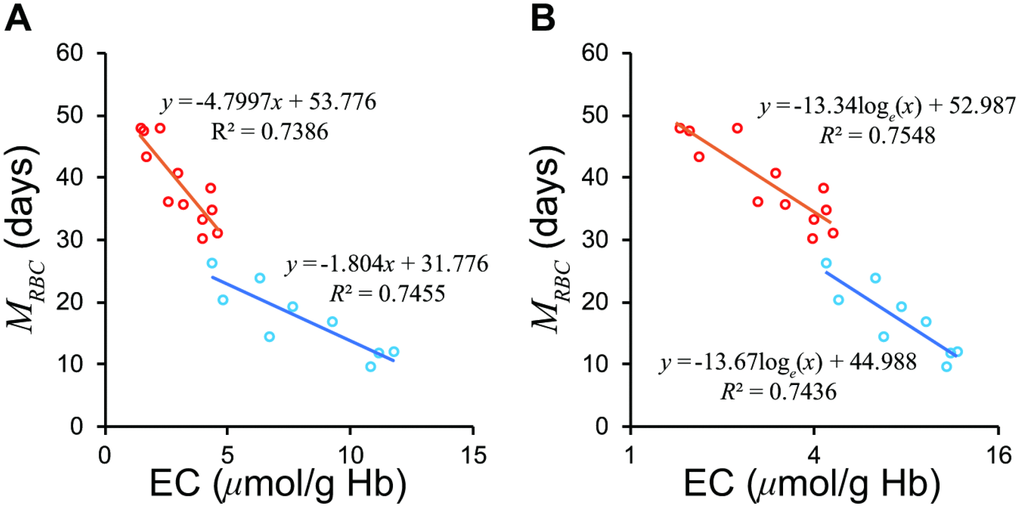
Figure 3. Relationship between EC and MRBC in the groups with severe and mild hemolytic disease. (A) The two groups show differing regression lines on a normal scale. (B) The two groups are unified on a semi-logarithmic scale. The Red circles represent mild group, sky blue the severe group according to Fehr et al. [13]. EC, erythrocyte creatine; MRBC, mean erythrocyte age.
It cannot be determined which wing of the two lines (Supplement) the observed line of the loge EC– MRBC relationship is on; i.e. whether the slope of the graph represents the rate constant for creatine diffusion (λ1) or the rate constant for decline in creatine transporter (λ2). Another equation may need to be developed for value ranges not explored in this study.
The devised method was formulated entirely based on the previously presented data from only 21 patients.
This method should be verified by further study with various hematological diseases including thalassemia and hereditary spherocytosis. Estimation of MRBC from 51Cr half-life may not be optimal, although we believe that it would be tolerable. The EC transporter activity function, Be−λ2t relies solely on the assumption that the number of transporters reduces overtime randomly due to erythrocytes’ lack of nucleus. However, the linear relationship between loge EC and MRBC confirms the assumption. The EC measuring method of Fehr et al. [13] used a diacetyl-l-naphthol chemical reaction, which is less sensitive than the recently developed N-methylcarbamoyl derivative of methylene blue, 10-N-methylcarbamoyl-3,7-bis(dimethylamino)phenothiazine (MCDP) enzyme method [15]. Further study on the validity of our proposed formula would be best done in a country where 51Cr is available.
Conclusions
Our equation does allow calculation of MRBC based on EC, which has practical applications such as the diagnosis of anemia.
Materials and Methods
Patients
Data from 21 patients with hemolytic anemia, that was published by Fehr et al. [13], was examined. As this is a re-analysis study, approval by the institutional review board was not required.
Data conversion
We estimated MRBC by multiplying the half life of 51Cr by 2.61. As human erythrocytes do not obey the Poisson process [16], the term “half-life” is not entirely suitable for erythrocytes. Fehr et al. [13] determined 51Cr half-life, the elution-corrected 51Cr half-life, and the mean cell lifespan. The mean cell lifespan was not recorded in their table. The elution-corrected 51Cr half-life would provide an estimate of MRBC, considering that normal erythrocytes in a human have a similar lifespan [16]. However, their elution-corrected 51Cr half-life seems less concordant with EC rank. Complicated procedures sometimes reduce the stability of the system. Therefore, we chose the simple uncorrected 51Cr half-life in the same way as Fehr et al. [13]. Considering that MRBC for normal erythrocytes is about 60 days, and the normal range of 51Cr half-life was 23 – 27 days, multiplying 51Cr half-life by 2.61 (= 60/23) provides a good estimation of MRBC in practice.
The units for erythrocyte creatine concentration used by Fehr et al. [13] were mg/dL of red cells. We converted these into μmol/g Hb by the following equation, assuming mean cell hemoglobin concentration (MCHC) is 33g/dL. The molecular weight of creatine is 131.15. While MCHC varies naturally and decreases in iron deficiency anemia, variability in MCHC is generally low.
Data analysis
Data on EC and MRBC were analyzed with a spreadsheet software, Excel ® 365 (Microsoft Corporation, Redmond, WA, USA).
Logarithms of EC and MRBC were plotted based on our model (Supplement).
Supplementary Materials
Author Contributions
M. Kameyama contributed to theory, the analysis of the data, writing the original draft, and funding acquisition. M. Koga contributed to conceptualization, the analysis of the data, and supervision. T.O. contributed to advise on the nature of EC. All the authors have read and approved the final manuscript.
Acknowledgments
The authors would like to thank Ms. Natalie Okawa and Editage for English language editing of this manuscript.
Conflicts of Interest
M.Kameyama received research funding from Fujifilm RI Pharma, which stopped supply of 51Cr in Japan, Nihon Med-Physics, and Daiichi-Sankyo. TO received research funding from Asahi Kasei Pharma.
Funding
This study is partly supported by Grants-in-Aid for Scientific Research, 18K07488 for M. Kameyama.
References
- 1. Panzer S, Kronik G, Lechner K, Bettelheim P, Neumann E, Dudczak R. Glycosylated hemoglobins (GHb): an index of red cell survival. Blood. 1982; 59:1348–50. https://doi.org/10.1182/blood.V59.6.1348.1348 [PubMed]
- 2. Mock DM, Lankford GL, Widness JA, Burmeister LF, Kahn D, Strauss RG. Measurement of red cell survival using biotin-labeled red cells: validation against 51Cr-labeled red cells. Transfusion. 1999; 39:156–62. https://doi.org/10.1046/j.1537-2995.1999.39299154729.x [PubMed]
- 3. Franco RS, Lohmann J, Silberstein EB, Mayfield-Pratt G, Palascak M, Nemeth TA, Joiner CH, Weiner M, Rucknagel DL. Time-dependent changes in the density and hemoglobin F content of biotin-labeled sickle cells. J Clin Invest. 1998; 101:2730–40. https://doi.org/10.1172/JCI2484 [PubMed]
- 4. Strocchi A, Schwartz S, Ellefson M, Engel RR, Medina A, Levitt MD. A simple carbon monoxide breath test to estimate erythrocyte turnover. J Lab Clin Med. 1992; 120:392–99. [PubMed]
- 5. Furne JK, Springfield JR, Ho SB, Levitt MD. Simplification of the end-alveolar carbon monoxide technique to assess erythrocyte survival. J Lab Clin Med. 2003; 142:52–57. https://doi.org/10.1016/S0022-2143(03)00086-6 [PubMed]
- 6. Kameyama M, Takeuchi S, Ishii S. Steady-state relationship between average glucose, HbA1c and RBC lifespan. J Theor Biol. 2018; 447:111–17. https://doi.org/10.1016/j.jtbi.2018.03.023 [PubMed]
- 7. Herranz L, Grande C, Janez M, Pallardo F. Red blood cell autoantibodies with a shortened erythrocyte life span as a cause of lack of relation between glycosylated hemoglobin and mean blood glucose levels in a woman with type 1 diabetes. Diabetes Care. 1999; 22:2085–86. https://doi.org/10.2337/diacare.22.12.2085 [PubMed]
- 8. Ishii C, Tane N, Negishi K, Katayama S. A case of type 2 diabetes who showed discrepancy between plasma glucose and HbA1c due to latent autoimmune hemolytic anemia. J Japan Diab Soc. 2001; 44:157–60. https://doi.org/10.11213/tonyobyo1958.44.157
- 9. Hiratani K, Natazuka T, Suemori S, Wada H, Koga M. A case of stomatocytosis in a type 2 diabetic patient accompanied with falsely low HbA1c levels due to latent hemolysis. J Japan Diab Soc. 2016; 59:719–23. https://doi.org/10.11213/tonyobyo.59.719
- 10. van de Kamp JM, Betsalel OT, Mercimek-Mahmutoglu S, Abulhoul L, Grünewald S, Anselm I, Azzouz H, Bratkovic D, de Brouwer A, Hamel B, Kleefstra T, Yntema H, Campistol J, et al. Phenotype and genotype in 101 males with X-linked creatine transporter deficiency. J Med Genet. 2013; 50:463–72. https://doi.org/10.1136/jmedgenet-2013-101658 [PubMed]
- 11. Dunbar M, Jaggumantri S, Sargent M, Stockler-Ipsiroglu S, van Karnebeek CD. Treatment of X-linked creatine transporter (SLC6A8) deficiency: systematic review of the literature and three new cases. Mol Genet Metab. 2014; 112:259–74. https://doi.org/10.1016/j.ymgme.2014.05.011 [PubMed]
- 12. Griffiths WJ, Fitzpatrick M. The effect of age on the creatine in red cells. Br J Haematol. 1967; 13:175–80. https://doi.org/10.1111/j.1365-2141.1967.tb08728.x [PubMed]
- 13. Fehr J, Knob M. Comparison of red cell creatine level and reticulocyte count in appraising the severity of hemolytic processes. Blood. 1979; 53:966–76. https://doi.org/10.1182/blood.V53.5.966.966 [PubMed]
- 14. Kameyama M, Okumiya T, Tokuhiro S, Matsumura Y, Matsui H, Ono Y, Iwasaka T, Hiratani K, Koga M. Estimation of the hemoglobin glycation rate constant. BioRχiv. 2019. https://doi.org/10.1101/652818
- 15. Okumiya T, Jiao Y, Saibara T, Miike A, Park K, Kageoka T, Sasaki M. Sensitive enzymatic assay for erythrocyte creatine with production of methylene blue. Clin Chem. 1998; 44:1489–96. https://doi.org/10.1093/clinchem/44.7.1489 [PubMed]
- 16. Franco RS. The measurement and importance of red cell survival. Am J Hematol. 2009; 84:109–14. https://doi.org/10.1002/ajh.21298 [PubMed]