


Introduction
Gastric cancer is one of the most common malignancies and one of the leading causes of cancer-related mortality worldwide [1]. Gastrectomy with D2 lymphadenectomy is the first treatment choice for advanced disease and improves survival [2]. For patients with locally advanced incurable, recurrent, or metastatic GC, chemotherapy with platinum and fluoropyrimidine derivatives is the standard of care [3], but the five year survival rate is less than 5% [4]. Recently, agents targeting antigens expressed on tumor cells (cetuximab, trastuzumab) or in the tumor microenvironment (nivolumab, pembrolizumab, ramucirumab) have been evaluated in patients with GC, and the objective response rates (ORR) ranged between 3% and 11% [5–7]. Therefore, there is a dire need for the identification and characterization of novel molecules that can be exploited for targeted treatment.
An ideal target for antibody-mediated cancer immunotherapy should meet two criteria: positive expression with epitope accessibility in malignant tissue, and restricted or no expression and epitope inaccessibility in normal tissues. The tight junction protein Claudin 18 splicing isoform A2 (Claudin 18 A2) in the stomach has been identified as a promising target for the treatment of GC [8, 9]. The expression of this tetraspanin membrane protein is strictly confined to differentiated cells in gastric mucosa and is absent from stem cell zone of gastric glands. In addition, the membrane of a considerable number of GC cells express Claudin 18 A2 whose epitopes can be targeted by antibodies [8]. Therefore, a chimeric IgG1 monoclonal antibody zolbetuximab (IMAB362) that specifically binds to Claudin 18 A2 has been developed and is currently being tested in clinical trials with promising preliminary results [10, 11]. Different from other targeted therapies against molecules involving in classic signaling pathways, immune checkpoints or cell cycle, which were used to block or activate the function of targeted molecules, zolbetuximab was demonstrated to mediate cancer cell death through antibody-dependent cellular cytotoxicity (ADCC) and complement-dependent cytotoxicity (CDC). Responders in a Phase II study had 70% Claudin 18 A2-positive tumor cells, suggesting a correlation between Claudin 18 A2 expression and therapeutic benefit [11]. However, previous reports described a wide range of expression of Claudin 18 in patients with GC, but this may be due to the different monoclonal antibodies used for detection and various scoring algorithms used in those immunohistochemistry studies. Therefore, we conducted this bioinformatic analysis to determine the expression pattern of Claudin 18 in GC patients in multiple public databases.
Results
Differential mRNA expression of the CLDN family in GC
A total of 407 tissues (375 tumor tissues and 32 adjacent noncancerous tissues) from 381 patients in the Cancer Genome Atlas (TCGA) database based on our search strategies for stomach adenocarcinoma (STAD) (TCGA-STAD cohort) were used to identify the differentially expressed genes (DEGs) of the CLDN family. The mRNA expression of 24 CLDN family members were determined. The expression of CLDN8, CLDN17, CLDN22, CLDN24, CLDN25, and CLDN34 were extremely low and were excluded from analysis. Twelve CLDN genes were significantly dysregulated; of these, 10 were considered DEGs based on predefined cutoffs. The expression of CLDN1, CLDN2, CLDN6, CLDN9, and CLDN16 was upregulated, and CLDN5, CLDN11, CLDN15, CLDN18, and CLDN23 downregulated in GC. The log2FC (fold change) of CLDN18 was -1.52, and the P value and false discovery rate (FDR) were 4.38E-05 and 8.76E-05, respectively (Figure 1).
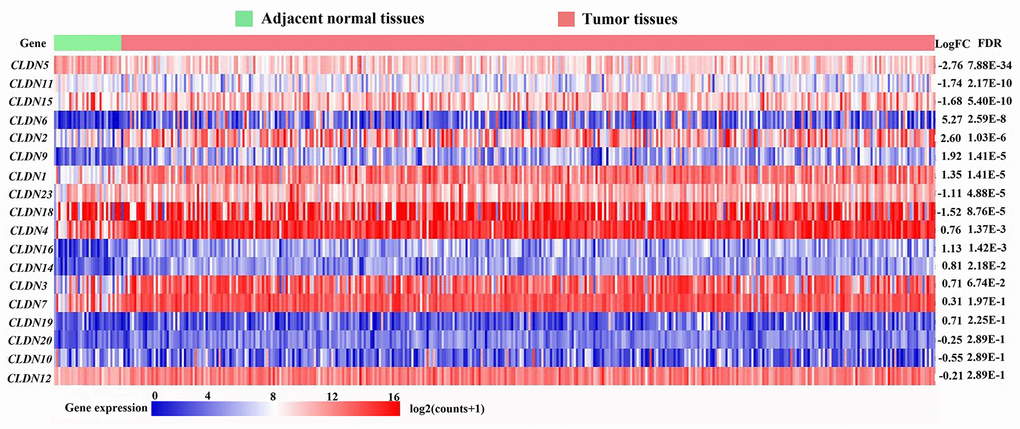
Figure 1. Heatmap of transcriptional profiles of the CLDN family in tumor and adjacent normal tissues from the TCGA-STAD database. FC, fold change; FDR, false discovery rate.
The mRNA expression of CLDN18 in various cancers and corresponding normal tissues
In the Oncomine database, CLDN18 mRNA expression differences were reported in a total of 406 unique analyses, among which 33 were significant (P< 0.05). CLDN18 expression was downregulated in GC, lung cancer, and sarcoma (gastric stromal tumor) compared to their normal counterparts, whereas upregulation was found in esophageal, pancreatic, and prostate cancer. Six of 20 analyses from six datasets reported downregulated CLDN18 mRNA expression in GC tissues, while no analysis reported upregulated CLDN18 mRNA expression (Figure 2A). The results in Gene Expression Profiling Interactive Analysis 2 (GEPIA2) showed that CLDN18 was strictly expressed in gastric and pulmonary tissues but downregulated in corresponding cancer tissues, although the level was still high in GC compared with other cancers (Figure 2B). In contrast, ectopic overexpression of CLDN18 was observed in pancreatic cancer.
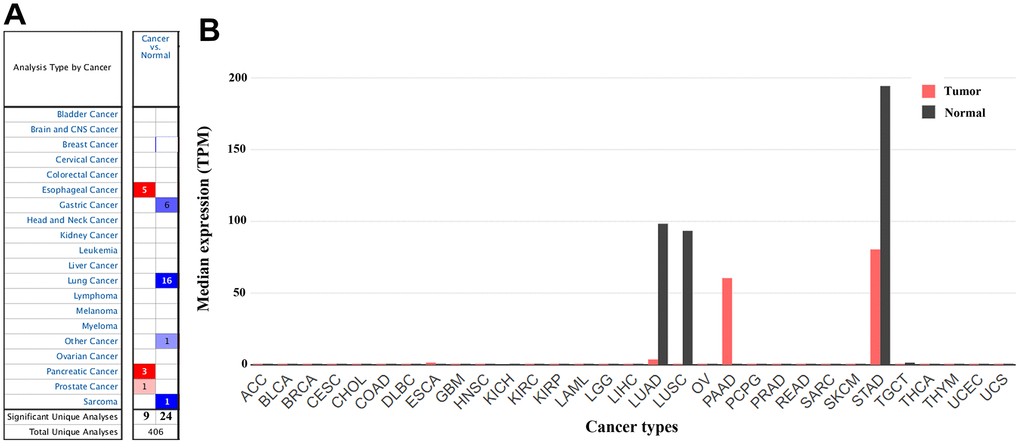
Figure 2. The gene expression profiles of CLDN18 across all tumor samples. (A) mRNA expression levels of CLDN18 in various types of cancer from the Oncomine database. The cell number represents the number of datasets that met the thresholds. The color intensity is proportional to the significance of dysregulation. (B) The gene expression profiles of CLDN18 across all tumor samples and paired normal tissues in the GEPIA2 database. The height of the bar represents the median expression level. TPM, transcripts per kilobase of exon per million mapped reads.
Transcription levels of CLDN18 isoforms
Analysis using GEPIA2 showed that CLDN18-001 (ENST00000343735.8), which encodes isoform 2, also known as isoform A2, was mostly expressed in normal gastric and GC tissues. CLDN18-001 expression was downregulated in GC compared to normal tissues (Figure 3A). The expression of CLDN18-002 (ENST00000183605.9), which encodes isoform 1, also known as isoform A1, was restricted to pulmonary normal tissues and was downregulated in lung cancer tissues (Figure 3B). The ectopic expression in pancreatic cancer tissues was mainly CLDN18-001 (Figure 3A). In GC tissues, the transcript levels of CLDN18-001 were higher than those of CLDN18-002 and CLDN18-003, the latter being a nonsense mediated decay transcript (Figure 3C).
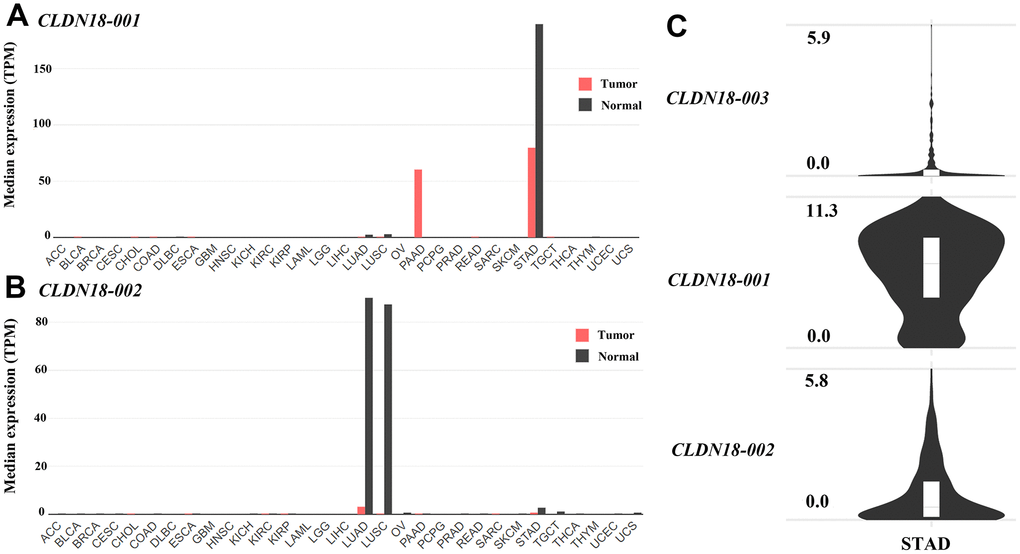
Figure 3. Transcript levels of isoforms of CLDN18 in the GEPIA2 database. (A) The transcript levels of CLDN18-001 across all tumor samples and paired normal tissues. (B) The transcript levels of CLDN18-002 across all tumor samples and paired normal tissues. (C) The transcript levels of three isoforms of CLDN18 in GC tissues. The height of the bars of (A, B) represents the median expression levels transformed by TPM. The Y axis of (C) represents the expression level transformed by log2(counts+1). TPM, transcripts per kilobase of exon per million mapped reads.
The expression changes of CLDN18 in precancerous tissues of the stomach
There are three probes in the GSE78523 dataset designed to detect CLDN18-001 mRNA expression. The median expression was decreased in intestinal metaplasia compared to normal gastric tissues (Figure 4A). In the GSE55696 dataset, CLDN18 expression was decreased in low grade intraepithelial neoplasia (LGIN), high grade intraepithelial neoplasia (HGIN), and early gastric cancer (EGC) tissues compared to chronic gastritis tissues. No difference was found between LGIN, HGIN, and EGC (Figure 4B).
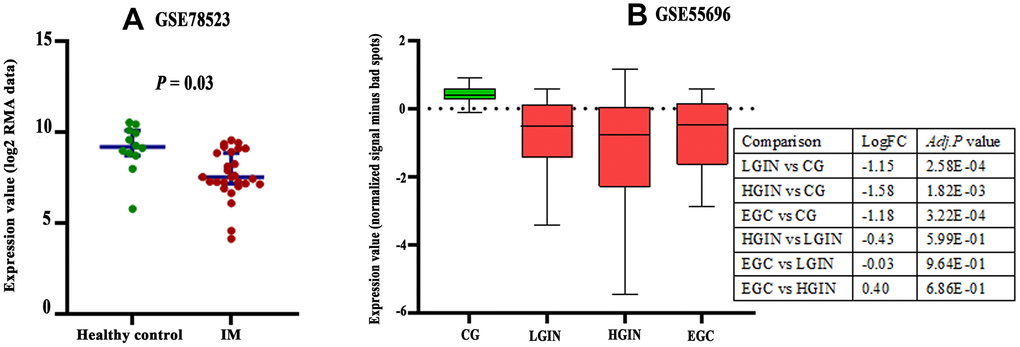
Figure 4. Expression changes of CLDN18 in precancerous tissues of the stomach. (A) The difference in CLDN18 expression between intestinal metaplasia (IM) and healthy controls. (B) The difference in CLDN18 expression among chronic gastritis (CG), low grade intraepithelial neoplasia (LGIN), high grade intraepithelial neoplasia (HGIN), and early gastric cancer (EGC). FC, fold change.
Correlation between CLDN18 expression and clinicopathological characteristics
We compared clinicopathological characteristics between CLDN18-high and CLDN18-low groups, with the median expression as cutoff, in the TCGA-STAD cohort. There was no relationship between CLDN18 expression and age, sex, race, ethnicity, T stage, node metastasis, TNM stage, histological type, or tumor location (Table 1). CLDN18 expression differences were significant in certain molecular classifications. CLDN18 expression was higher in the microsatellite stable/p53 positive (MSS/TP53+) and negative (MSS/TP53-) subgroups versus others using the Asian Cancer Research Group (ACRG) classifications (Figure 5A) and in the EBV-positive subgroup versus others using the TCGA classifications (Figure 5B).
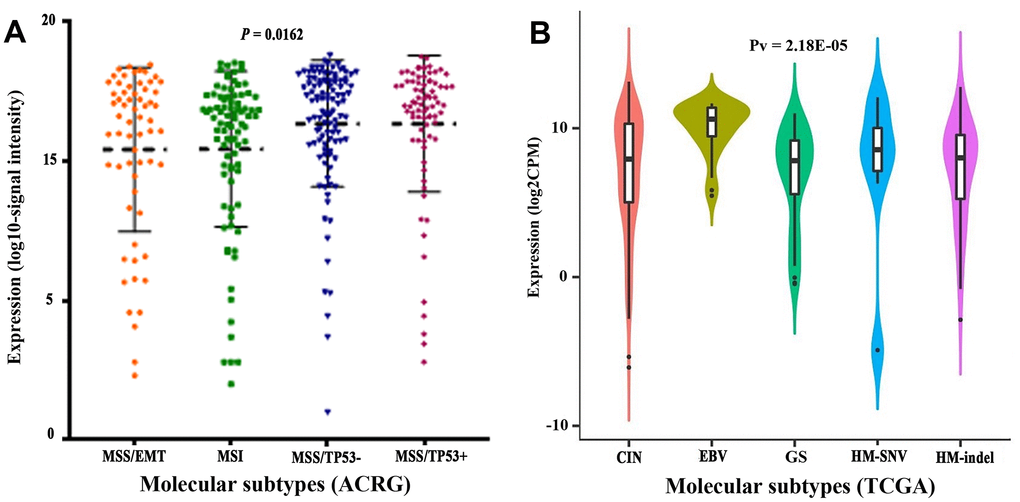
Figure 5. Transcript levels of CLDN18 among molecular subtypes. (A) Molecular subtypes of GC according to the Asian Cancer Research Group (ACRG). (B) Molecular subtypes of GC according to the Cancer Genome Atlas (TCGA). EMT, epithelial-mesenchymal transition; MSI, microsatellite instability; MSS, microsatellite stable; TP53, tumor protein p53; CIN, chromosomal instability; EBV, Epstein-Barr virus; GS, genomically stable; HM, high mutation; SNV, single nucleotide variants.
Table 1. Characteristics of GC patients of CLDN18-low and CLDN18-high groups in TCGA-STAD.
| Clinicopathological characteristics | CLDN18-low (n=187) | CLDN18-high (n=188) | χ2 | P value | |||||||||||||||||||||||||||||||||||||||||||||||||||||||||||||||||||||||||||||||||||||||||||||||
| Age (years) | 0.497 | 0.481 | |||||||||||||||||||||||||||||||||||||||||||||||||||||||||||||||||||||||||||||||||||||||||||||||||
| <60 | 61 | 55 | |||||||||||||||||||||||||||||||||||||||||||||||||||||||||||||||||||||||||||||||||||||||||||||||||
| ≥60 | 126 | 133 | |||||||||||||||||||||||||||||||||||||||||||||||||||||||||||||||||||||||||||||||||||||||||||||||||
| Sex | 3.107 | 0.078 | |||||||||||||||||||||||||||||||||||||||||||||||||||||||||||||||||||||||||||||||||||||||||||||||||
| Male | 112 | 129 | |||||||||||||||||||||||||||||||||||||||||||||||||||||||||||||||||||||||||||||||||||||||||||||||||
| Female | 75 | 59 | |||||||||||||||||||||||||||||||||||||||||||||||||||||||||||||||||||||||||||||||||||||||||||||||||
| Race | 0.895 | 0.639 | |||||||||||||||||||||||||||||||||||||||||||||||||||||||||||||||||||||||||||||||||||||||||||||||||
| Asian | 41 | 33 | |||||||||||||||||||||||||||||||||||||||||||||||||||||||||||||||||||||||||||||||||||||||||||||||||
| Black | 5 | 6 | |||||||||||||||||||||||||||||||||||||||||||||||||||||||||||||||||||||||||||||||||||||||||||||||||
| White | 118 | 120 | |||||||||||||||||||||||||||||||||||||||||||||||||||||||||||||||||||||||||||||||||||||||||||||||||
| T stage | 0.148 | 0.701 | |||||||||||||||||||||||||||||||||||||||||||||||||||||||||||||||||||||||||||||||||||||||||||||||||
| T1+ T2 | 48 | 51 | |||||||||||||||||||||||||||||||||||||||||||||||||||||||||||||||||||||||||||||||||||||||||||||||||
| T3+ T4 | 136 | 132 | |||||||||||||||||||||||||||||||||||||||||||||||||||||||||||||||||||||||||||||||||||||||||||||||||
| Node metastasis | 1.290 | 0.256 | |||||||||||||||||||||||||||||||||||||||||||||||||||||||||||||||||||||||||||||||||||||||||||||||||
| Negative | 60 | 51 | |||||||||||||||||||||||||||||||||||||||||||||||||||||||||||||||||||||||||||||||||||||||||||||||||
| Positive | 117 | 129 | |||||||||||||||||||||||||||||||||||||||||||||||||||||||||||||||||||||||||||||||||||||||||||||||||
| TNM stage | 0.010 | 0.921 | |||||||||||||||||||||||||||||||||||||||||||||||||||||||||||||||||||||||||||||||||||||||||||||||||
| I+II | 82 | 82 | |||||||||||||||||||||||||||||||||||||||||||||||||||||||||||||||||||||||||||||||||||||||||||||||||
| III+IV | 95 | 93 | |||||||||||||||||||||||||||||||||||||||||||||||||||||||||||||||||||||||||||||||||||||||||||||||||
| Histological type | 5.329 | 0.502 | |||||||||||||||||||||||||||||||||||||||||||||||||||||||||||||||||||||||||||||||||||||||||||||||||
| Adenocarcinoma, intestinal type | 30 | 44 | |||||||||||||||||||||||||||||||||||||||||||||||||||||||||||||||||||||||||||||||||||||||||||||||||
| Carcinoma, diffuse type | 31 | 30 | |||||||||||||||||||||||||||||||||||||||||||||||||||||||||||||||||||||||||||||||||||||||||||||||||
| Adenocarcinoma, NOS | 69 | 68 | |||||||||||||||||||||||||||||||||||||||||||||||||||||||||||||||||||||||||||||||||||||||||||||||||
| Mucinous adenocarcinoma | 11 | 8 | |||||||||||||||||||||||||||||||||||||||||||||||||||||||||||||||||||||||||||||||||||||||||||||||||
| Papillary adenocarcinoma, NOS | 4 | 1 | |||||||||||||||||||||||||||||||||||||||||||||||||||||||||||||||||||||||||||||||||||||||||||||||||
| Signet ring cell carcinoma | 7 | 5 | |||||||||||||||||||||||||||||||||||||||||||||||||||||||||||||||||||||||||||||||||||||||||||||||||
| Tubular adenocarcinoma | 34 | 32 | |||||||||||||||||||||||||||||||||||||||||||||||||||||||||||||||||||||||||||||||||||||||||||||||||
| Tumor location | 1.672 | 0.433 | |||||||||||||||||||||||||||||||||||||||||||||||||||||||||||||||||||||||||||||||||||||||||||||||||
| Cardia and fundus | 62 | 71 | |||||||||||||||||||||||||||||||||||||||||||||||||||||||||||||||||||||||||||||||||||||||||||||||||
| Body | 43 | 47 | |||||||||||||||||||||||||||||||||||||||||||||||||||||||||||||||||||||||||||||||||||||||||||||||||
| Antrum and pylorus | 73 | 62 | |||||||||||||||||||||||||||||||||||||||||||||||||||||||||||||||||||||||||||||||||||||||||||||||||
| NOS: not otherwise specified. | |||||||||||||||||||||||||||||||||||||||||||||||||||||||||||||||||||||||||||||||||||||||||||||||||||
CLDN18 protein expression by immunohistochemistry
Three antibodies were used to detect Claudin 18. Antibody HPA018446 detects isoforms A2 and A1. The isoforms detected by antibodies CAB13010 and CAB013243 are not known. Expression was only detected in gastric glandular cells in normal tissues (Figure 6A) but was detected in many cancer types, with high expression in gastric, pancreatic, lung, and ovarian cancer tissues (Figure 6B). In GC tissues, Claudin 18 was detected in the cytoplasm and on the membrane. Rates of Claudin 18 expression in published studies are summarized in Table 2.
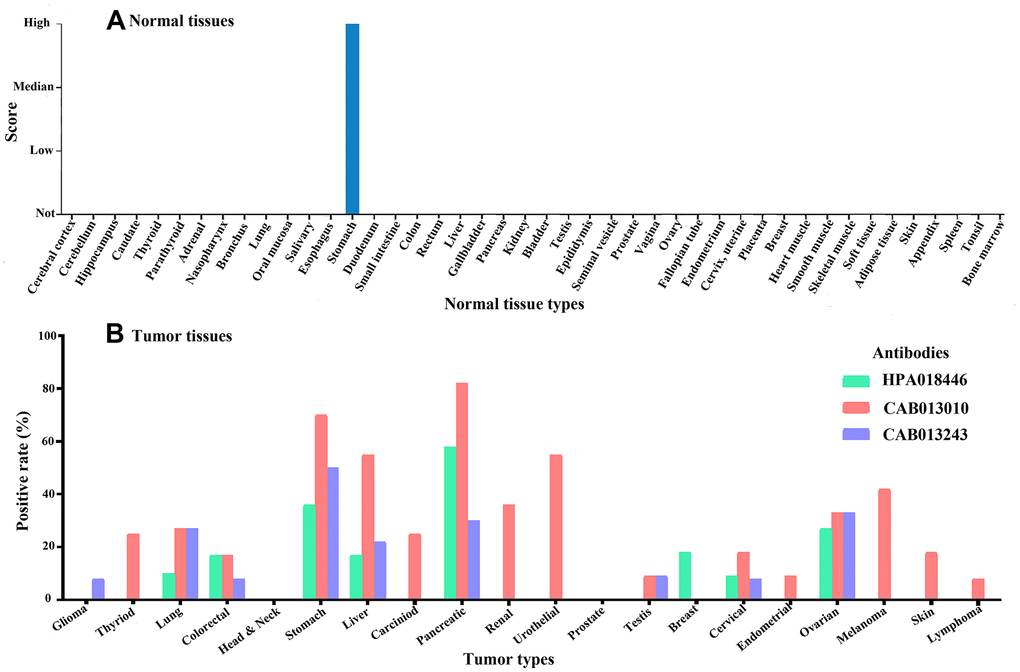
Figure 6. The expression of Claudin 18 in normal (A) and tumor (B) tissues.
Table 2. Summaries of the positive rates of Claudin 18 in gastric cancer.
| Author or dataset | Antibody | Samples | Positive rate (%) |
| HPA [12] | HPA018446 | 11 | 18.2 |
| HPA [12] | CAB013010 | 10 | 30.0 |
| HPA [12] | CAB013243 | 12 | 33.3 |
| MONO study [11] | Polyclonal | 268 | 31.0 |
| Coati I [13] | clone 34H14L15 | 523 | 68.8 |
| Rohde C [14] | clone 43-14A | 262 | 52.0 |
| Dottermusch M [15] | clone EPR19202 | 474 | 42.2 |
Analysis of CLDN18 genetic alterations
Genetic alterations of CLDN18 in different cancers were examined using the TCGA PanCan Atlas studies. Gene amplification mainly occurred in lung squamous cell, cervical, esophageal, head & neck, and ovarian cancer. Mutation predominated in uterine cancer, and gene fusion in stomach cancer (Figure 7A). cBioPortal has seven archived datasets of genetic alterations in human GC; four datasets were excluded due to overlapping original samples. A total of 618 cases of GC from three datasets were included for analysis. Four percent (23/618) of patients were found to have gene alterations: 12 fusions, seven amplifications, one truncating mutation, and three missense mutations (Figure 7B–7D). The main genetic alteration was CLDN18-ARHGAP26 fusion (9/23). CLDN18 alterations in GC patients from the TCGA PanCan Atlas data is shown in Figure 7E, 7F.
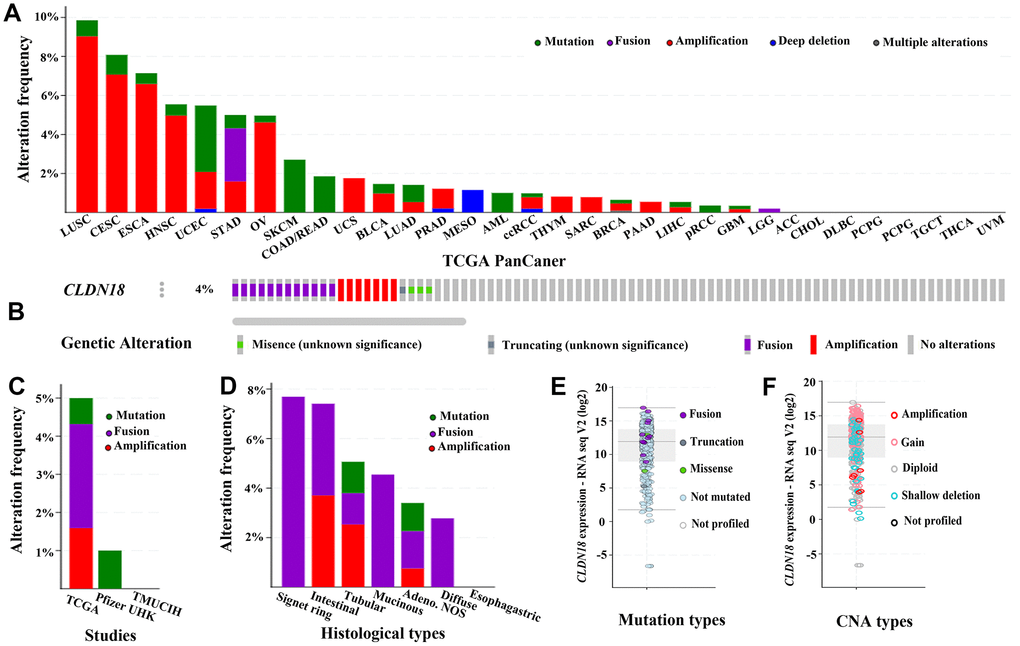
Figure 7. The genetic alterations of CLDN18 in cancers. (A) Frequency of genetic alterations in various types of cancer derived from TCGA PanCan datasets. (B) OncoPrint visual summary of variations on a query of CLDN18. (C) Analyses of genetic variations of CLDN18 reported in different studies. (D) Analyses of genetic variations of CLDN18 reported in different histological types. (E) The mRNA expression of mutated CLDN18. (F) The mRNA expression of CLDN18 with copy number alterations (CNA).
Biological interaction network of CLDN18
The results of GeneMANIA showed that CLDN18 could share protein domains, physically interact with CLDN family members CLDN10 and CLDN19, colocalize with 11 proteins, and coexpress with 19 proteins (Figure 8). The top five genes displaying the greatest correlations with CLDN18 included CLDN10, CLDN19, PATJ (crumbs cell polarity complex component), TJP1 (tight junction protein 1), and TJP3 (tight junction protein 3). Further functional analysis revealed that these genes are mainly involved in “cell-cell junction assembly”, especially “tight junction” (FDR: 2.95E-7).
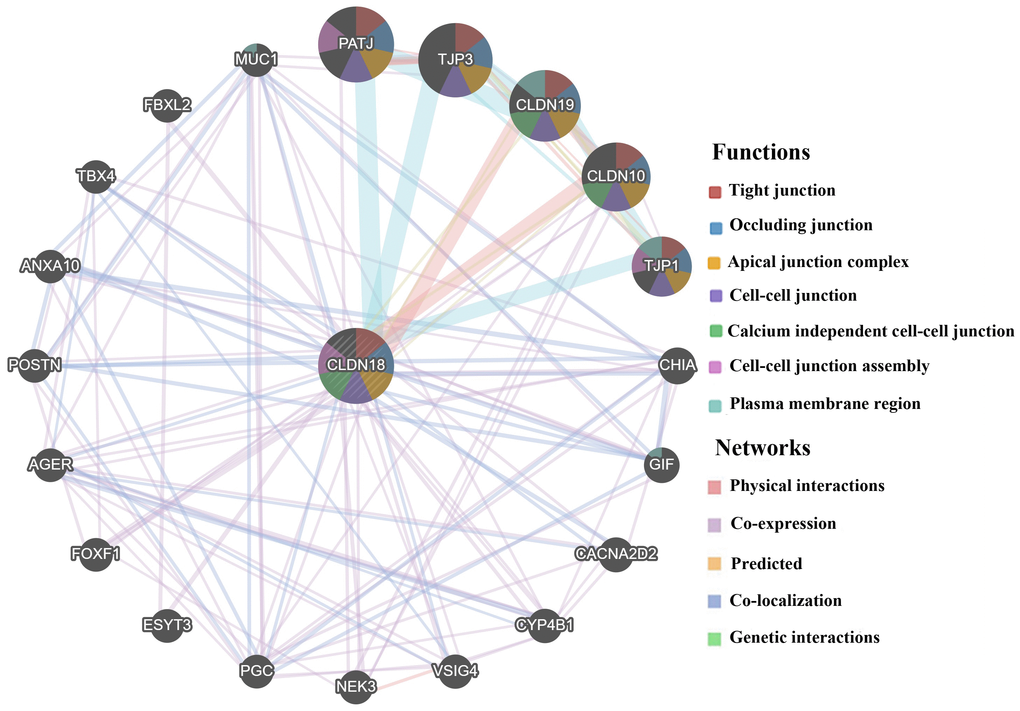
Figure 8. Biological interaction network of CLDN18 analyzed using GeneMANIA.
The prognostic value of CLDN18 expression
There were 337 and 431 patients with eligible survival data in the TCGA-STAD and GSE84437 datasets, respectively. mRNA values in GSE84437 were detected for CLDN18-001. Six datasets with a total of 1051 patients (GSE14210: N=146; GSE15459: N=200; GSE22377: N=43; GSE29272: N=268; GSE52205: N=94; GSE62254: N=300) were used for Kaplan-Meier survival curves. Four probes were used to test the mRNA expression in the six datasets; two were specific for CLDN18-002 (221132_at, 221133_s_at), while the other two probes (232578_at, 214135_at) were not isoform-specific. All analyses showed that the expression of CLDN18 is not related to the overall survival of GC patients (Figure 9).

Figure 9. Overall survival of GC patients grouped by CLDN18 median cutoff into high and low groups. (A) TCGA-STAD; (B) GSE84437; (C–F) KM-plotter, data from six datasets: GSE14210, GSE15459, GSE22377, GSE29272, GSE52205, GSE62254.
Discussion
Claudin 18 is a member of a family of at least 27 transmembrane proteins. These proteins are mainly in apical regions forming tight-junction complexes, playing a critical role in cell-cell adhesion, maintenance of cell polarity, and selective paracellular permeability [16–18]. It has two isoforms, which are specific tight junction components of pulmonary and gastric tissues. This was confirmed by GEPIA2 and HPA analysis.
In mouse models, Claudin 18 loss increased H+ leakage, inflammatory cell infiltration, and gastric metaplasia [19], resulting in intraepithelial neoplasia and invasive tumors [20]. In human studies, CLDN18 is downregulated in a subset of GCs [21–23]. These findings suggest that Claudin 18 loss induces gastritis and creates an inflammatory setting for dysplasia and/or cancer. Additionally, loss of Claudin 18 can lead to activation or translocation of some kinases in several pro-oncogenic pathways [24]. These findings lead to important questions regarding the role of Claudin 18 in GC.
Although Claudin 18 loss may be involved in the carcinogenesis of GC, it was retained in some cancer tissues, but with a range of expression across studies (Table 2). Those studies were performed with different antibodies with different sensitivities/specificities, and the results assessed by different scoring systems. This supports the need for testing and scoring standardization. No relationship between CLDN18 expression and clinicopathological characteristics in the TCGA-STAD cohort was found. This was consistent with Dottermusch et al. [15] but somewhat different from other studies. Coati I et al. found that tumors localized in the gastric corpus and tumors of the diffuse type showed a higher positive rate of Claudin 18 [13]. Claudin 18 A2 expression was also found to be significantly higher in GCs of the diffuse subtype and high grade (G3) in Japanese patients [14]. This may be due to GC heterogeneity, patient ethnicity, and detection methods between the studies.
A relationship between CLDN18 expression and molecular classification was found in this study. CLDN18 expression was higher in the EBV-positive subgroup by TCGA classification and in the MSS subgroups by ACRG classification. Because infection with EBV was more frequent in the MSS/TP53+ group, this suggests EBV infection increases CLDN18 expression. This increase is consistent with three immunohistochemistry studies [13, 15, 25]. EBV-associated GC is a unique etiological entity. Increased Claudin 18 A2 may be a key features of EBV-mediated carcinogenesis. EBV infection of epithelial cells is mediated by cell-to-cell contact, and extensive cell junctions may restrict antibody accessibility to the virus [26, 27]. This suggests a role of Claudin 18 in ensuring EBV maintenance in tumor cells.
Although genetic alteration of CLDN18 was infrequent in GC, interchromosomal translocation between CLDN18 and ARHGAP26 was found in genomically stable tumors by TCGA classification category. Fusion events were enriched in signet-ring cells, mucinous cells, and diffuse-type GC. ARHGAP26 is a GTPase-activating protein (GAP) that induces cellular motility [28]. The fusion conserves the RHO GTPase activating domain of ARHGAP26 but deletes the C-terminal PDZ-binding motif of Claudin 18 which allows Claudin 18 to bind the actin cytoskeleton. Consistent with the fusion protein overexpression [29], mRNA expression of the fusion gene was higher than the median expression of CLDN18 in patients of the TCGA PanCan cohort. The fusion-positive cancer cells stained diffusely positive for Claudin 18 in addition to membrane staining, suggesting that localization was altered [24]. The contribution of these changes to carcinogenesis remains to be determined.
Matsuda Y et al. reported worse malignancy grades and survival outcomes in GC patients with no expression of Claudin 18 [30]. Two studies with small samples sizes also suggested that reduced Claudin 18 A2 expression correlated with poor prognosis [22, 31]. In contrast, we found no correlation between CLDN18 expression and survival. This was consistent with the results of a large Caucasian cohort study [15].
Conclusions
In normal tissues, CLDN18 mRNA expression was restricted to the lung and stomach. Although expression was downregulated, it was retained in some GC tissues. Aberrant activation was found in esophageal, pancreatic, ovarian, biliary, and lung adenocarcinomas. Therefore, Claudin 18 may be a candidate biomarker and therapeutic target for these tumors. Divergence in CLDN18 expression rates across studies may be related to ethnic characteristics or linked to intratumoral GC heterogeneity, which poses a challenge for diagnostic evaluations and targeted therapy. In-depth experiments and well-defined detection approaches are needed to investigate the molecular mechanism, to develop targeted agents, and to screen for patients suited for treatment.
Materials and Methods
Gene expression data from TCGA and differential expression analysis
The gene expression levels of the CLDN family were obtained from the TCGA data portal (https://portal.gdc.cancer.gov/; accessed January 05, 2020) [28]. Relevant search parameters were used as follows: data category: transcriptome profiling; data type: gene expression quantification; experimental strategy: RNA-Seq; workflow type: HTSeq-counts; and project: TCGA-STAD. Differential expression analysis was conducted between tumor and adjacent normal tissues using the R language package EdgeR [32]. To ensure that the expression distributions of each sample were similar across the entire matrix, gene expression levels were normalized by the calcNormFactors function [33]. Log2FC, associated adj. P values, and FDRs were calculated. DEGs of the CLDN family were identified by using the settings |log2FC| > 1 and adj. P<0.05 was used as the cutoffs. We used the log2(counts+1) transformation to convert the expression levels of CLDNs for further analysis.
Analysis of CLDN18 mRNA expression in different cancers and normal tissues
Analysis of CLDN18 mRNA expression in different cancers and normal tissues was carried out using Oncomine (https://www.oncomine.org/resource/main.html) [34] and GEPIA2 (http://gepia2.cancer-pku.cn/index.html) [35]. The thresholds for analysis in the Oncomine database were as follows: P value: 0.05; FC: 2; gene ranking: 10%; analysis type: cancer vs. normal; and data type: mRNA. The online database GEPIA2 is an interactive web-based tool that includes normal and tumor samples from the Genotype-Tissue Expression (GTEx) projects and TCGA for analyzing RNA sequencing expression data. The database was used to confirm the expression of CLDN18 in different cancer and normal tissues. The expression of isoforms of CLDN18 was also determined using GEPIA2. Bar plots were generated to visualize the relationship.
Changes in the expression of CLDN18 in precancerous stomach tissues
Gene Expression Omnibus (GEO) (https://www.ncbi.nlm.nih.gov/geo/) is a worldwide data repository that distributes gene expression data, including microarray, next-generation sequencing, and other forms of high-throughput functional genomics data. The terms “gastric or stomach” and “cancer” or “tumor” or “carcinoma” or “neoplasm” were used as the search parameters in the GEO database. “Homo sapiens” was used to limit the search range. The processed expression data of CLDN18 were obtained from GSE78523, which includes 30 intestinal metaplasia and 15 adjacent normal gastric tissues [36], and GSE55696, which includes 19 LGIN, 20 HGIN, 19 EGC, and 19 chronic gastritis tissue samples [37]. The differential expression of CLDN18 was analyzed with GEO2R. When more than one probe was available, the median value was used.
Correlation between CLDN18 expression and clinicopathological characteristics
The currently available clinical data of the patients included in this study were downloaded from TCGA, and the correlation between CLDN18 expression and clinicopathological characteristics was analyzed. The expression difference among molecular subtypes based on ACRG was analyzed using data downloaded from GENT2 (http://gent2.appex.kr/gent2/) [38]. The expression difference among molecular subtypes based on TCGA was analyzed by TISIDB (http://cis.hku.hk/TISIDB) [39].
Protein expression of CLDN18 by immunohistochemistry
The Human Protein Atlas (HPA) (https://www.proteinatlas.org) website containing immunohistochemistry data from tissue microarray-based analyses of major cancer tissue types and normal tissues was used [12]. Moderate and strong intensity of staining was considered positive. The positive rates of Claudin 18 in GC from the HPA were summarized together with data from articles available on PubMed [11, 13–15].
Identification of genetic alterations of CLDN18 in GC
The cBioPortal (https://www.cbioportal.org/) website of cancer genomics datasets was used [40]. Mutations and copy number alterations (CNAs) of CLDN18 in GC were analyzed using the cBioPortal tool. The OncoPrint sub-tool was utilized to display an overview of the integrated status of genetic alterations for CLDN18. The Cancer Types Summary sub-tool showed the details of genetic alterations in different datasets and in different histological types.
Identifying the CLDN18 biological network
GeneMANIA (http://genemania.org/), a web interface, was used to construct a biological network for CLDN18 in terms of physical interaction, coexpression, colocalization, prediction, and shared protein domains, and evaluate the functions of network components [41]. A figure where nodes symbolize genes and links represent networks was used to display interactions.
The prognostic value of CLDN18
The prognostic value of CLDN18 expression was determined in the TCGA-STAD cohort and the GSE84437 dataset, which has the largest number of GC patients in GEO. Patients with a follow-up or survival time of less than 1 month were excluded. The Kaplan-Meier plotter online database (http://kmplot.com) was used to validate the relationship between CLDN18 expression and overall survival (OS) in GC patients [42]. The median value of mRNA expression was used as the cutoff to divide patients into high and low expression groups. Hazard ratios (HRs) with 95% confidence intervals (CIs) and log-rank P values were calculated. A P value <0.05 was considered statistically significant.
Statistical analysis
Online analyses were conducted following the statistical methods used by individual bioinformatic websites, and the corresponding parameters described above. Categorical variable numbers (n) are presented. Significant differences among groups were determined using the Pearson χ2 test and Mann-Whitney’s U test. The DEG analysis was conducted by R software 3.6.2 (https://www.r-project.org/). Other statistical analyses were performed using IBM SPSS Statistics version 22.0 (IBM Co., Armonk, NY, USA). The graphs, survival curves, and log-rank tests were completed in GraphPad Prism 8.0 (GraphPad Software, San Diego, CA, USA). For all analyses, a two-sided significance level of 0.05 was assumed.
Ethical statement
This study was approved by the Academic Committee of the Third Hospital of Mianyang and conducted according to the principles expressed in the Declaration of Helsinki. All information in this study was retrieved from public datasets; therefore, written informed consent was not necessary. This study meets the publication guidelines provided by the individual public datasets.
Abbreviations
ACC: adrenocortical carcinoma; ACRG: Asian Cancer Research Group; ADCC: antibody-dependent cellular cytotoxicity; BLCA: bladder urothelial carcinoma; BRCA: breast invasive carcinoma; CDC: complement-dependent cytotoxicity; CIs: confidence intervals; CESC: cervical and endocervical cancer; CG: chronic gastritis; CHOL: cholangiocarcinoma; CIN: chromosomal instability; CNAs: copy number alterations; CLDN: claudin; COAD: olon adenocarcinoma; DEGs: differentially expressed genes; DLBC: diffuse large b-cell lymphoma; EBV: Epstein-Barr virus-positive; EGC: early gastric cancer; EMT: epithelial-mesenchymal transition; ESCA: esophageal carcinoma; FC: fold change; FDRs: false discovery rates; GAP: GTPase-activating protein; GBM: glioblastoma multiforme; GC: gastric cancer; GEO: Gene Expression Omnibus; GEPIA2: Gene Expression Profiling Interactive Analysis 2; GS: genomically stable; GTEx: Genotype-Tissue Expression; HGIN: high grade intraepithelial neoplasia; HM: high mutation; HNSC: head and neck cancer; HPA: The Human Protein Atlas; HRs: hazard ratios; IM: intestinal metaplasia; KICH: kidney chromophobe; KIRC: kidney renal clear cell carcinoma; KIRP: kidney renal papillary cell carcinoma; LGG: lower grade glioma; LGIN: low grade intraepithelial neoplasia; MSI: microsatellite instability; MSS: microsatellite stable; LIHC: liver hepatocellular carcinoma; LUAD: lung adenocarcinoma; LUSC: lung squamous cell carcinoma; MESO: mesothelioma; MSS: microsatellite stable; ORR: objective response rate; OS: overall survival; OV: ovarian serous cystadenocarcinoma; PAAD: pancreatic adenocarcinoma; PATJ: crumbs cell polarity complex component; PCPG: pheochromocytoma and paraganglioma; PPI: protein-protein interaction; PRAD: prostate adenocarcinoma; READ: rectum adenocarcinoma; SARC: sarcoma; SKCM: skin cutaneous melanoma; SNV: single nucleotide variants; TGCT: testicular germ cell tumors; STAD: stomach adenocarcinoma; TCGA: theCancer Genome Atlas; THCA: thyroid carcinoma; THYM: thymoma; TJP: tight junction protein 1; TPM: transcripts per kilobase of exon per million mapped reads; UCEC: uterine corpus endometrial carcinoma; UCS: uterine carcinosarcoma; UVM: uveal melanoma.
Author Contributions
The study was conceived by Jian Li and Run Xu. Data analysis and figure preparation were conducted by Yao Zhang and Deng-Min Hu. The statistical analysis was performed by Jian Li, Tu-Ping Gong. Jian Li and Jun Gao wrote the paper and all authors provided critical contributions to the write-up and approved submission.
Conflicts of Interest
The authors declare they have no conflicts of interest.
Funding
This study was supported by Scientific Research Projects of Health Commission of Mianyang City (201814).
References
- 1. Bray F, Ferlay J, Soerjomataram I, Siegel RL, Torre LA, Jemal A. Global cancer statistics 2018: GLOBOCAN estimates of incidence and mortality worldwide for 36 cancers in 185 countries. CA Cancer J Clin. 2018; 68:394–424. https://doi.org/10.3322/caac.21492 [PubMed]
- 2. Markar SR, Karthikesalingam A, Jackson D, Hanna GB. Long-term survival after gastrectomy for cancer in randomized, controlled oncological trials: comparison between west and east. Ann Surg Oncol. 2013; 20:2328–38. https://doi.org/10.1245/s10434-012-2862-9 [PubMed]
- 3. Bozkurt M, Amlashi FG, Blum Murphy M. The role of chemotherapy in unresectable or metastatic adenocarcinoma of the stomach and gastroesophageal junction. Minerva Chir. 2017; 72:317–33. https://doi.org/10.23736/S0026-4733.17.07357-6 [PubMed]
- 4. Lasithiotakis K, Antoniou SA, Antoniou GA, Kaklamanos I, Zoras O. Gastrectomy for stage IV gastric cancer. A systematic review and meta-analysis. Anticancer Res. 2014; 34:2079–85. [PubMed]
- 5. Fuchs CS, Tomasek J, Yong CJ, Dumitru F, Passalacqua R, Goswami C, Safran H, Dos Santos LV, Aprile G, Ferry DR, Melichar B, Tehfe M, Topuzov E, et al, and REGARD Trial Investigators. Ramucirumab monotherapy for previously treated advanced gastric or gastro-oesophageal junction adenocarcinoma (REGARD): an international, randomised, multicentre, placebo-controlled, phase 3 trial. Lancet. 2014; 383:31–39. https://doi.org/10.1016/S0140-6736(13)61719-5 [PubMed]
- 6. Chan JA, Blaszkowsky LS, Enzinger PC, Ryan DP, Abrams TA, Zhu AX, Temel JS, Schrag D, Bhargava P, Meyerhardt JA, Wolpin BM, Fidias P, Zheng H, et al. A multicenter phase II trial of single-agent cetuximab in advanced esophageal and gastric adenocarcinoma. Ann Oncol. 2011; 22:1367–73. https://doi.org/10.1093/annonc/mdq604 [PubMed]
- 7. Kang YK, Boku N, Satoh T, Ryu MH, Chao Y, Kato K, Chung HC, Chen JS, Muro K, Kang WK, Yeh KH, Yoshikawa T, Oh SC, et al. Nivolumab in patients with advanced gastric or gastro-oesophageal junction cancer refractory to, or intolerant of, at least two previous chemotherapy regimens (ONO-4538-12, ATTRACTION-2): a randomised, double-blind, placebo-controlled, phase 3 trial. Lancet. 2017; 390:2461–2471. https://doi.org/10.1016/S0140-6736(17)31827-5 [PubMed]
- 8. Sahin U, Koslowski M, Dhaene K, Usener D, Brandenburg G, Seitz G, Huber C, Türeci O. Claudin-18 splice variant 2 is a pan-cancer target suitable for therapeutic antibody development. Clin Cancer Res. 2008; 14:7624–34. https://doi.org/10.1158/1078-0432.CCR-08-1547 [PubMed]
- 9. Niimi T, Nagashima K, Ward JM, Minoo P, Zimonjic DB, Popescu NC, Kimura S. Claudin-18, a novel downstream target gene for the T/EBP/NKX2.1 homeodomain transcription factor, encodes lung- and stomach-specific isoforms through alternative splicing. Mol Cell Biol. 2001; 21:7380–90. https://doi.org/10.1128/MCB.21.21.7380-7390.2001 [PubMed]
- 10. Sahin U, Schuler M, Richly H, Bauer S, Krilova A, Dechow T, Jerling M, Utsch M, Rohde C, Dhaene K, Huber C, Türeci Ö. A phase I dose-escalation study of IMAB362 (zolbetuximab) in patients with advanced gastric and gastro-oesophageal junction cancer. Eur J Cancer. 2018; 100:17–26. https://doi.org/10.1016/j.ejca.2018.05.007 [PubMed]
- 11. Türeci O, Sahin U, Schulze-Bergkamen H, Zvirbule Z, Lordick F, Koeberle D, Thuss-Patience P, Ettrich T, Arnold D, Bassermann F, Al-Batran SE, Wiechen K, Dhaene K, et al. A multicentre, phase IIa study of zolbetuximab as a single agent in patients with recurrent or refractory advanced adenocarcinoma of the stomach or lower oesophagus: the MONO study. Ann Oncol. 2019; 30:1487–1495. https://doi.org/10.1093/annonc/mdz199 [PubMed]
- 12. Asplund A, Edqvist PH, Schwenk JM, Pontén F. Antibodies for profiling the human proteome-the human protein atlas as a resource for cancer research. Proteomics. 2012; 12:2067–77. https://doi.org/10.1002/pmic.201100504 [PubMed]
- 13. Coati I, Lotz G, Fanelli GN, Brignola S, Lanza C, Cappellesso R, Pellino A, Pucciarelli S, Spolverato G, Guzzardo V, Munari G, Zaninotto G, Scarpa M, et al. Claudin-18 expression in oesophagogastric adenocarcinomas: a tissue microarray study of 523 molecularly profiled cases. Br J Cancer. 2019; 121:257–63. https://doi.org/10.1038/s41416-019-0508-4 [PubMed]
- 14. Rohde C, Yamaguchi R, Mukhina S, Sahin U, Itoh K, Türeci Ö. Comparison of claudin 18.2 expression in primary tumors and lymph node metastases in Japanese patients with gastric adenocarcinoma. Jpn J Clin Oncol. 2019; 49:870–76. https://doi.org/10.1093/jjco/hyz068 [PubMed]
- 15. Dottermusch M, Krüger S, Behrens HM, Halske C, Röcken C. Expression of the potential therapeutic target claudin-18.2 is frequently decreased in gastric cancer: results from a large Caucasian cohort study. Virchows Arch. 2019; 475:563–571. https://doi.org/10.1007/s00428-019-02624-7 [PubMed]
- 16. Gyõrffy H, Holczbauer A, Nagy P, Szabó Z, Kupcsulik P, Páska C, Papp J, Schaff Z, Kiss A. Claudin expression in barrett’s esophagus and adenocarcinoma. Virchows Arch. 2005; 447:961–68. https://doi.org/10.1007/s00428-005-0045-9 [PubMed]
- 17. Singh P, Toom S, Huang Y. Anti-claudin 18.2 antibody as new targeted therapy for advanced gastric cancer. J Hematol Oncol. 2017; 10:105. https://doi.org/10.1186/s13045-017-0473-4 [PubMed]
- 18. Milatz S, Piontek J, Hempel C, Meoli L, Grohe C, Fromm A, Lee IM, El-Athman R, Günzel D. Tight junction strand formation by claudin-10 isoforms and claudin-10a/-10b chimeras. Ann N Y Acad Sci. 2017; 1405:102–15. https://doi.org/10.1111/nyas.13393 [PubMed]
- 19. Tamura A, Yamazaki Y, Hayashi D, Suzuki K, Sentani K, Yasui W, Tsukita S. Claudin-based paracellular proton barrier in the stomach. Ann N Y Acad Sci. 2012; 1258:108–14. https://doi.org/10.1111/j.1749-6632.2012.06570.x [PubMed]
- 20. Hagen SJ, Ang LH, Zheng Y, Karahan SN, Wu J, Wang YE, Caron TJ, Gad AP, Muthupalani S, Fox JG. Loss of tight junction protein claudin 18 promotes progressive neoplasia development in mouse stomach. Gastroenterology. 2018; 155:1852–67. https://doi.org/10.1053/j.gastro.2018.08.041 [PubMed]
- 21. Oshima T, Shan J, Okugawa T, Chen X, Hori K, Tomita T, Fukui H, Watari J, Miwa H. Down-regulation of claudin-18 is associated with the proliferative and invasive potential of gastric cancer at the invasive front. PLoS One. 2013; 8:e74757. https://doi.org/10.1371/journal.pone.0074757 [PubMed]
- 22. Jun KH, Kim JH, Jung JH, Choi HJ, Chin HM. Expression of claudin-7 and loss of claudin-18 correlate with poor prognosis in gastric cancer. Int J Surg. 2014; 12:156–62. https://doi.org/10.1016/j.ijsu.2013.11.022 [PubMed]
- 23. Matsusaka K, Ushiku T, Urabe M, Fukuyo M, Abe H, Ishikawa S, Seto Y, Aburatani H, Hamakubo T, Kaneda A, Fukayama M. Coupling CDH17 and CLDN18 markers for comprehensive membrane-targeted detection of human gastric cancer. Oncotarget. 2016; 7:64168–81. https://doi.org/10.18632/oncotarget.11638 [PubMed]
- 24. Kage H, Flodby P, Zhou B, Borok Z. Dichotomous roles of claudins as tumor promoters or suppressors: lessons from knockout mice. Cell Mol Life Sci. 2019; 76:4663–72. https://doi.org/10.1007/s00018-019-03238-7 [PubMed]
- 25. Shinozaki A, Ushiku T, Morikawa T, Hino R, Sakatani T, Uozaki H, Fukayama M. Epstein-barr virus-associated gastric carcinoma: a distinct carcinoma of gastric phenotype by claudin expression profiling. J Histochem Cytochem. 2009; 57:775–85. https://doi.org/10.1369/jhc.2009.953810 [PubMed]
- 26. Sattentau Q. Avoiding the void: cell-to-cell spread of human viruses. Nat Rev Microbiol. 2008; 6:815–26. https://doi.org/10.1038/nrmicro1972 [PubMed]
- 27. Tugizov SM, Berline JW, Palefsky JM. Epstein-barr virus infection of polarized tongue and nasopharyngeal epithelial cells. Nat Med. 2003; 9:307–14. https://doi.org/10.1038/nm830 [PubMed]
- 28. Cancer Genome Atlas Research Network. Comprehensive molecular characterization of gastric adenocarcinoma. Nature. 2014; 513:202–9. https://doi.org/10.1038/nature13480 [PubMed]
- 29. Tanaka A, Ishikawa S, Ushiku T, Yamazawa S, Katoh H, Hayashi A, Kunita A, Fukayama M. Frequent CLDN18-ARHGAP fusion in highly metastatic diffuse-type gastric cancer with relatively early onset. Oncotarget. 2018; 9:29336–50. https://doi.org/10.18632/oncotarget.25464 [PubMed]
- 30. Matsuda Y, Semba S, Ueda J, Fuku T, Hasuo T, Chiba H, Sawada N, Kuroda Y, Yokozaki H. Gastric and intestinal claudin expression at the invasive front of gastric carcinoma. Cancer Sci. 2007; 98:1014–19. https://doi.org/10.1111/j.1349-7006.2007.00490.x [PubMed]
- 31. Sanada Y, Oue N, Mitani Y, Yoshida K, Nakayama H, Yasui W. Down-regulation of the claudin-18 gene, identified through serial analysis of gene expression data analysis, in gastric cancer with an intestinal phenotype. J Pathol. 2006; 208:633–42. https://doi.org/10.1002/path.1922 [PubMed]
- 32. Robinson MD, McCarthy DJ, Smyth GK. edgeR: a bioconductor package for differential expression analysis of digital gene expression data. Bioinformatics. 2010; 26:139–40. https://doi.org/10.1093/bioinformatics/btp616 [PubMed]
- 33. Law CW, Alhamdoosh M, Su S, Dong X, Tian L, Smyth GK, Ritchie ME. RNA-seq analysis is easy as 1-2-3 with limma, glimma and edgeR. F1000Res. 2016; 5:ISCB Comm J-1408. https://doi.org/10.12688/f1000research.9005.3 [PubMed]
- 34. Rhodes DR, Kalyana-Sundaram S, Mahavisno V, Varambally R, Yu J, Briggs BB, Barrette TR, Anstet MJ, Kincead-Beal C, Kulkarni P, Varambally S, Ghosh D, Chinnaiyan AM. Oncomine 3.0: genes, pathways, and networks in a collection of 18,000 cancer gene expression profiles. Neoplasia. 2007; 9:166–80. https://doi.org/10.1593/neo.07112 [PubMed]
- 35. Tang Z, Kang B, Li C, Chen T, Zhang Z. GEPIA2: an enhanced web server for large-scale expression profiling and interactive analysis. Nucleic Acids Res. 2019; 47:W556–60. https://doi.org/10.1093/nar/gkz430 [PubMed]
- 36. Companioni O, Sanz-Anquela JM, Pardo ML, Puigdecanet E, Nonell L, García N, Parra Blanco V, López C, Andreu V, Cuatrecasas M, Garmendia M, Gisbert JP, Gonzalez CA, Sala N. Gene expression study and pathway analysis of histological subtypes of intestinal metaplasia that progress to gastric cancer. PLoS One. 2017; 12:e0176043. https://doi.org/10.1371/journal.pone.0176043 [PubMed]
- 37. Xu X, Feng L, Liu Y, Zhou WX, Ma YC, Fei GJ, An N, Li Y, Wu X, Yao F, Cheng SJ, Lu XH. Differential gene expression profiling of gastric intraepithelial neoplasia and early-stage adenocarcinoma. World J Gastroenterol. 2014; 20:17883–93. https://doi.org/10.3748/wjg.v20.i47.17883 [PubMed]
- 38. Park SJ, Yoon BH, Kim SK, Kim SY. GENT2: an updated gene expression database for normal and tumor tissues. BMC Med Genomics. 2019 (Suppl 5); 12:101. https://doi.org/10.1186/s12920-019-0514-7 [PubMed]
- 39. Ru B, Wong CN, Tong Y, Zhong JY, Zhong SS, Wu WC, Chu KC, Wong CY, Lau CY, Chen I, Chan NW, Zhang J. TISIDB: an integrated repository portal for tumor-immune system interactions. Bioinformatics. 2019; 35:4200–02. https://doi.org/10.1093/bioinformatics/btz210 [PubMed]
- 40. Cerami E, Gao J, Dogrusoz U, Gross BE, Sumer SO, Aksoy BA, Jacobsen A, Byrne CJ, Heuer ML, Larsson E, Antipin Y, Reva B, Goldberg AP, et al. The cBio cancer genomics portal: an open platform for exploring multidimensional cancer genomics data. Cancer Discov. 2012; 2:401–04. https://doi.org/10.1158/2159-8290.CD-12-0095 [PubMed]
- 41. Warde-Farley D, Donaldson SL, Comes O, Zuberi K, Badrawi R, Chao P, Franz M, Grouios C, Kazi F, Lopes CT, Maitland A, Mostafavi S, Montojo J, et al. The GeneMANIA prediction server: biological network integration for gene prioritization and predicting gene function. Nucleic Acids Res. 2010; 38:W214–20. https://doi.org/10.1093/nar/gkq537 [PubMed]
- 42. Gyorffy B, Lánczky A, Szállási Z. Implementing an online tool for genome-wide validation of survival-associated biomarkers in ovarian-cancer using microarray data from 1287 patients. Endocr Relat Cancer. 2012; 19:197–208. https://doi.org/10.1530/ERC-11-0329 [PubMed]