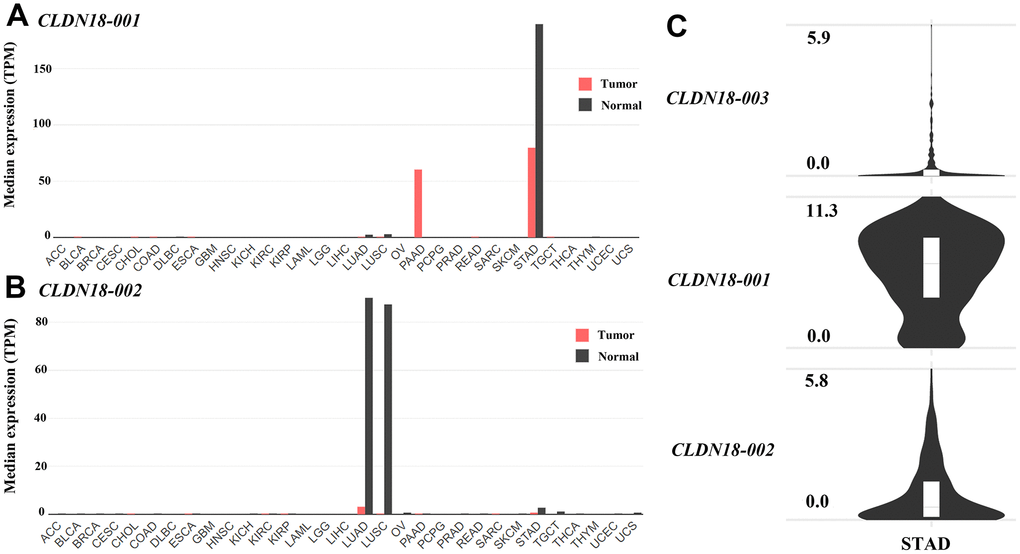
Figure 3.Transcript levels of isoforms of CLDN18 in the GEPIA2 database. (A) The transcript levels of CLDN18-001 across all tumor samples and paired normal tissues. (B) The transcript levels of CLDN18-002 across all tumor samples and paired normal tissues. (C) The transcript levels of three isoforms of CLDN18 in GC tissues. The height of the bars of (A, B) represents the median expression levels transformed by TPM. The Y axis of (C) represents the expression level transformed by log2(counts+1). TPM, transcripts per kilobase of exon per million mapped reads.