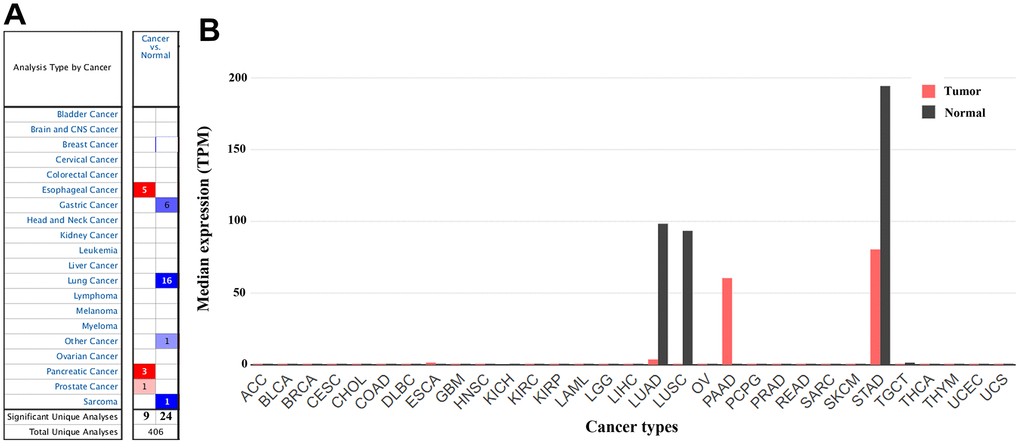
Figure 2.The gene expression profiles of CLDN18 across all tumor samples. (A) mRNA expression levels of CLDN18 in various types of cancer from the Oncomine database. The cell number represents the number of datasets that met the thresholds. The color intensity is proportional to the significance of dysregulation. (B) The gene expression profiles of CLDN18 across all tumor samples and paired normal tissues in the GEPIA2 database. The height of the bar represents the median expression level. TPM, transcripts per kilobase of exon per million mapped reads.