


Introduction
Aging is a complex phenomenon that involves the interplay of various factors, such as the functional decline of adult stem cells [1]. Hematopoietic stem cells can self-renew and differentiate into multiple lineages, which is the basis for the maintenance and reconstitution of the entire hematopoietic system. HSCs aging is associated with impaired hematopoiesis in the elderly [2]. In mice for example, several age-dependent changes have been identified in the HSCs, such as increased numbers, decreased homing efficiency, reduced repopulation and self-renewal abilities, and skewed differentiation to the myeloid lineage [3–6]. Studies increasingly show that HSCs aging is regulated by both intrinsic transcriptional factors and extrinsic factors in the niche, and involves the DNA damage repair, cell cycle, telomere maintenance, oxidative stress response and tumor suppression pathways. Despite evidence of impaired HSCs function during aging, the molecular mechanisms are not well understood.
Caveolae are plasma membrane invaginations coated with the scaffolding protein caveolin, and regulate cell growth, endocytosis, mitochondrial function, migration and senescence. The cavin family of proteins is crucial to caveolae formation, stability and dynamics [7–9]. Four cavin proteins have been identified so far, including cavin-1 (PTRF), cavin-2 (SDPR), cavin-3 (SRBC) and cavin-4 (MURC) [10]. Cav-1 null mice have aberrant stem and progenitor cell populations, indicating that Cav-1 regulates stem cell proliferation. In addition, in vitro studies using stem cells isolated from these mice suggested that Cav-1 also regulates stem cell differentiation [11, 12]. In our previous study as well, Cav-1 deficient mice exhibited impaired HSCs quiescence, self-renewal and function in response to external factors, although the underlying mechanisms are unknown.
PTRF was first identified as a protein that enhances ribosomal RNA synthesis by dissociating the ternary complex of RNA polymerase I [13]. Hill et al subsequently discovered a regulatory role of PTRF in caveolae biogenesis and function [7]. PTRF-deficient mice lack caveolae, and exhibit dyslipidemia, glucose intolerance and muscular dystrophy [14]. PTRF mutations in humans are also associated with generalized lipodystrophy [15, 16]. We previously showed increased PTRF levels in senescent human fibroblasts compared to young fibroblasts. In addition, overexpression of PTRF in young cells induced features characteristic of senescence, whereas PTRF knockdown extended the replicative lifespan of WI-38 cells [17]. Furthermore, PTRF is down-regulated in breast cancer cell lines and tumors, indicating its potential as a biomarker of breast cancer progression [18]. PTRF transgenic mice are obese and have increased serum levels of ALT and AST, along with greater fat accumulation in the liver compared with WT mice [19]. There is also evidence that PTRF regulates lipid and glucose metabolism in human cells [20].
In this study, we found that PTRF overexpression resulted in HSCs expansion in the bone marrow (BM), which was accompanied by lower repopulation ability and a predominantly myeloid differentiation potential. In addition, the high levels of PTRF in HSCs induced cell cycle arrest at the G1 phase, increased production of reactive oxygen species (ROS) and a higher proportion of SA-β-gal positive cells. Mechanistically, the regulatory effects of PTRF on HSCs function were partly mediated by Cav-1.
Results
PTRF expression increased with age and promoted myeloid differentiation
PTRF expression levels increase with age in WI-38 cells and mouse tissues and promote cellular senescence [17, 22]. Consistent with this, PTRF mRNA (Figure 1A) and protein (Figure 1B) levels were significantly higher in the BM cells of 22-month old C57BL/6 mice compared to that of the 2-month old mice. Furthermore, high PTRF levels were also detected in the BM of 2-months old PTRF transgenic mice compared to age-matched WT mice (Figure 1C and 1D). Aged HSCs frequently have a skewed differentiation potential, and produce relatively more myeloid cells compared to lymphoid cells. Compared to the WT mice, the PTRF transgenic mice showed a decreased percentage of B220+ B cells in the PB (22.48 ± 8.07 in PTRF vs. 37.04 ± 8.94 in WT) and BM (4.28 ± 0.45 in PTRF vs. 7.99 ± 2.84 in WT) (Figure 1E). Compared to the WT mice, the PTRF transgenic mice showed an increased percentage of CD11b+ and Gr-1+ M (monocytes and granulocytes) cells (Figure 1F) in the PB(12.88 ± 1.65 in PTRF vs. 8.034 ± 3.06 in WT) and BM(23.86 ± 7.16 in PTRF vs. 15.12 ± 1.44 in WT), although T cells were not affected by the increased PTRF levels (Figure 1G). Taken together, PTRF was upregulated in the BM of aged mice and its ectopic expression increased myeloid differentiation and diminished that to the lymphoid lineage, indicating a crucial role in HSCs aging.
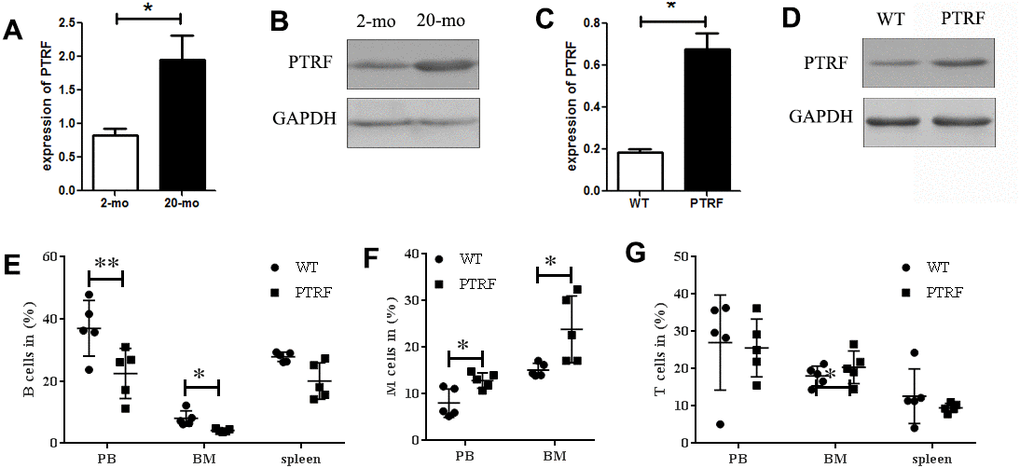
Figure 1. PTRF expression increased during aging and skewed differentiation potential of HSCs. (A) PTRF mRNA levels in the bone marrow of young (2-mo) and old mice (20-mo), n=3. (B) Immunoblot showing PTRF protein expression in the bone marrow (BM) of young and old mice, n=3. (C) PTRF mRNA levels in the BM of 2-month old PTRF transgenic and wild-type (WT) mice, n=3. (D) Immunoblot showing PTRF protein expression in the BM of young PTRF and WT mice, n=3. (E–G) The percentage of B cells (E), M cells (F) and T cells (G) in the peripheral blood, BM and spleen of young PTRF transgenic mice. Data represent the mean ± SD of three independent experiments. *, P < 0.05; **, P < 0.01. Data were normalized against GAPDH expression.
PTRF overexpression exhausted the HSC pool
To further investigate the role of PTRF in HSC aging, we analyzed the relative proportion of LSKs (Lin-Sca1+c-kit+), LT-HSCs (Lin-Sca-1+c-Kit+CD34-Flt-3-, long-term HSCs), ST-HSCs (Lin-Sca-1+c-Kit+CD34+ Flt-3-, short-term HSCs) and MPPs (Lin-Sca-1+c-Kit+Flt-3+, multipotent progenitors) in the BM of 2, 6 and 12-month old PTRF and WT mice (Figure 2A). The percentage of LSKs were similar in the young mice, but increased significantly in the 6 and 12-month PTRF mice (1.56-fold, P=0.0460 and 1.47-fold, P=0.0246) compared to the age-matched WT mice (Figure 2B). The frequency of LT-HSCs also showed an age-dependent increase in the PTRF mice (1.92-fold, P=0.0342 and 1.51-fold, P=0.0453 at 6 and 12 months respectively) compared to the WT mice (Figure 2C). In contrast, the frequency of ST-HSCs and MPPs were similar in both groups and did not undergo any significant change during aging (Figure 2D and 2E). HSCs differentiate to the common lymphoid progenitors (c-KitlowSca-1lowLin-, CLPs) and common myeloid progenitors (CD34+CD16/CD32-, CMPs) in the BM [23, 24]. The latter then differentiate to the more lineage specific granulocyte-macrophage progenitors (CD34+CD16/CD32+, GMPs) and megakaryocyte-erythroid progenitors (CD34-CD16/CD32-, MEPs). We observed fewer CLPs (Figure 2F) and an increased proportion of GMPs (Figure 2H) in the PTRF compared to the WT mice, while no significant changes were seen in the percentages of CMPs and MEPs (Figure 2G and 2I). Taken together, PTRF overexpression in the BM correlated with an increased number of aged HSCs, which was most prominent in the LT-HSCs as opposed to the ST-HSCs or MPPs compartments.
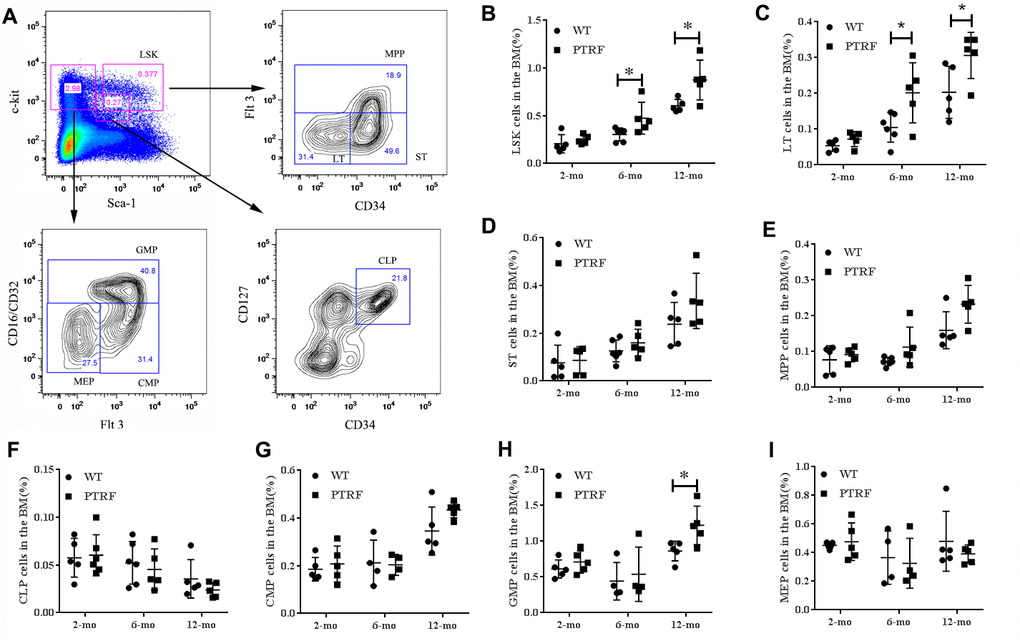
Figure 2. PTRF overexpression alters the hematopoietic stem/progenitor cell compartments in mice. (A) Representative flow cytometry plots showing HSCs and progenitor populations in the BM. (B–I) The percentage of LSKs, LT-HSCs, ST-HSCs, MPP, CLP, CMPs, GMPs and MEPs cells in the BM from 2, 6 and 12-month old mice. n=5 mice per group. Data represent the mean ± SD of three independent experiments. *, P < 0.05.
PTRF overexpression impaired HSC function
The clonogenic potential of LT-HSCs isolated from PTRF and WT mice (n=8) were next analyzed by the routine methylcellulose colony assay. The PTRF-overexpressing cells generated fewer and smaller colonies compared to WT LT-HSCs (Figure 3A), which suggested a defect in the self-renewal capacity of the LT-HSCs. This is consistent with previous observations that the repopulation and self-renewal abilities of aged murine HSCs are reduced despite an age-related increase in their number. To further analyze the effect of PTRF on the self-renewal and differentiation capacity of HSCs, we transplanted equal numbers of donor PTRF/WT CD45.2+ cells and competitor CD45.1+ cells into lethally irradiated mice (CD45.1/CD45.2). The recipient mice showed lower engraftment of the PTRF-derived cells (Figure 3C) compared to that of the WT-derived cells (Figure 3B) at different time points after transplantation. In addition, the percentage of donor-derived B cells was decreased in the PB (30.97 ± 10.87 in PTRF vs. 52.45 ± 3.04 in WT), BM (30.95 ± 17.41 in PTRF vs. 53.45 ± 5.32 in WT) and spleen (26.12 ± 10.80 in PTRF vs. 46.75 ± 0.92 in WT) (Figure 3D) 16 weeks post-transplantation in the mice receiving PTRF-derived cells. The percentage of donor-derived M cells was increased (Figure 3E) 16 weeks post-transplantation in the mice receiving PTRF-derived cells. Compared to the WT mice, the percentage of LSKs was also higher in the mice transplanted with PTRF-derived cells (Figure 3F). Although the above changes did not reach statistical significance, we can conclude from the results that PTRF-overexpressing HSCs failed to reconstitute hematopoiesis in irradiated recipients and had altered differentiation potential.
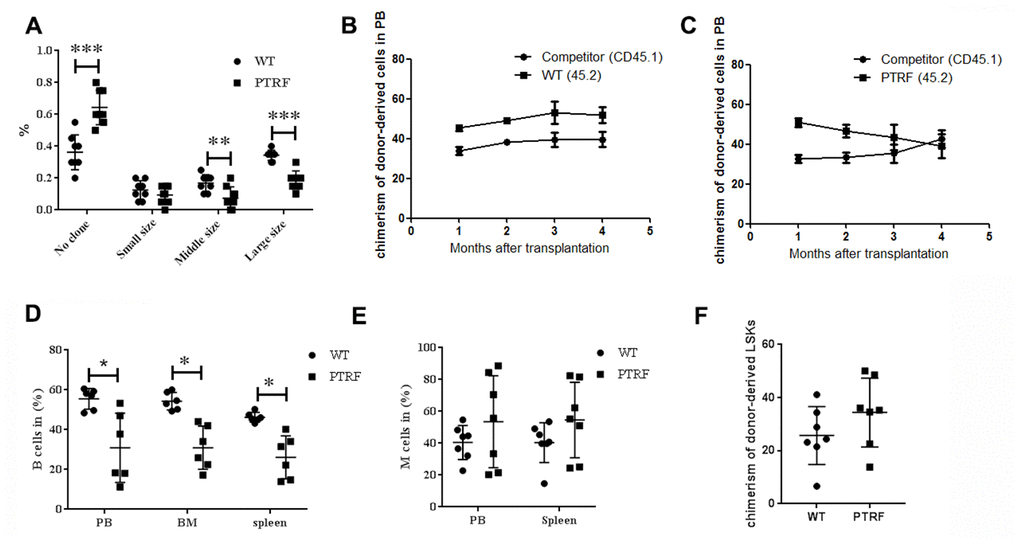
Figure 3. PTRF impairs HSCs function. (A) Frequency of colonies generated by LT-HSCs from PTRF and WT mice (n=3). (B) The percentage of CD45.2+ cells in the PB of irradiated recipient mice 4-, 8-, 12- and 16 weeks after transplantation with WT HSCs. (C) The percentage of CD45.2+ cells in the PB of irradiated recipient mice 4-, 8-, 12- and 16 weeks after transplantation with PTRF-overexpressing HSCs. (D, E) The percentage of donor-derived B (D) and M cells (E) from PTRF or WT mice in the BM of recipient mice at 16 weeks post-transplantation. (F) The percentage of donor-derived LSKs in the BM of recipient mice at 16 weeks post-transplantation. n=9 mice per group. Data represent the mean ± SD. *, P < 0.05.
PTRF induced HSCs senescence
Since most LT-HSCs in adult mice remain quiescent [26], the effect of PTRF on the frequencies of quiescent or cycling LT-HSCs was also analyzed (Figure 4A). The BM of PTRF-overexpressing mice exhibited an increased percentage of LT-HSCs in the G1 phase (50.97 ± 5.39% in PTRF vs. 32.2 ± 7.93% in WT, P=0.0039) with a concomitant decrease in the S–G2/M phase (7.29 ± 1.59% in PTRF vs. 10.62 ± 1.61% in WT, P=0.023). However, PTRF had no effect on the number of quiescent (G0) LT-HSCs (38.42 ± 10.16% in PTRF vs. 54.3 ± 11.45% in WT) (Figure 4B). In addition, there were no significant differences in the frequencies of apoptotic HSCs between the PTRF and WT mice (Figure 4C and 4D). Thus, PTRF overexpression induced cell cycle arrest in the HSCs at the G1 phase rather than affect quiescence and apoptosis. Consistent with this, the LSKs from PTRF mice showed higher levels of the fluorescent β-gal substrate C12FDG (Figure 4E), and an increase in the percentage of cells with SA-β-gal activity compared to the WT cells (58.8 ± 6.57% in PTRF vs. 41.4 ± 11.7% in WT) (Figure 4F), indicating senescence induction. The loss of quiescence frequently correlates with increased levels of reactive oxygen species (ROS) in the LT-HSCs, which in turn impairs their self-renewal [26]. Consistent with the results so far, PTRF-overexpressing LSKs showed higher levels of ROS compared to that from WT mice (15.26 ± 5.98% in PTRF vs. 4.78 ± 1.65% in WT) (Figure 4G and 4H).
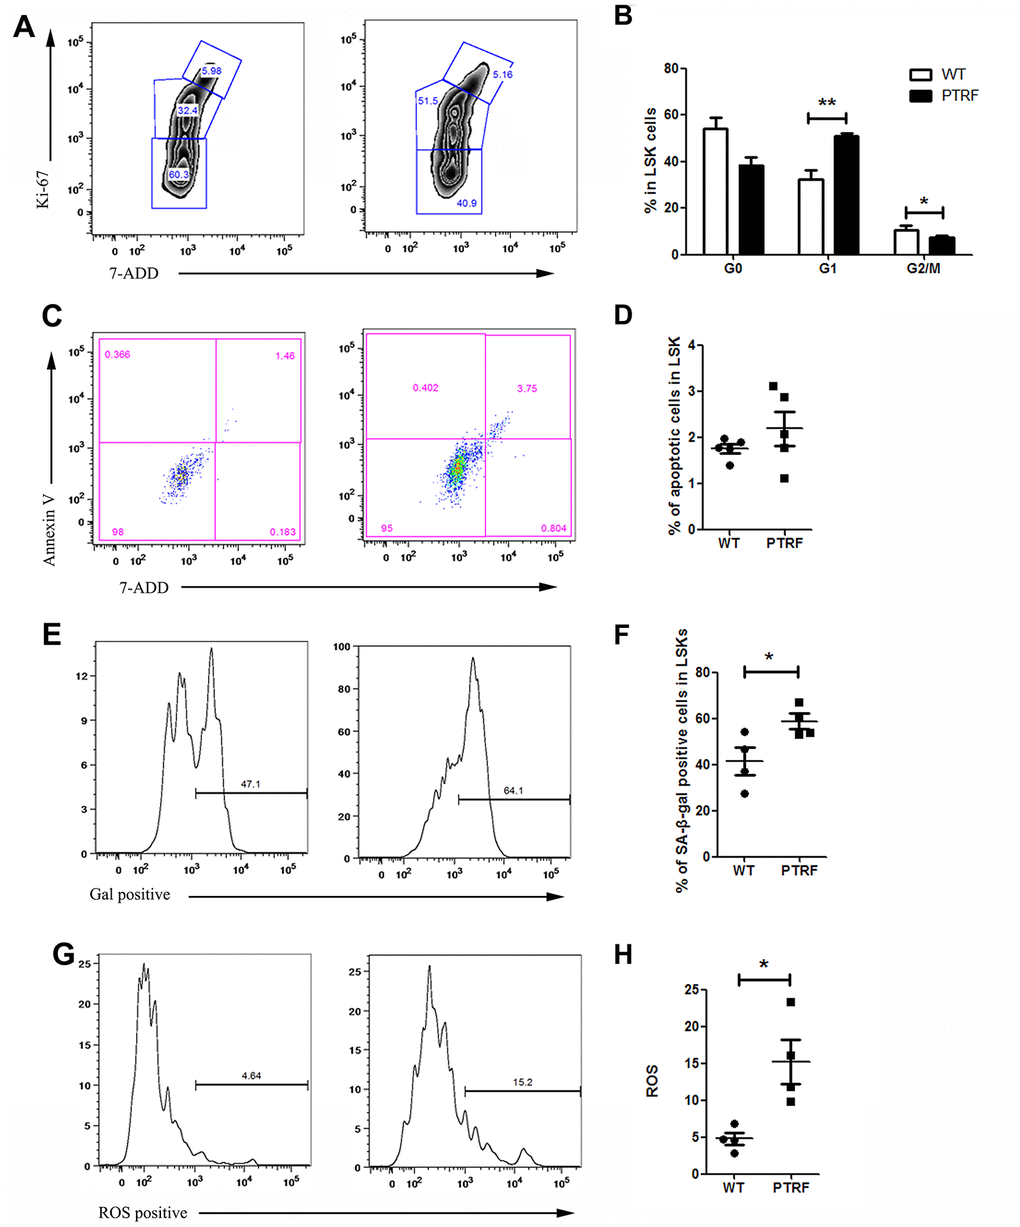
Figure 4. PTRF overexpression induced cell cycle arrest at G1 phase and accelerated cellular senescence. (A) Flow cytometry plots showing cell cycle distribution of LSKs from PTRF and WT mice. (B) The percentage of cells in each phase of the cell cycle. (C) Flow cytometry plots showing viable and apoptotic LSKs from PTRF and WT mice. (D) The percentage of apoptotic LSK cells. (E) Flow cytometry plots showing C12FDG levels in the LSKs from PTRF and WT mice. (F) The percentage of SA-β-gal-positive LSK cells. n=4 or 5 mice per group. (G) Flow cytometry plots showing ROS producing cells stained with the DCFH probe. (H) The percentage of ROS-positive LSK cells. Data represent the mean ± SD. *, P < 0.05; **, P < 0.01.
Taken together, PTRF induces a senescent phenotype in the HSCs.
PTRF activated the senescence pathway in HSCs via Cav-1
Cellular senescence and growth arrest are established and maintained by the p53 and p16-pRB pathways. PTRF overexpression in the HSCs significantly upregulated p21, and also induced a slight increase in p53 levels (Figure 5A). p16 and RB were also upregulated in the HSCs of PTRF mice (Figure 5B). However, there were no significant differences in the expression of HSC-related genes between the PTRF and WT mice (Figure 5C). These results indicated that PTRF induced HSC senescence via the p53-p21 and p16-RB pathways. We also detected increased levels of Cav-1 in the PTRF HSCs (Figure 5A), which is significant since PTRF-induced cellular senescence in WI-38 cells is dependent on caveolar targeting and Cav-1 interaction [17]. To further evaluate the role of the Cav-1/p53/p21 pathway in PTRF-induced HSC senescence, we crossed the PTRF transgenic mice with Cav-1 knockout mice to generate PTRF+Cav-1-/- mice. HSCs isolated from the PTRF+Cav-1-/- mice and WT mice showed no difference in the clonogenic capacity both in terms of the number and size of colonies (Figure 6A). Furthermore, competitive transplantation showed no obvious differences in the chimerism of donor-derived B cells and M cells between the PTRF+Cav-1-/- and WT mice (Figure 6B–6D). Taken together, loss of Cav-1 partly compensated the PTRF-induced defects in HSC function, indicating that PTRF initiates the senescence pathway in HSCs via Cav-1.
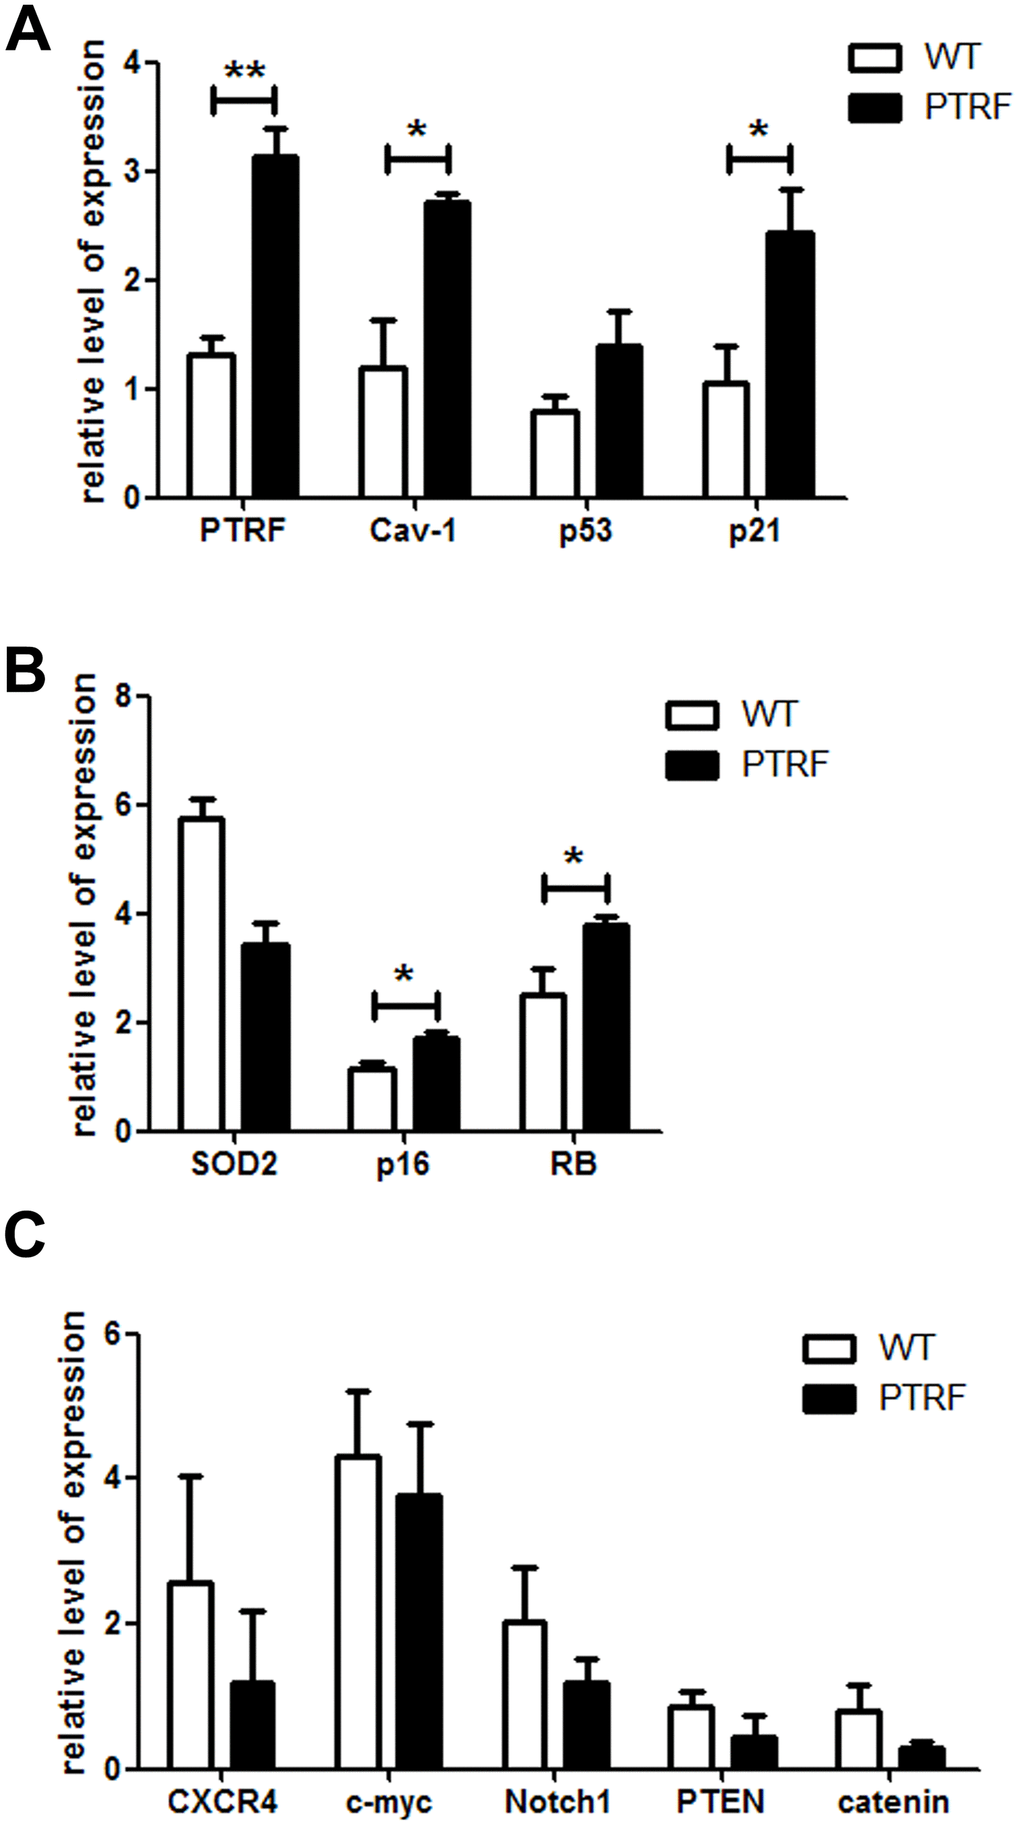
Figure 5. PTRF altered the expression pattern of senescence-associated genes in LSKs. (A–C) RT-PCR analysis of the indicated genes in sorted LSK cells from PTRF and WT mice. Data represent the mean ± SD of three independent experiments. *, P < 0.05; **, P < 0.01. Data were normalized against GAPDH expression.
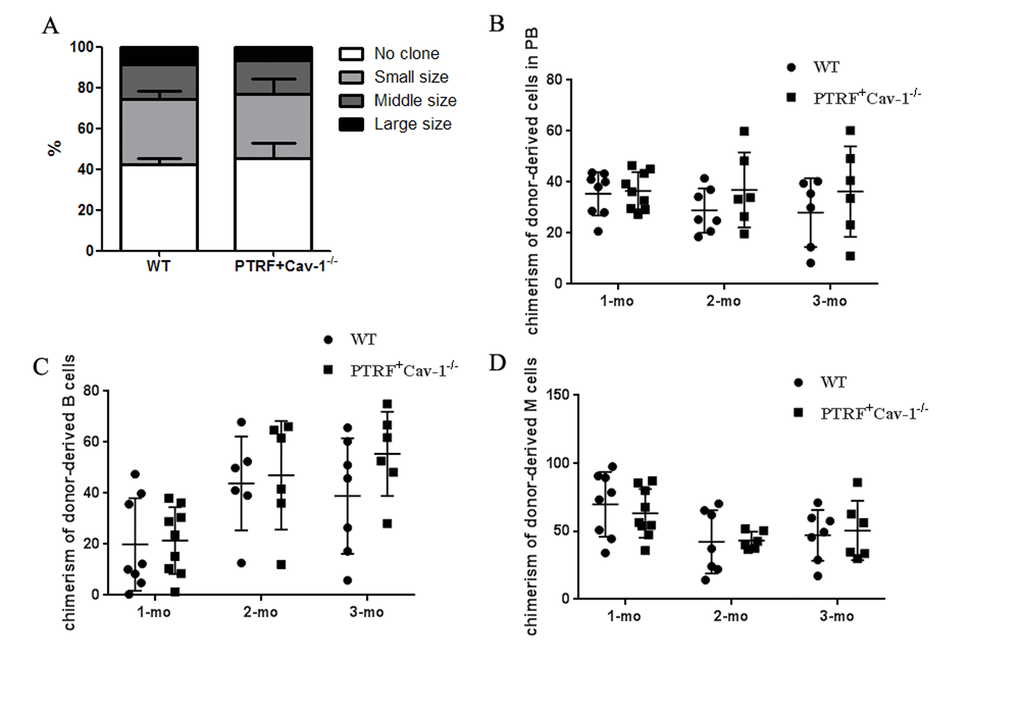
Figure 6. PTRF impaired HSCs function partly through Cav-1. (A) Number of colonies generated by LT-HSCs from PTRF+Cav-1-/- and WT mice (n=3). (B) The percentage of donor-derived cells in the PB of PTRF+Cav-1-/- and WT mice at 4, 8, and 12 weeks post-transplantation. (C, D) The percentage of donor-derived B (C) and M cells (D) from PTRF+Cav-1-/- and WT mice in the PB at 4, 8, and 12 weeks post-transplantation. n=9 mice per group. Data represent the mean ± SD.
Discussion
PTRF is an important factor regulating HSC senescence, as indicated by the increase in cell numbers, impaired self-renewal and hematopoietic reconstitution, and a skewed differential potential of the HSCs isolated from PTRF transgenic mice. Mechanistically, PTRF arrested the LSKs in the G1 phase, increased ROS production and induced senescence via the Cav-1-p53-p21 and p16-RB pathways. Furthermore, the impaired HSCs function in the PTRF transgenic mice was partially abrogated by knocking out Cav-1. Despite an age-dependent increase in the number of HSCs in mice, their repopulating and self-renewing capacities are markedly reduced. The PTRF mice also showed an increased HSCs pool, especially which of LT-HSCs compared to age-matched WT controls. However, in vitro clonogenic assays and in vivo competitive transplantation showed decreased self-renewal and hematopoietic reconstitution abilities of the PTRF-overexpressing HSCs. Furthermore, the myeloid-directed differentiation potential of the HSCs and a defective B-lymphoid compartment in these mice may have led to HSC exhaustion.
The molecular mechanisms underlying the age-dependent decline in HSC self-renewal capacity are complex, and involve multiple intrinsic and extrinsic factors. The p16-RB and p53-p21 pathways regulate cellular senescence and thus play important roles in the aging process. In fact, p16 levels increase in many human and rodent tissues with aging [27, 28]. In the HSCs, the age-related increase of p16 correlates with decreased self-renewal ability [6, 25]. Consistent with this, p16 knockout enhanced the regenerative potential of HSCs in aging mice [6]. In the p53-deficient mice as well, the number of HSCs increase and their ability to engraft and repopulate the ablated hematopoietic compartment also improves, indicating that the self-renewal capacity of HSCs is affected by p53 as well [29].
PTRF is a key regulator in the biogenesis and function of caveolae, and its functions are associated with Cav-1, which is known to regulate the p53/p21, focal adhesion kinase, epidermal growth factor receptor and small Rho GTPase pathways. Cav-1 overexpression induces premature senescence and activates the p53 pathway [17, 30, 31]. It binds directly to the signaling intermediates via its scaffolding domain. The p53 negative regulator MDM2 has a Cav-1 binding motif, and is sequestered by Cav-1 into caveolar membranes, thereby limiting its interaction with p53. This stabilizes p53 and upregulates the downstream p21, resulting in cell cycle arrest and premature senescence in WI-38 and mouse embryonic fibroblasts [32].
The PTRF induced the number of HSCs increased significantly in the 6 and 12-month PTRF mice. And we previously showed increased PTRF in young human fibroblasts induced features characteristic of senescence. PTRF may impair HSCs and its niche cells functions, which directly or indirectly influence the HSCs function.
PTRF impairs HSC self-renewal and function by inducing senescence via the ROS-p38-p16 and caveolin-1-p53-p21 pathways, which can be partially abrogated by inhibiting Cav-1.
Materials and Methods
Animals
The PTRF transgenic mice [19] were crossed with the Cav-1-/- strain to generate the PTRF+Cav-1-/- mice. The recipient mice were the B6.SJL-PtprcaPep3b/BoyJ (CD45.1) and CD45.1/CD45.2 heterozygous stains. All mice had the C57BL/6J genetic background. The animals were kept in a pathogen-free environment and fed standard diet. All animal experiments were approved by the Animal Care and Use Committees of the Institute of Laboratory Animal Science of Peking Union Medical College.
Flow cytometry
The BM was flushed out of the tibia and femurs with sterile PBS and homogenized by repeatedly passing through an 18-gauge needle. The spleens and thymi were gently homogenized in a glass homogenizer and the cells were suspended in sterile PBS. Peripheral blood (PB) was incubated with red blood cell lysis buffer (BD Biosciences, San Jose, CA, USA) according to the manufacturer’s instructions and washed with PBS. All cell suspensions were strained through a sterile nylon mesh (75μm) to remove debris and counted. After adjusting the cells to the appropriate density, they were stained with following antibodies for 30 min at 4°C: biotin-conjugated anti-mouse CD4 (RM4-5), CD8a (53–6.7), CD11b (M1/70), B220 (RA3-6B2), TER119 (TER-119) and Gr1 (RB6-8C5), APC-eFluor®780-Streptavidin, PE-Cy7 B220 (RA3-6B2), PE-Cy7 Sca-1 (D7), PE Flt3 (A2F10), FITC B220 (RA3-6B2), FITC CD34 (RAM34), PerCP-Cy5.5 CD127 (A7R34), PE CD16/CD32 (93), PerCP-Cy5.5 CD3e (145-2C11), PerCP-Cy5.5 CD45.2 (104), APC-eFluor®780 CD11b, PE CD45.1 (A20) and APC CD117 (ACK2). All antibodies were purchased from eBioscience (San Diego, CA, USA). The stained cells were acquired on FACS Aria II (Becton Dickson, Franklin Lakes, NJ, USA), and the data were analyzed using FlowJo software (Three Star, Ashland, OR, USA)
Cell cycle and apoptosis analysis
For cell cycle analysis, total BM cells were first treated with the RBC lysis buffer, and then stained with the stem cell markers (lineage, Sca-1 and c-kit) as described. After fixing and permeabilizing using a pre-formulated buffer (Becton Dickson, 00-5123-43), the cells were stained with FITC-Ki-67 antibody and 7-AAD. To detect apoptosis, total BM cells were stained for stem cell surface markers as above, washed, and then stained with FITC-annexin V antibody and 7-AAD. The cells were acquired on FACS Aria II, and the cell cycle distribution and percentage of apoptotic cells were analyzed using the FlowJo software.
SA-β-gal staining
SA-β-gal activity was assayed using C12FDG (Molecular Probes) according to the manufacturer’s instructions [21]. Briefly, BM cells stained for stem cell markers were incubated with 100nM bafilomycin A1 for 1 h at 37°C to induce lysosomal alkalinization. After washing with PBS, the cells were incubated with 2mM C12FDG for 1–2 h at 37°C. The stained cells were analyzed by flow cytometry as described.
Detection of ROS
BM cells were incubated with DCFH-DA (Beyotime Company, China) at 37°C for 20 min, and the oxidized fluorescent product 2′,7′-dichlorofluorescein (DCFH) was detected by flow cytometry.
Competitive transplantation
BM cells (2 x 10⁶) from 2-month-old PTRF transgenic, WT and PTRF+cav-1-/- mice (donor, CD45.2) were mixed with equal number of BM cells from competitor (CD45.1+) mice, and transplanted into lethally irradiated hosts (CD45.1/CD45.2). The animals were sacrificed at 4, 8, 12 and 16 weeks after transplantation, and donor-derived chimerism in the PB and BM were analyzed by flow cytometry to evaluate HSC-mediated reconstitution.
Clonogenic assays
Suitable cells were plated in 96-well plates at the density of 1 cells/well, with 20 replicates per sample, in a methylcellulose-based medium (R&D, HSC007). After culturing for 14 days, the ensuing colonies were counted under a microscope. Based on the approximate cell load, the colonies were defined as large (>10,000 cells), medium (1,000–10,000) and small (<1,000).
RT-PCR
Total RNA was extracted using TRIzol reagent (Invitrogen, Carlsbad, CA, USA) according to the manufacturer’s instructions, and treated with DNase I. The cDNA was synthesized using M-MLV Reverse Transcriptase (Promega) and a poly-dT primer. The RT-PCR primers were as follows: Cav-1 5′- GACCCCAAGCATCTCAACGAC-3′ and reverse 5′-GGATCGCAGAAGGTATGGACG-3′ (Tm=62°C, 27 cycles), p21 waf1/cip1 forward 5′-TCCAGACATTCAGAGCCACA-3’ and reverse 5’-CGAAGAGACAACGGCACACT-3′ (Tm=60°C, 30 cycles), p53 forward 5′-CATGAACCGCCGACCTATC-3′ and reverse 5′-TCCCGGAACATCTCGAGGC-3′ (Tm=62°C, 35 cycles), p16 forward 5′-CGAACTCTTTCGGTCGTACCC-3′ and reverse 5′-CGAATCTGCACCGTAGTTGAGC-3′ (Tm=62°C, 35 cycles), and GAPDH forward 5′-GAGCGAGACCCCACTAACAT-3′ and reverse 5′-TTCACACCCATCACAAACAT-3′ (Tm=60°C, 25 cycles). The samples were amplified using the SYBR Premix Ex Taq II (TaKaRa Shuzo, Kyoto, Japan) on the ABI StepOne™ detection system (Applied Biosystems, Foster City, CA, USA).
Western blotting
The cells were lysed with RIPA buffer (50 mM Tris-Cl, pH 8.0, 100 mM NaCl, 0.1% SDS, 0.5% sodium deoxycholate, 1% NP-40) supplemented with protease inhibitor cocktail (Roche). The total protein concentration of the lysates was measured using a BCA kit, and resolved by SDS polyacrylamide gel (15%) electrophoresis. The protein bands were transferred to nitrocellulose (NC) membranes (Millipore) and incubated overnight with anti-PTRF antibody (BD) at 4°C. After probing with HRP-conjugated anti-rabbit secondary antibody, the positive bands were detected using a chemiluminescent reagent (Santa Cruz, USA).
Statistical analysis
Statistical analysis was performed using Microsoft Excel and GraphPad Prism. Data were represented as mean±standard deviation (SD) and compared by Student’s t-test. P < 0.05 was considered statistically significant.
Ethics approval
All mice used in this study were maintained on a C57BL/6 J genetic background and bred in an AAALAC-accredited facility. The Animal Care and Use Committees of the Institute of Laboratory Animal Science of Peking Union Medical College, China approved the animal protocol (ILAS-BL17001 and ILAS-BL17002).
Author Contributions
All listed authors meet the requirements for authorship. CQ, LZ and YC conceived and designed the study, read and edited the paper. LB performed the experiments and wrote the main manuscript test. YL performed the animal experiments and revised the manuscript. GS an YH performed and analyzed the data of FACS. KL and YM performed the animal experiments. All authors have read and approved the manuscript.
Conflicts of Interest
The authors declare that they have no conflicts of interest.
Funding
This work was supported by the National Science Foundation of China (Grant No: 31672374), CAMS Innovation Fund for Medical Sciences (CIFMS) (No. 2016-I2M-1-012), and Beijing Natural Science Foundation (No: 5171001).
References
- 1. Sperka T, Wang J, Rudolph KL. DNA damage checkpoints in stem cells, ageing and cancer. Nat Rev Mol Cell Biol. 2012; 13:579–90. https://doi.org/10.1038/nrm3420 [PubMed]
- 2. Florian MC, Nattamai KJ, Dörr K, Marka G, Uberle B, Vas V, Eckl C, Andrä I, Schiemann M, Oostendorp RA, Scharffetter-Kochanek K, Kestler HA, Zheng Y, Geiger H. A canonical to non-canonical Wnt signalling switch in haematopoietic stem-cell ageing. Nature. 2013; 503:392–96. https://doi.org/10.1038/nature12631 [PubMed]
- 3. Pang WW, Price EA, Sahoo D, Beerman I, Maloney WJ, Rossi DJ, Schrier SL, Weissman IL. Human bone marrow hematopoietic stem cells are increased in frequency and myeloid-biased with age. Proc Natl Acad Sci USA. 2011; 108:20012–17. https://doi.org/10.1073/pnas.1116110108 [PubMed]
- 4. Sudo K, Ema H, Morita Y, Nakauchi H. Age-associated characteristics of murine hematopoietic stem cells. J Exp Med. 2000; 192:1273–80. https://doi.org/10.1084/jem.192.9.1273 [PubMed]
- 5. Schwamborn JC, Müller M, Becker AH, Püschel AW. Retraction: ‘Ubiquitination of the GTPase Rap1B by the ubiquitin ligase Smurf2 is required for the establishment of neuronal polarity’. EMBO J. 2014; 33:3012. https://doi.org/10.15252/embj.201470130 [PubMed]
- 6. Janzen V, Forkert R, Fleming HE, Saito Y, Waring MT, Dombkowski DM, Cheng T, DePinho RA, Sharpless NE, Scadden DT. Stem-cell ageing modified by the cyclin-dependent kinase inhibitor p16INK4a. Nature. 2006; 443:421–26. https://doi.org/10.1038/nature05159 [PubMed]
- 7. Hill MM, Bastiani M, Luetterforst R, Kirkham M, Kirkham A, Nixon SJ, Walser P, Abankwa D, Oorschot VM, Martin S, Hancock JF, Parton RG. PTRF-cavin, a conserved cytoplasmic protein required for caveola formation and function. Cell. 2008; 132:113–24. https://doi.org/10.1016/j.cell.2007.11.042 [PubMed]
- 8. McMahon KA, Zajicek H, Li WP, Peyton MJ, Minna JD, Hernandez VJ, Luby-Phelps K, Anderson RG. SRBC/cavin-3 is a caveolin adapter protein that regulates caveolae function. EMBO J. 2009; 28:1001–15. https://doi.org/10.1038/emboj.2009.46 [PubMed]
- 9. Hansen CG, Bright NA, Howard G, Nichols BJ. SDPR induces membrane curvature and functions in the formation of caveolae. Nat Cell Biol. 2009; 11:807–14. https://doi.org/10.1038/ncb1887 [PubMed]
- 10. Karbalaei MS, Rippe C, Albinsson S, Ekman M, Mansten A, Uvelius B, Swärd K. Impaired contractility and detrusor hypertrophy in cavin-1-deficient mice. Eur J Pharmacol. 2012; 689:179–85. https://doi.org/10.1016/j.ejphar.2012.05.023 [PubMed]
- 11. Bai L, Shi G, Zhang L, Guan F, Ma Y, Li Q, Cong YS, Zhang L. Cav-1 deletion impaired hematopoietic stem cell function. Cell Death Dis. 2014; 5:e1140. https://doi.org/10.1038/cddis.2014.105 [PubMed]
- 12. Baker N, Tuan RS. The less-often-traveled surface of stem cells: caveolin-1 and caveolae in stem cells, tissue repair and regeneration. Stem Cell Res Ther. 2013; 4:90. https://doi.org/10.1186/scrt276 [PubMed]
- 13. Jansa P, Mason SW, Hoffmann-Rohrer U, Grummt I. Cloning and functional characterization of PTRF, a novel protein which induces dissociation of paused ternary transcription complexes. EMBO J. 1998; 17:2855–64. https://doi.org/10.1093/emboj/17.10.2855 [PubMed]
- 14. Liu L, Brown D, McKee M, Lebrasseur NK, Yang D, Albrecht KH, Ravid K, Pilch PF. Deletion of cavin/PTRF causes global loss of caveolae, dyslipidemia, and glucose intolerance. Cell Metab. 2008; 8:310–17. https://doi.org/10.1016/j.cmet.2008.07.008 [PubMed]
- 15. Rajab A, Straub V, McCann LJ, Seelow D, Varon R, Barresi R, Schulze A, Lucke B, Lützkendorf S, Karbasiyan M, Bachmann S, Spuler S, Schuelke M. Fatal cardiac arrhythmia and long-QT syndrome in a new form of congenital generalized lipodystrophy with muscle rippling (CGL4) due to PTRF-CAVIN mutations. PLoS Genet. 2010; 6:e1000874. https://doi.org/10.1371/journal.pgen.1000874 [PubMed]
- 16. Hayashi YK, Matsuda C, Ogawa M, Goto K, Tominaga K, Mitsuhashi S, Park YE, Nonaka I, Hino-Fukuyo N, Haginoya K, Sugano H, Nishino I. Human PTRF mutations cause secondary deficiency of caveolins resulting in muscular dystrophy with generalized lipodystrophy. J Clin Invest. 2009; 119:2623–33. https://doi.org/10.1172/JCI38660 [PubMed]
- 17. Bai L, Deng X, Li J, Wang M, Li Q, An W, A D, Cong YS. Regulation of cellular senescence by the essential caveolar component PTRF/Cavin-1. Cell Res. 2011; 21:1088–101. https://doi.org/10.1038/cr.2011.56 [PubMed]
- 18. Bai L, Deng X, Li Q, Wang M, An W, Deli A, Gao Z, Xie Y, Dai Y, Cong YS. Down-regulation of the cavin family proteins in breast cancer. J Cell Biochem. 2012; 113:322–28. https://doi.org/10.1002/jcb.23358 [PubMed]
- 19. Li Q, Bai L, Shi G, Zhang L, Dai Y, Liu P, Cong YS, Wang M. Ptrf transgenic mice exhibit obesity and fatty liver. Clin Exp Pharmacol Physiol. 2018; 45:704–10. https://doi.org/10.1111/1440-1681.12920 [PubMed]
- 20. Low JY, Nicholson HD. Emerging role of polymerase-1 and transcript release factor (PTRF/ cavin-1) in health and disease. Cell Tissue Res. 2014; 357:505–13. https://doi.org/10.1007/s00441-014-1964-z [PubMed]
- 21. Debacq-Chainiaux F, Erusalimsky JD, Campisi J, Toussaint O. Protocols to detect senescence-associated beta-galactosidase (SA-betagal) activity, a biomarker of senescent cells in culture and in vivo. Nat Protoc. 2009; 4:1798–806. https://doi.org/10.1038/nprot.2009.191 [PubMed]
- 22. Li Q, Bai L, Liu N, Wang M, Liu JP, Liu P, Cong YS. Increased polymerase I and transcript release factor (Cavin-1) expression attenuates platelet-derived growth factor receptor signalling in senescent human fibroblasts. Clin Exp Pharmacol Physiol. 2014; 41:169–73. https://doi.org/10.1111/1440-1681.12202 [PubMed]
- 23. Park IK, Qian D, Kiel M, Becker MW, Pihalja M, Weissman IL, Morrison SJ, Clarke MF. Bmi-1 is required for maintenance of adult self-renewing haematopoietic stem cells. Nature. 2003; 423:302–05. https://doi.org/10.1038/nature01587 [PubMed]
- 24. Kondo M, Weissman IL, Akashi K. Identification of clonogenic common lymphoid progenitors in mouse bone marrow. Cell. 1997; 91:661–72. https://doi.org/10.1016/s0092-8674(00)80453-5 [PubMed]
- 25. Cheshier SH, Morrison SJ, Liao X, Weissman IL. In vivo proliferation and cell cycle kinetics of long-term self-renewing hematopoietic stem cells. Proc Natl Acad Sci USA. 1999; 96:3120–25. https://doi.org/10.1073/pnas.96.6.3120 [PubMed]
- 26. Pervaiz S, Taneja R, Ghaffari S. Oxidative stress regulation of stem and progenitor cells. Antioxid Redox Signal. 2009; 11:2777–89. https://doi.org/10.1089/ars.2009.2804 [PubMed]
- 27. Krishnamurthy J, Torrice C, Ramsey MR, Kovalev GI, Al-Regaiey K, Su L, Sharpless NE. Ink4a/arf expression is a biomarker of aging. J Clin Invest. 2004; 114:1299–307. https://doi.org/10.1172/JCI22475 [PubMed]
- 28. Ressler S, Bartkova J, Niederegger H, Bartek J, Scharffetter-Kochanek K, Jansen-Dürr P, Wlaschek M. p16INK4A is a robust in vivo biomarker of cellular aging in human skin. Aging Cell. 2006; 5:379–89. https://doi.org/10.1111/j.1474-9726.2006.00231.x [PubMed]
- 29. Liu Y, Elf SE, Miyata Y, Sashida G, Liu Y, Huang G, Di Giandomenico S, Lee JM, Deblasio A, Menendez S, Antipin J, Reva B, Koff A, Nimer SD. P53 regulates hematopoietic stem cell quiescence. Cell Stem Cell. 2009; 4:37–48. https://doi.org/10.1016/j.stem.2008.11.006 [PubMed]
- 30. Galbiati F, Volonté D, Liu J, Capozza F, Frank PG, Zhu L, Pestell RG, Lisanti MP. Caveolin-1 expression negatively regulates cell cycle progression by inducing G(0)/G(1) arrest via a p53/p21(WAF1/Cip1)-dependent mechanism. Mol Biol Cell. 2001; 12:2229–44. https://doi.org/10.1091/mbc.12.8.2229 [PubMed]
- 31. Volonte D, Zhang K, Lisanti MP, Galbiati F. Expression of caveolin-1 induces premature cellular senescence in primary cultures of murine fibroblasts. Mol Biol Cell. 2002; 13:2502–17. https://doi.org/10.1091/mbc.01-11-0529 [PubMed]
- 32. Bartholomew JN, Volonte D, Galbiati F. Caveolin-1 regulates the antagonistic pleiotropic properties of cellular senescence through a novel Mdm2/p53-mediated pathway. Cancer Res. 2009; 69:2878–86. https://doi.org/10.1158/0008-5472.CAN-08-2857 [PubMed]