


Introduction
Hepatocellular carcinoma (HCC) is the most common primary liver cancer in adults, and is the leading cause of cancer-related mortality worldwide [1, 2]. It is well-known that HCC is a group of highly heterogeneous diseases, and the prognosis of individual patients varies greatly [2]. Clinically, tumor stage, histological grade, and molecular subtype are used to evaluate prognostic factors of patients with HCC. However, these clinicopathological features cannot accurately provide information to predict the prognosis, which may lead to inaccurate judgment regarding the prognosis and inappropriate treatment of patients [3, 4]. Therefore, there is an urgent need to identify new molecular markers to predict the prognosis of patients with HCC, which would be conducive in terms of accurate patient treatment.
Metabolic reprogramming is considered a new feature of cancer cells [5]. Catabolism and anabolism are key to cancer cells, which ensure their energy supply and biomass synthesis by reprogramming their microenvironment [6–8]. Numerous major metabolic pathways occur in the liver, including glycolysis, tricarboxylic acid cycle, oxidative phosphorylation, and amino acid catabolism [9]. Therefore, elucidating the relationships involving metabolism and HCC is essential for understanding the pathogenic mechanisms in tumorigenesis [10]. Previous studies have discussed the important role of metabolic disorders in cancer biology [11–13]. However, systemic metabolic reprogramming and its prognostic value in the progress of HCC need further study.
In this study, we used mRNA expression data of patients with HCC from The Cancer Genome Atlas (TCGA) database to develop a metabolic prognostic signature. These metabolism-related risk signatures can independently and effectively identify patients with HCC at a high-risk of unfavorable outcomes. In addition, performing gene set enrichment analysis (GSEA) determined the most relevant biological processes and metabolic pathways involved in the pathological process of HCC establishment. These results may provide new ideas for studying the prognosis of HCC, and for individualized metabolic treatment.
Results
TCGA HCC dataset profile
We downloaded the data of 371 HCC cases from TCGA database, including 50 normal datasets and 374 tumor datasets. The tumor datasets were then randomly divided into a training set (n = 249) and a testing set (n = 125). After removal of cases with survival time < 30 days, or incomplete clinical information, a total of 221 cases with identified clinical characteristics were enrolled in this study. Clinical information concerning the patients in the training and testing sets is presented in Table 1. There were no statistical differences regarding clinical data between training and testing sets (P-value > 0.05).
Table 1. Clinical characteristics of patients.
| Variables | Training set (n=148) | Testing set (n=73) | Entire set (n=221) | P-value | |||||||||||||||||||||||||||||||||||||||||||||||||||||||||||||||||||||||||||||||||||||||||||||||
| Age, n (%) | 0.052 | ||||||||||||||||||||||||||||||||||||||||||||||||||||||||||||||||||||||||||||||||||||||||||||||||||
| < 65 yrs | 95 (64.19) | 53 (72.60) | 148 (66.97) | ||||||||||||||||||||||||||||||||||||||||||||||||||||||||||||||||||||||||||||||||||||||||||||||||
| ≥ 65 yrs | 53 (35.81) | 20 (27.40) | 73 (33.03) | ||||||||||||||||||||||||||||||||||||||||||||||||||||||||||||||||||||||||||||||||||||||||||||||||
| Gender, n (%) | 0.709 | ||||||||||||||||||||||||||||||||||||||||||||||||||||||||||||||||||||||||||||||||||||||||||||||||||
| Female | 45 (30.41) | 24 (32.88) | 69 (31.22) | ||||||||||||||||||||||||||||||||||||||||||||||||||||||||||||||||||||||||||||||||||||||||||||||||
| Male | 103 (69.59) | 49 (67.12) | 152 (68.78) | ||||||||||||||||||||||||||||||||||||||||||||||||||||||||||||||||||||||||||||||||||||||||||||||||
| Futime, (25%-75%) | 558 (351-1457) | 612 (408-1145) | 581 (364-1323) | 0.393 | |||||||||||||||||||||||||||||||||||||||||||||||||||||||||||||||||||||||||||||||||||||||||||||||
| Fustat, n (%) | 0.242 | ||||||||||||||||||||||||||||||||||||||||||||||||||||||||||||||||||||||||||||||||||||||||||||||||||
| alive | 98 (66.22) | 54 (73.97) | 152 (68.78) | ||||||||||||||||||||||||||||||||||||||||||||||||||||||||||||||||||||||||||||||||||||||||||||||||
| dead | 50 (33.78) | 19 (26.03) | 69 (31.22) | ||||||||||||||||||||||||||||||||||||||||||||||||||||||||||||||||||||||||||||||||||||||||||||||||
| Grade, n (%) | 0.377 | ||||||||||||||||||||||||||||||||||||||||||||||||||||||||||||||||||||||||||||||||||||||||||||||||||
| G1 | 16 (10.81) | 11 (15.07) | 27 (12.22) | ||||||||||||||||||||||||||||||||||||||||||||||||||||||||||||||||||||||||||||||||||||||||||||||||
| G2 | 70 (47.30) | 26 (35.62) | 96 (43.44) | ||||||||||||||||||||||||||||||||||||||||||||||||||||||||||||||||||||||||||||||||||||||||||||||||
| G3 | 55 (37.16) | 33 (45.21) | 88 (39.82) | ||||||||||||||||||||||||||||||||||||||||||||||||||||||||||||||||||||||||||||||||||||||||||||||||
| G4 | 7 (4.73) | 3 (4.11) | 10 (4.52) | ||||||||||||||||||||||||||||||||||||||||||||||||||||||||||||||||||||||||||||||||||||||||||||||||
| Stage, n (%) | 0.456 | ||||||||||||||||||||||||||||||||||||||||||||||||||||||||||||||||||||||||||||||||||||||||||||||||||
| Stage I | 70 (47.30) | 38 (52.05) | 108 (48.87) | ||||||||||||||||||||||||||||||||||||||||||||||||||||||||||||||||||||||||||||||||||||||||||||||||
| Stage II | 36 (24.32) | 10 (13.70) | 46 (20.81) | ||||||||||||||||||||||||||||||||||||||||||||||||||||||||||||||||||||||||||||||||||||||||||||||||
| Stage III | 40 (27.03) | 24 (32.88) | 64 (28.96) | ||||||||||||||||||||||||||||||||||||||||||||||||||||||||||||||||||||||||||||||||||||||||||||||||
| Stage IV | 2 (1.35) | 1 (1.37) | 3 (1.36) | ||||||||||||||||||||||||||||||||||||||||||||||||||||||||||||||||||||||||||||||||||||||||||||||||
| T, n (%) | 0.401 | ||||||||||||||||||||||||||||||||||||||||||||||||||||||||||||||||||||||||||||||||||||||||||||||||||
| T1 | 71 (47.97) | 38 (52.05) | 109 (49.32) | ||||||||||||||||||||||||||||||||||||||||||||||||||||||||||||||||||||||||||||||||||||||||||||||||
| T2 | 37 (25.00) | 10 (13.70) | 47 (21.27) | ||||||||||||||||||||||||||||||||||||||||||||||||||||||||||||||||||||||||||||||||||||||||||||||||
| T3 | 32 (21.62) | 23 (31.51) | 55 (24.89) | ||||||||||||||||||||||||||||||||||||||||||||||||||||||||||||||||||||||||||||||||||||||||||||||||
| T4 | 8 (5.41) | 2 (2.74) | 10 (4.52) | ||||||||||||||||||||||||||||||||||||||||||||||||||||||||||||||||||||||||||||||||||||||||||||||||
| M, n (%) | 0.991 | ||||||||||||||||||||||||||||||||||||||||||||||||||||||||||||||||||||||||||||||||||||||||||||||||||
| M0 | 146 (98.65) | 72 (98.63) | 218 (98.64) | ||||||||||||||||||||||||||||||||||||||||||||||||||||||||||||||||||||||||||||||||||||||||||||||||
| M1 | 2 (1.35) | 1 (1.37) | 3 (1.36) | ||||||||||||||||||||||||||||||||||||||||||||||||||||||||||||||||||||||||||||||||||||||||||||||||
| N, n (%) | 0.991 | ||||||||||||||||||||||||||||||||||||||||||||||||||||||||||||||||||||||||||||||||||||||||||||||||||
| N0 | 146 (98.65) | 72 (98.63) | 218 (98.64) | ||||||||||||||||||||||||||||||||||||||||||||||||||||||||||||||||||||||||||||||||||||||||||||||||
| N1 | 2 (1.35) | 1 (1.37) | 3 (1.36) | ||||||||||||||||||||||||||||||||||||||||||||||||||||||||||||||||||||||||||||||||||||||||||||||||
| Abbreviations: T: Tumor; N: Node (regional lymph node); M: Metastasis. | |||||||||||||||||||||||||||||||||||||||||||||||||||||||||||||||||||||||||||||||||||||||||||||||||||
| P-value > 0.05 indicates that there is no statistical difference in clinical data between training group and testing group. | |||||||||||||||||||||||||||||||||||||||||||||||||||||||||||||||||||||||||||||||||||||||||||||||||||
Identification of differentially expressed metabolic genes in the training set
A total of 944 metabolic genes were extracted from the training set. After screening, we identified 173 differentially expressed metabolic genes in the tumor dataset, compared with the normal dataset, including 147 upregulated and 26 downregulated metabolic genes, using | logFC | > 1.5, P-value < 0.05, FDR < 0.05 as the screening criteria. The top 10 differentially expressed metabolic genes are illustrated in Table 2. A heat map representing these differentially expressed metabolic genes is shown in Figure 1.
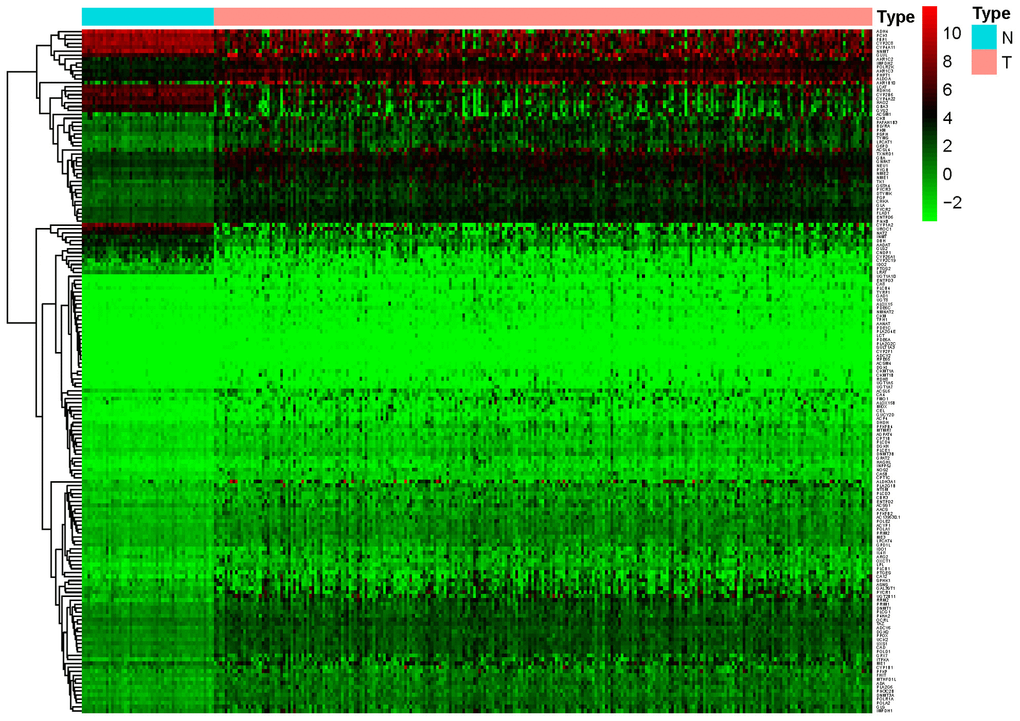
Figure 1. Heat map of differentially expressed genes in the training set. A total of 147 upregulated and 26 downregulated metabolic genes were identified in the tumor dataset compared to the normal dataset, using | logFC |> 1.5, P-value < 0.05, FDR < 0.05 as the screening criteria.
Table 2. The top 10 up-regulated and down-regulated genes.
| Gene | ConMean | TreatMean | LogFC | P-Value | FDR |
| Down-regulated genes | |||||
| CYP26A1 | 6.5695 | 0.655653 | -3.32478 | 1.44E-20 | 1.14E-19 |
| CNDP1 | 6.560749 | 0.894874 | -2.8741 | 4.44E-22 | 4.50E-21 |
| CYP2C19 | 3.085339 | 0.430674 | -2.84076 | 1.36E-15 | 5.00E-15 |
| CYP1A2 | 162.061 | 24.16823 | -2.74535 | 3.90E-23 | 5.74E-22 |
| DBH | 10.7885 | 1.70276 | -2.66355 | 1.51E-23 | 2.50E-22 |
| NAT2 | 25.52141 | 4.919365 | -2.37516 | 1.94E-24 | 4.92E-23 |
| LRAT | 1.0943 | 0.223422 | -2.29217 | 5.65E-24 | 1.21E-22 |
| CYP2C8 | 449.4618 | 92.74891 | -2.2768 | 1.96E-25 | 9.03E-24 |
| AADAT | 11.03725 | 2.482022 | -2.15279 | 5.26E-24 | 1.15E-22 |
| LCAT | 68.11541 | 16.46416 | -2.04865 | 4.16E-25 | 1.53E-23 |
| Up-regulated genes | |||||
| CEL | 0.033783 | 0.597751 | 4.145164 | 6.33E-15 | 2.15E-14 |
| TYRP1 | 0.0086 | 0.1793 | 4.381821 | 2.01E-04 | 2.79E-04 |
| CKMT1A | 0.006888 | 0.150314 | 4.447752 | 6.00E-07 | 1.03E-06 |
| MIOX | 0.025308 | 0.650612 | 4.684158 | 8.17E-11 | 1.92E-10 |
| ACP4 | 0.013881 | 0.386036 | 4.797518 | 7.10E-12 | 1.87E-11 |
| CKMT1B | 0.007145 | 0.224978 | 4.976801 | 8.85E-04 | 1.17E-03 |
| GAD1 | 0.002933 | 0.122091 | 5.379313 | 4.09E-14 | 1.32E-13 |
| ALDH3A1 | 0.752937 | 44.25674 | 5.877225 | 3.85E-04 | 5.21E-04 |
| UGT1A10 | 0.00825 | 0.673831 | 6.351786 | 1.26E-03 | 1.64E-03 |
| RDH8 | 0.002213 | 0.222531 | 6.652179 | 3.41E-07 | 5.94E-07 |
Identification of prognosis-associated metabolic genes
In order to identify genes most closely related to prognosis in HCC, univariate Cox regression analysis was performed with the P-value strictly set to 0.001. A total of 8 prognosis-associated metabolic genes were identified in the training set, including POLA1, RRM2, UCK2, CAD, ACYP1, G6PD, ENTPD2 and TXNRD1. The hazard ratio (HR) of these genes were > 1, which indicated that these genes were associated with higher risk of poor overall survival outcomes (Table 3 and Figure 2).
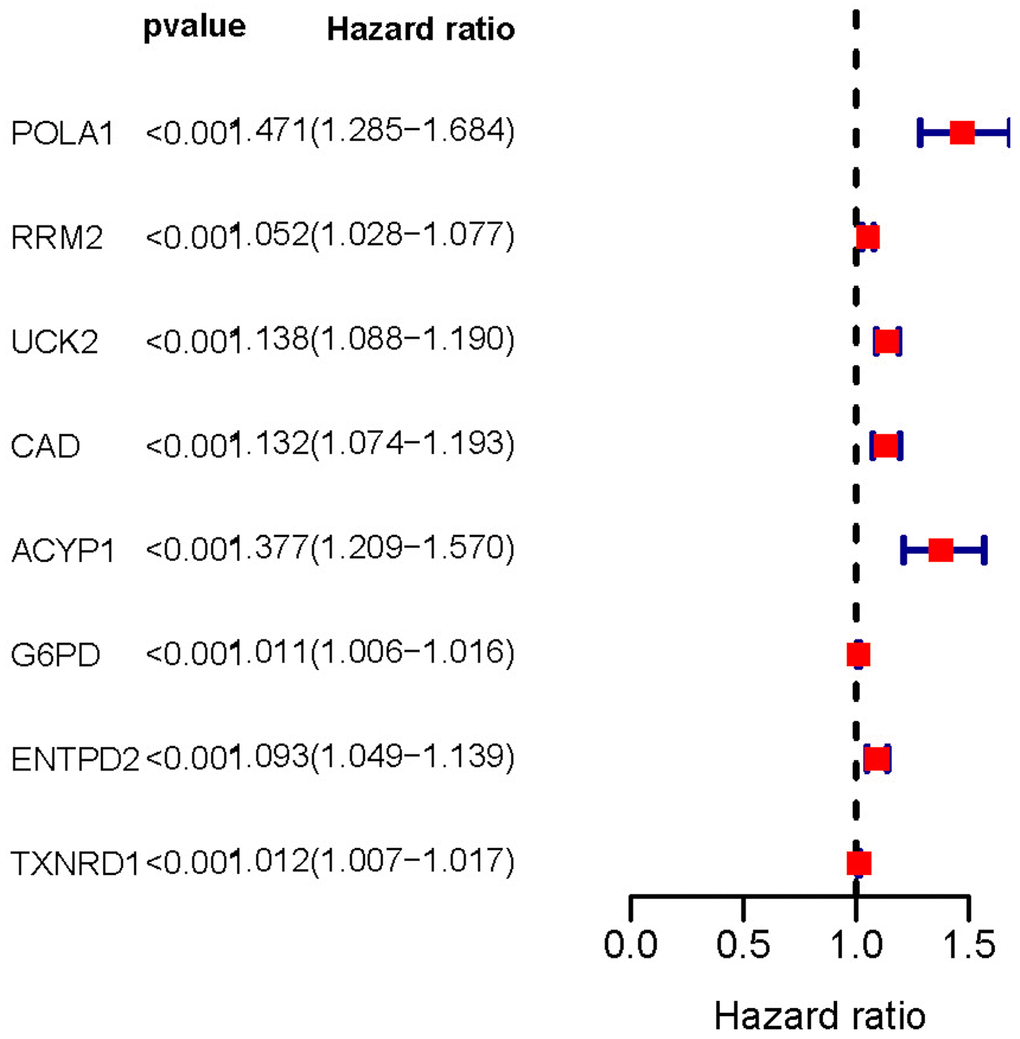
Figure 2. Forest plot of prognosis-related metabolic genes screened using univariate Cox regression analysis. The hazard ratio of these genes was > 1 indicating poor overall survival outcomes. P-value < 0.001.
Table 3. Prognostic associated metabolic genes.
| ID | HR | HR.95L | HR.95H | P-value |
| POLA1 | 1.470951 | 1.284508 | 1.684457 | 2.40E-08 |
| RRM2 | 1.052166 | 1.027998 | 1.076901 | 1.79E-05 |
| UCK2 | 1.137793 | 1.088132 | 1.189719 | 1.43E-08 |
| CAD | 1.132149 | 1.074487 | 1.192906 | 3.26E-06 |
| ACYP1 | 1.37746 | 1.208838 | 1.569603 | 1.53E-06 |
| G6PD | 1.010954 | 1.006035 | 1.015896 | 1.20E-05 |
| ENTPD2 | 1.092836 | 1.048756 | 1.13877 | 2.38E-05 |
| TXNRD1 | 1.012026 | 1.006645 | 1.017436 | 1.11E-05 |
Construction of LASSO Cox regression model
A total of five prognosis-associated metabolic genes were enrolled in the LASSO Cox regression model, including POLA1, UCK2, ACYP1, ENTPD2 and TXNRD1. The risk score = 0.224526000042292 *expression of POLA1 + 0.0430802421098465 *expression of UCK2 + 0.133617317495605 *expression of ACYP1 + 0.0735585351730793 *expression of ENTPD2 + 0.00710372438454236 *expression of TXNRD1. Patients were divided into high and low-risk groups based on the median risk score of the training set.
Validation of training set survival analysis by utilizing testing set data
Kaplan-Meier analysis demonstrated that high-risk group members had a worse overall survival outcome compared to the low-risk group, in both the training (Figure 3A) and testing sets (Figure 3B). The P-values were < 0.05, which validated the effectiveness of the risk score in survival analysis based on the LASSO Cox regression model. Additionally, data from the Gene Expression Omnibus (GEO) database showed that the high-risk group had a poorer overall survival outcome (Supplementary Figure 1).
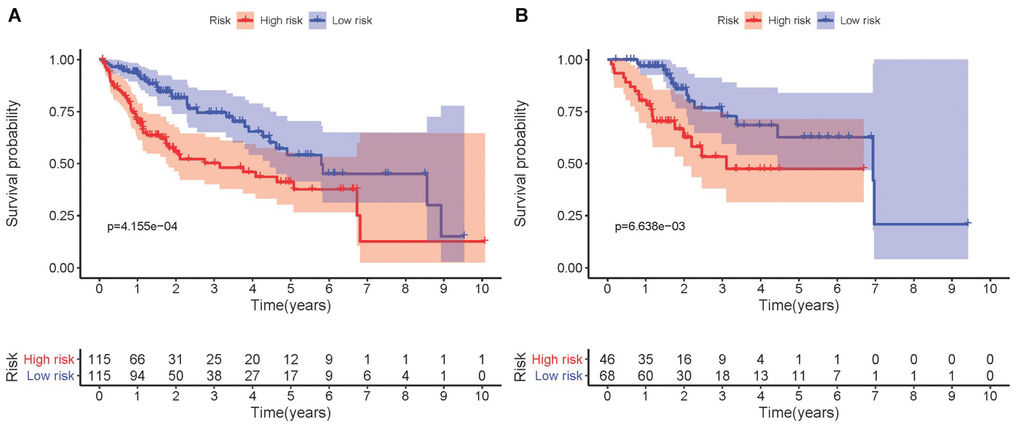
Figure 3. Kaplan-Meier survival analysis involving prognostic metabolic genes in HCC. (A) Kaplan-Meier curve of the training set. (B) Kaplan-Meier curve of the testing set. P-values were < 0.05, indicating that overall survival was significantly different between patients at high- and low-risk.
Validation of risk score, survival status distribution, and heat map of the training set utilizing testing set data
Each patient was ranked based on their risk score (top of Figure 4A, 4B). The risk score was elevated from left to right in both the training and testing sets. The distribution of the survival status of each patient demonstrated that the higher the risk score, the shorter the survival time and the fewer surviving patients in both the training and testing sets (middle of Figure 4A, 4B). Heat maps showed that the expression of the five prognostic genes was upregulated in high-risk groups in both the training and testing sets (bottom of Figure 4A, 4B). Validation of risk score, survival status distribution, and heat map generation using TCGA data were also performed by utilizing data from the GEO database. The result further confirmed the prognostic value of the risk score (Supplementary Figure 2).
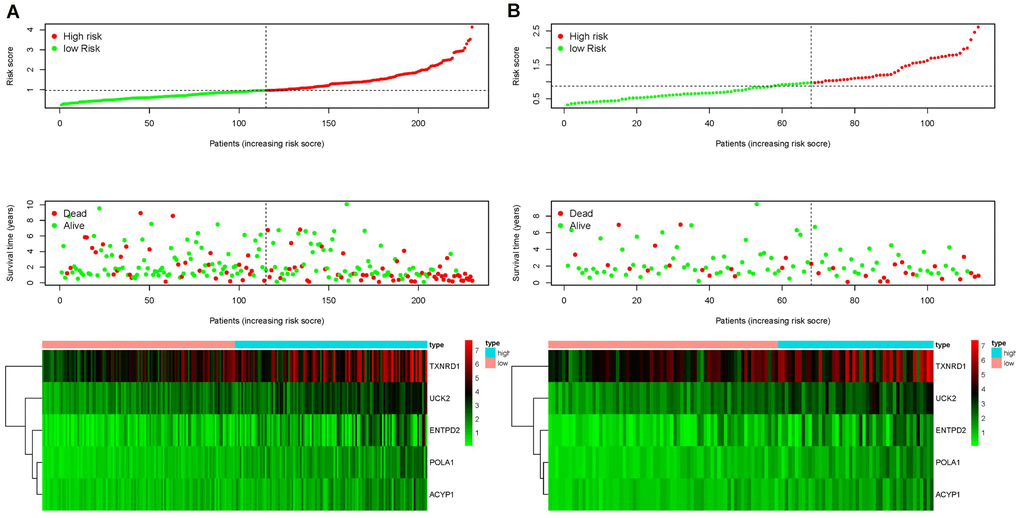
Figure 4. Ranking of risk scores, survival status distribution, and heat map for prognosis-associated metabolic genes of patients with HCC in the training set (A) and testing set (B), which demonstrated that the higher the risk score, the shorter the survival time and fewer the surviving patients, and the expression of the five prognostic genes was upregulated in high-risk groups in both the training and testing sets.
Univariate and multivariate Cox analysis
Univariate and multivariate Cox regression analyses were conducted to test whether the prognostic ability of the five metabolic genes was independent of clinical data in both the training and testing sets. For each dataset, we included age, gender, tumor grade, tumor stage, TNM staging, and risk score as explanatory variables. Univariate Cox regression analysis demonstrated that the risk score was related to the poor overall survival of patients with HCC (HR training set= 3.471, HR testing set = 4.373, P-value < 0.05). As the risk score increased, the risk of poor survival outcomes elevated (Figure 5A, 5D). The results of multivariate Cox regression analysis showed that the risk score could be treated as an independent risk factor to predict overall survival outcome in patients with HCC (HR training set= 3.200, HR testing set = 4.993, P-value < 0.05, Figure 5B, 5E). Receiver operating characteristic (ROC) analysis was performed to evaluate the efficacy of the multivariate Cox regression analysis. The area under the curve (AUC) of the risk score from the ROC curve was higher compared to other clinical characteristics (AUC training set = 0.845, AUC testing set = 0.786), implying a robust prognostic capacity of the constructed predictive model in predicting overall survival (Figure 5C, 5E).
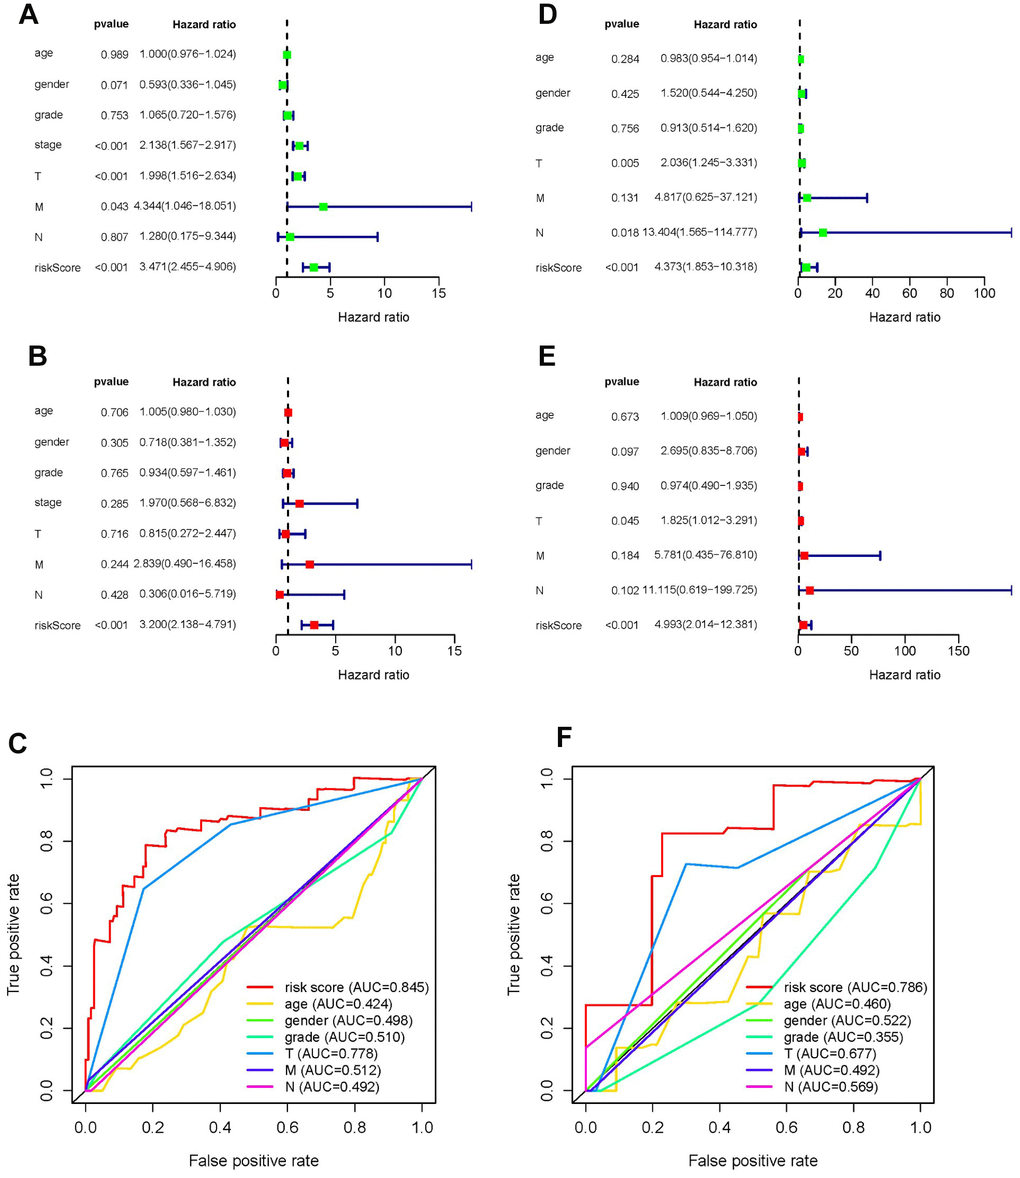
Figure 5. Forrest plot of univariate and multivariate Cox regression analyses, and evaluation of receiver operating curve (ROC) analysis in HCC. Forrest plot of univariate Cox regression analysis of the training set (A) and training set (D). Forrest plot of multivariate Cox regression analysis of the training set (B) and testing set (E). ROC analysis of the training set (C) and training set (F).
Gene Ontology (GO) and Kyoto Encyclopedia of Genes and Genomes (KEGG) analyses of the five metabolic genes
To determine the biological implications of the five metabolic genes, KEGG pathway and GO term analyses were performed. KEGG pathway analysis results showed that these five genes were associated with DNA replication and pyruvate metabolism. GO term enrichment indicated that the five genes were associated with nucleobase metabolic process such as pyrimidine nucleobase metabolic processes, DNA strand elongation, nucleoside kinase activity, and DNA polymerase activity (Table 4). Enrichment analyses demonstrated that the five metabolic genes may affect the prognosis of patients with HCC by inducing tumor cell proliferation.
Table 4. GO and KEGG analyses of the five metabolic genes.
| Term | P-value | |
| KEGG Pathway | DNA replication | 8.97E-03 |
| Pyruvate metabolism | 9.71E-03 | |
| GO-BP | nucleobase metabolic process | 1.50E-03 |
| pyrimidine nucleobase metabolic process | 2.00E-03 | |
| lagging strand elongation | 2.00E-03 | |
| pyrimidine nucleoside salvage | 3.00E-03 | |
| pyrimidine-containing compound salvage | 3.00E-03 | |
| DNA strand elongation | 3.25E-03 | |
| nucleoside salvage | 3.50E-03 | |
| pyrimidine nucleoside biosynthetic process | 3.74E-03 | |
| pyrimidine-containing compound metabolic process | 3.74E-03 | |
| nucleobase-containing small molecule catabolic process | 3.74E-03 | |
| GO-MF | nucleoside kinase activity | 3.50E-03 |
| DNA-directed DNA polymerase activity | 4.99E-03 | |
| DNA polymerase activity | 5.24E-03 | |
| nucleobase-containing compound kinase activity | 7.48E-03 |
External validation using online database
Consistent with our results, POLA1, UCK2, ACYP1, ENTPD2 and TXNRD1 were found to be significantly overexpressed at the mRNA level in HCC in the TIMER database (Figure 6). Protein expression, as evaluated using immunohistochemical staining, was explored using the Human Protein Atlas (HPA), which showed that POLA1, ACYP1, ENTPD2 and TXNRD1 were overexpressed in HCC (Figure 7A). UCK2 protein expression was not identified in HPA. However, genetic alterations curated in the cBioportal database demonstrate that UCK2 possesses the most frequent amplification mutation in HCC (Figure 7B). Taken together, aberrant expression of the five genes in HCC was further validated.
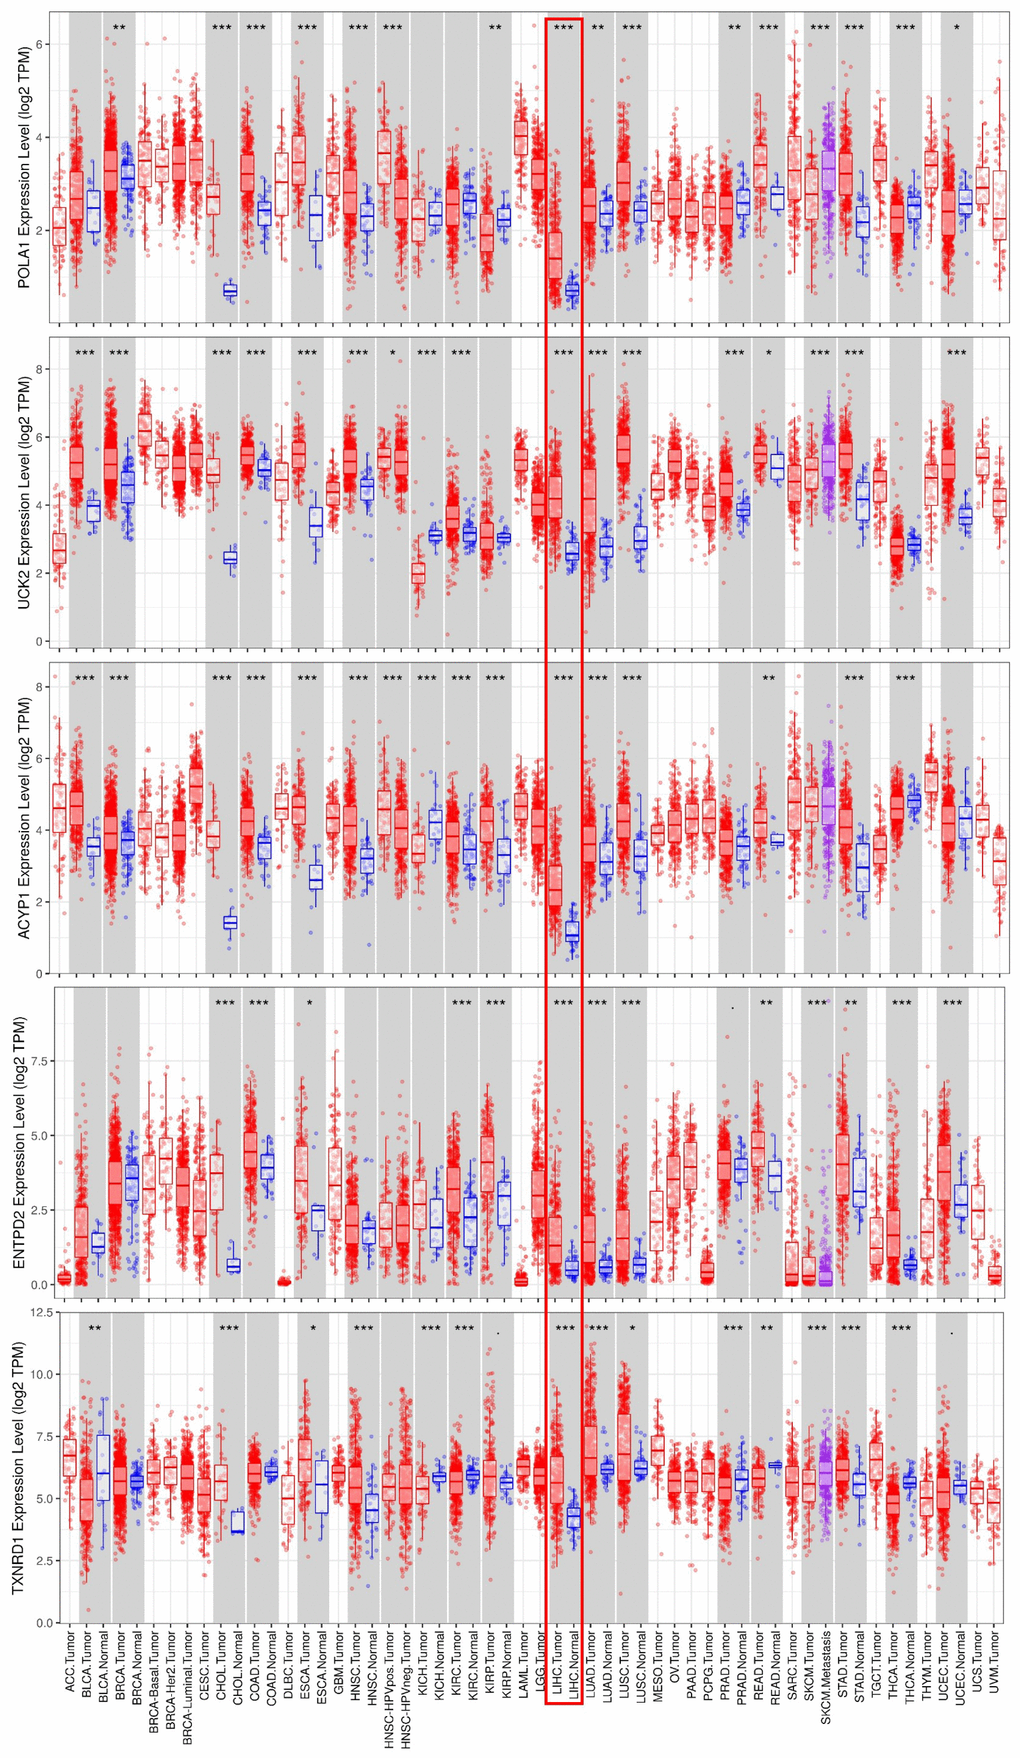
Figure 6. mRNA expression of the five prognosis-related metabolic genes in cancers. Data are from the TIMER database (https://cistrome.shinyapps.io/timer/) [50]. The expression of POLA1, UCK2, ACYP1, ENTPD2 and TXNRD1 was significantly upregulated at the mRNA level in HCC.
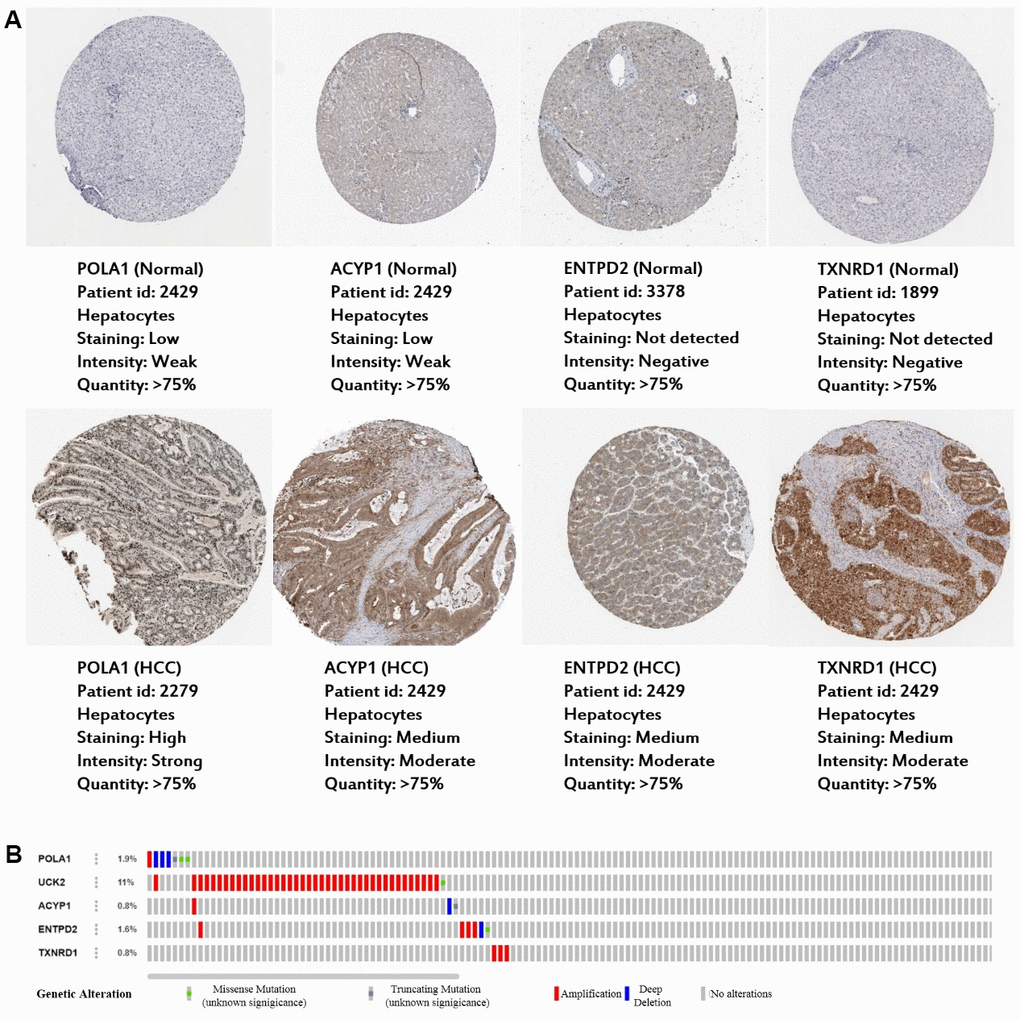
Figure 7. Expression and genetic alterations in the five prognosis-related metabolic genes. (A) The representative protein expression of the four genes in HCC and normal liver tissues. Data are from the Human Protein Atlas (http://www.proteinatlas.org) [51] database. Data for UCK2 were not found in the database. (B) Genetic alterations to the five genes in TCGA-LIHC. Data are from the cBioportal for Cancer Genomics (http://www.cbioportal.org/) [52, 53].
GO and KEGG analyses of high-risk patient genes using GSEA
To explore the potential mechanism of HCC pathological process, GO and KEGG analyses via GSEA were performed using the training set. The results of GO analysis demonstrated that genes of high-risk patients were mainly enriched in gene silencing, regulation of gene expression epigenetic, regulation of cell cycle phase transition, mitotic nuclear division, and mRNA processing, whereas genes of low-risk patients were mainly enriched in monocarboxylic acid catabolic process, protein activation cascade, fatty acid catabolic process, alpha amino acid catabolic process, and regulation of lipoprotein lipase activity (Figure 8A). The results of KEGG analysis showed that genes of high-risk patients were mainly enriched in cell cycle, p53 signaling pathway, RNA degradation, pyrimidine metabolism, and base excision repair. Genes of low-risk patients were mainly enriched in fatty acid metabolism, primary bile acid biosynthesis, peroxisome proliferator-activated receptor signaling pathway, retinol metabolism, and glycine, serine, and threonine metabolism. (Figure 8B).
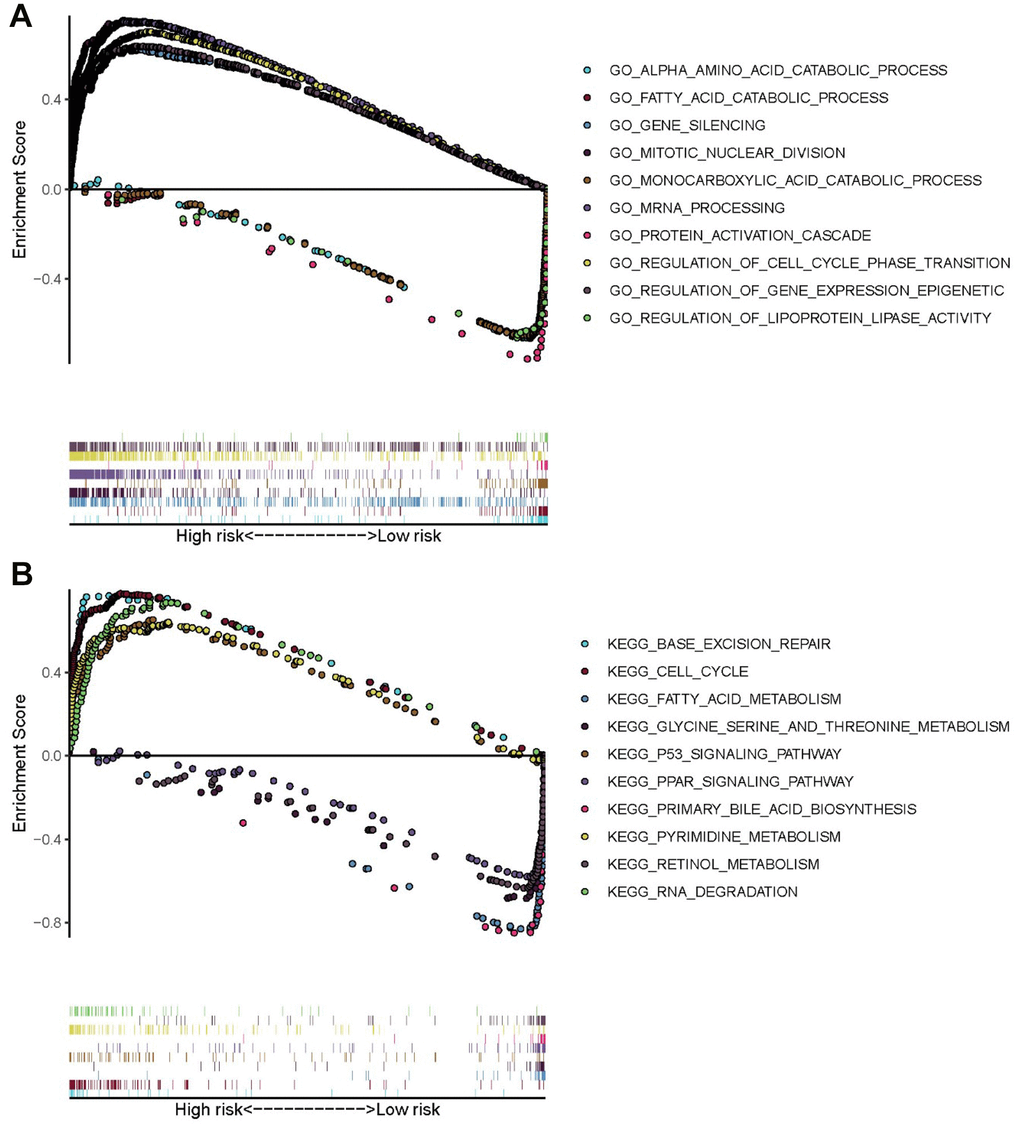
Figure 8. GO and KEGG enrichment analyses via GSEA of the training set. (A) Top five GO terms in high- and low-risk patients. (B) Five representative metabolism-associated KEGG pathways in high- and low-risk patients. The curves above the abscissa represent GO terms and KEGG pathways enriched by genes in high-risk patients.
Development of a nomogram
Based on these results, we developed a predictive model, and generated a graphical nomogram with the training set data. Risk scores, combined with other clinical information, including age, gender, tumor grade, TNM staging, were incorporated into the nomogram to predict the probability of 1-, 2- and 3-year survival of patients with HCC (Figure 9). The C-index was 0.70, 0.77, and 0.83 for the T stage, risk score, and nomogram, respectively. The AUC of the nomogram for 1-, 2-, and 3-year OS were 0.91, 0.88 and 0.89, respectively (Table 5). This indicated that combining our prognostic signature with TNM staging increased the AUC for predicting 1-, 2-, and 3-year OS.
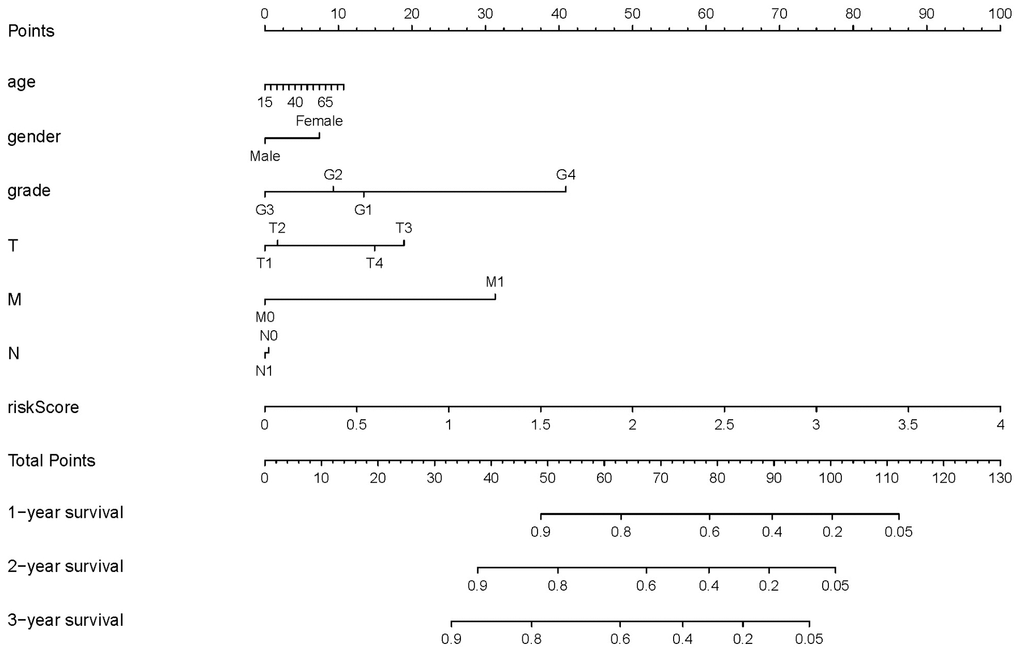
Figure 9. Nomogram for predicting the survival of patients with HCC. A straight line was drawn up to the axis labeled Points to determine the corresponding points. This process was repeated for each of the remaining axes, drawing a straight line each time to the Points axis. The points received for each predictive variable were added and this number was located on the Total Points axis. A straight line was drawn down from the Total Points to the 1-, 2- and 3-year survival axes to determine the predicted survival probabilities of patients.
Table 5. Comparison of the nomogram with the TNM and risk score.
| Model | T | N | M | risk score | Nomogram |
| 1-year AUC | 0.77 | 0.49 | 0.51 | 0.80 | 0.91 |
| 2-year AUC | 0.71 | 0.49 | 0.51 | 0.78 | 0.88 |
| 3-year AUC | 0.75 | 0.49 | 0.52 | 0.75 | 0.89 |
| C-index | 0.70 | 0.51 | 0.50 | 0.77 | 0.83 |
Discussion
Metabolic deregulation as an emerging cancer cell hallmark
HCC is the most common primary liver cancer, and the third leading cause of cancer deaths worldwide [14]. Due to limited symptoms in the early stages, and limitation of current biomarkers, 75% of patients with HCC are usually diagnosed at an advanced stage, with a pessimistic overall survival rate [15]. Additionally, the treatment responses of patients in advanced stages are usually poor [16]. Hence, it is essential to diagnose HCC at the early stage, and there is an urgent need to develop novel diagnostic or prognostic biomarkers for HCC. Compelling evidence has suggested that metabolic deregulation is an emerging hallmark of cancer cells because of its important roles in cell growth, proliferation, angiogenesis, and invasion [17]. Accumulating evidence demonstrates that the metabolic alterations in neoplastic cells are closely related to mortality risk in cancer [18, 19]. Based on this, we screened five novel prognosis-related metabolic genes, and constructed an overall survival predictive model using data of patients with HCC from TCGA database. Univariate and multivariate Cox regression analyses suggested that the prognostic capacity of the five metabolic genes was independent of other clinical data. Kaplan-Meier analysis and the AUC in the ROC curve demonstrated effective stratification of low- and high-risk patients according to different overall survival results, suggesting robust prognostic value involving these metabolism-related genes.
Conclusions
Taken together, our results have identified five prognosis-related metabolic genes useful for predicting survival outcomes in HCC, based on TCGA data, which reflected that these genes might be involved in dysregulation of the metabolic microenvironment, and might be treated as novel biomarkers for metabolic therapy in HCC patients.
Materials and Methods
Downloading mRNA expression profiles and clinical information
RNA sequencing data of HTSeq-FPKM and relevant clinical information of our HCC cohort were downloaded from TCGA database (http://portal.gdc.cancer.gov/). Next, the entire TCGA-HCC data set was randomly divided into a training set and a testing set (Table 1), both of which had similar clinical characteristics.
Extraction of metabolic genes from the TCGA-HCC database
The file c2.cp.kegg.v7.1.symbols.gmt was downloaded from the GSEA website (http://software.broadinstitute.org/gsea/index.jsp). The metabolic genes were obtained from METABOLISM pathways in c2.cp.kegg.v7.1.symbols.gmt. Then the mRNA expression of metabolic genes in the TCGA-HCC database was extracted.
Identification of differentially expressed metabolic genes in the training set
The R package “limma” was used to screen the differentially expressed metabolic genes [45]. The expression of candidate metabolic genes in the training set was used to identify differentially expressed metabolic genes. The screening criteria was set as |logFC| > 1.5, P-value < 0.05 and FDR < 0.05.
Identification of prognostic associated metabolic genes in the training set
Univariate Cox regression analysis was performed using the R package "survival" to determine metabolic genes related to prognosis in the training set. The overall survival outcomes of genes with hazard ratio (HR) <1 are better, while the overall survival outcomes of genes with HR> 1 are worse. The statistical significance was based on P-value < 0.001.
Construction of Lasso Cox regression model
The R package “glmnet” and “survival” were used for the construction of Lasso Cox regression model. To calculate the risk score of every patient, Lasso Cox regression model was constructed with the prognostic related metabolic genes screened by univariate Cox regression analysis [46]. The formula of risk score was as follows: risk score = the sum of each coefficient of mRNA multiple each expression of mRNA. Patients were divided into high and low-risk groups based on the median risk score of the training set.
Survival analysis based on the stratification of low and high-risk scores
The Kaplan-Meier method was used for survival analysis, and log-rank test was used to evaluate the overall survival difference between high and low-risk groups. The R package “survival” and “survminer” were used to perform survival analysis. Risk score curves were generated according to the risk score of each patient. In order to validate the survival analysis of the training set, the Kaplan-Meier method was performed on the testing set to evaluate the overall survival difference between high and low-risk groups.
Validation of risk score via univariate and multivariate Cox analysis
Clinicopathological characteristics and risk scores were included in univariate and multivariate Cox regression analyses to validate whether the risk score could be regarded as an independent risk factor to predict overall survival outcome. This factor can be used as independent risk factor when P-values < 0.05.
Validation of risk score by drawing receiver operating characteristic curve
R package “survivalROC” was used to draw receiver operating characteristic curve (ROC curve). The robustness of risk score for overall survival prediction model was evaluated by comparing the area under the curve (AUC) in the ROC curves of clinicopathological characteristics and risk score.
GO analysis
GO analysis can be divided into three parts: molecular function, biological process, and cellular component, which respectively describe the molecular functions of potential gene products, the biological processes involved, and the cellular environment in which they are located. Enrichment analysis was performed via David v.6.8 (https://david.ncifcrf.gov/) database [47, 48]. David v.6.8 for annotation, visualization, and integrated discovery provides a comprehensive set of functional annotation tools to understand the biological meaning behind long lists of genes.
Pathway analysis
The Kyoto Encyclopedia of Genes and Genomes (KEGG) enrichment analysis of prognostic genes can enrich the significant pathways and help to find the biological regulatory pathways for significant differences in experimental conditions. The David 6.8 (https://david.ncifcrf.gov/) database also can be used for the enrichment of pathway.
External validation of the prognostic genes expression using online database
The expression of the prognostic genes in the gene signature was further validated at the DNA level in the cBioportal database (http://www.cbioportal.org/), at the mRNA level in the TIMER database (https://cistrome.shinyapps.io/timer/), and at the protein level in the Human Protein Atlas database (https://www.proteinatlas.org/).
GO and KEGG analyses by GSEA
GSEA v4.0.3 for Windows, c5.bp.v7.1.symbols.gmt and c2.cp.kegg.v7.1.symbols.gmt were downloaded from the GSEA website (http://software.broadinstitute.org/gsea/index.jsp). GSEA software (version 4.0.3) was used to perform GO and KEGG analyses [49]. The gene sets databases c5.bp.v7.1.symbols.gmt and c2.cp.kegg.v7.1.symbols.gmt were selected as GO and KEGG GMT files, respectively. CLS file was prepared according to the high and low-risk groups based on the median risk score of training set. GCT file was prepared with the mRNA expression matrix of HCC downloaded from the TCGA database. And permutations was set as 1000.
Development of risk prediction model
According to training set data, we developed a nomogram combing risk scores with clinical information for prediction of overall survival at 1, 2 and 3 years for patients with HCC. The R package “rms” was used to produce the nomogram. The concordance index (C-index) were used to investigate the discrimination of the nomogram (by a bootstrap method with 1,000 resamples). Tumor-node metastasis (TNM) staging, risk score, and the combined model including TNM and the risk score were compared with time-dependent receiver operating characteristic curve (time-ROC curve), C-index.
Statistical methods
Independent sample t-test and nonparametric independent sample test were performed on the clinical data of the training set and testing set, to evaluate statistical difference of clinical data between the two groups. Survival analysis was performed using Kaplan-Meier method, and log-rank test was used to evaluate the overall survival difference between high and low-risk groups. Univariate and multivariate Cox regression analyses were implemented to examine whether the prognostic value of metabolic genes signature was independent. To assess the prognostic performance of the metabolic genes risk score signature, we conducted receiver operating characteristic (ROC) analyses.
Author Contributions
Lijuan Cui and Huan Xue performed the data analysis and interpretation. Zhitong Wen and Zhihong Lu edited and revised the manuscript. Yunfeng Liu and Yi Zhang conducted the study design, data analysis and interpretation, manuscript composition, and manuscript editing. All authors approved the final version of the article.
Acknowledgments
We are very grateful to Binbin Zou of Department of Cell Biology of Shanxi Medical University for the instruction in computer language.
Conflicts of Interest
The authors have no relevant conflicts of interest to declare.
Funding
This work was supported by the National Natural Science Foundation of China [grant numbers 81670710, 81770776, 81973378]; and the Shanxi Youth Science and Technology Research Fund [grant number 201901D211323].
References
- 1. Bray F, Ferlay J, Soerjomataram I, Siegel RL, Torre LA, Jemal A. Global cancer statistics 2018: GLOBOCAN estimates of incidence and mortality worldwide for 36 cancers in 185 countries. CA Cancer J Clin. 2018; 68:394–424. https://doi.org/10.3322/caac.21492 [PubMed]
- 2. Forner A, Reig M, Bruix J. Hepatocellular carcinoma. Lancet. 2018; 391:1301–14. https://doi.org/10.1016/S0140-6736(18)30010-2 [PubMed]
- 3. Li X, Huang L, Leng X. Analysis of prognostic factors of more/equal to10 years of survival for liver cancer patients after liver transplantation. J Cancer Res Clin Oncol. 2018; 144:2465–74. https://doi.org/10.1007/s00432-018-2756-8 [PubMed]
- 4. Bidkhori G, Benfeitas R, Klevstig M, Zhang C, Nielsen J, Uhlen M, Boren J, Mardinoglu A. Metabolic network-based stratification of hepatocellular carcinoma reveals three distinct tumor subtypes. Proc Natl Acad Sci USA. 2018; 115:E11874–83. https://doi.org/10.1073/pnas.1807305115 [PubMed]
- 5. Hanahan D, Weinberg RA. Hallmarks of cancer: the next generation. Cell. 2011; 144:646–74. https://doi.org/10.1016/j.cell.2011.02.013 [PubMed]
- 6. Sun L, Suo C, Li ST, Zhang H, Gao P. Metabolic reprogramming for cancer cells and their microenvironment: beyond the warburg effect. Biochim Biophys Acta Rev Cancer. 2018; 1870:51–66. https://doi.org/10.1016/j.bbcan.2018.06.005 [PubMed]
- 7. Vander Heiden MG, Cantley LC, Thompson CB. Understanding the warburg effect: the metabolic requirements of cell proliferation. Science. 2009; 324:1029–33. https://doi.org/10.1126/science.1160809 [PubMed]
- 8. Pavlova NN, Thompson CB. The emerging hallmarks of cancer metabolism. Cell Metab. 2016; 23:27–47. https://doi.org/10.1016/j.cmet.2015.12.006 [PubMed]
- 9. Tarasenko TN, McGuire PJ. The liver is a metabolic and immunologic organ: a reconsideration of metabolic decompensation due to infection in inborn errors of metabolism (IEM). Mol Genet Metab. 2017; 121:283–88. https://doi.org/10.1016/j.ymgme.2017.06.010 [PubMed]
- 10. Ward PS, Thompson CB. Metabolic reprogramming: a cancer hallmark even warburg did not anticipate. Cancer Cell. 2012; 21:297–308. https://doi.org/10.1016/j.ccr.2012.02.014 [PubMed]
- 11. Peng X, Chen Z, Farshidfar F, Xu X, Lorenzi PL, Wang Y, Cheng F, Tan L, Mojumdar K, Du D, Ge Z, Li J, Thomas GV, et al, and Cancer Genome Atlas Research Network. Molecular characterization and clinical relevance of metabolic expression subtypes in human cancers. Cell Rep. 2018; 23:255–69.e4. https://doi.org/10.1016/j.celrep.2018.03.077 [PubMed]
- 12. Sinkala M, Mulder N, Patrick Martin D. Metabolic gene alterations impact the clinical aggressiveness and drug responses of 32 human cancers. Commun Biol. 2019; 2:414. https://doi.org/10.1038/s42003-019-0666-1 [PubMed]
- 13. Rosario SR, Long MD, Affronti HC, Rowsam AM, Eng KH, Smiraglia DJ. Pan-cancer analysis of transcriptional metabolic dysregulation using the cancer genome atlas. Nat Commun. 2018; 9:5330. https://doi.org/10.1038/s41467-018-07232-8 [PubMed]
- 14. Balogh J, Victor D
3rd , Asham EH, Burroughs SG, Boktour M, Saharia A, Li X, Ghobrial RM, Monsour HPJr . Hepatocellular carcinoma: a review. J Hepatocell Carcinoma. 2016; 3:41–53. https://doi.org/10.2147/JHC.S61146 [PubMed] - 15. Costentin C. [Hepatocellular carcinoma surveillance]. Presse Med. 2017; 46:381–85. https://doi.org/10.1016/j.lpm.2016.11.006 [PubMed]
- 16. Sun JY, Zhang XY, Cao YZ, Zhou X, Gu J, Mu XX. Diagnostic and prognostic value of circular RNAs in hepatocellular carcinoma. J Cell Mol Med. 2020; 24:5438–45. https://doi.org/10.1111/jcmm.15258 [PubMed]
- 17. Porta C, Sica A, Riboldi E. Tumor-associated myeloid cells: new understandings on their metabolic regulation and their influence in cancer immunotherapy. FEBS J. 2018; 285:717–33. https://doi.org/10.1111/febs.14288 [PubMed]
- 18. Lyssiotis CA, Kimmelman AC. Metabolic interactions in the tumor microenvironment. Trends Cell Biol. 2017; 27:863–75. https://doi.org/10.1016/j.tcb.2017.06.003 [PubMed]
- 19. Reina-Campos M, Moscat J, Diaz-Meco M. Metabolism shapes the tumor microenvironment. Curr Opin Cell Biol. 2017; 48:47–53. https://doi.org/10.1016/j.ceb.2017.05.006 [PubMed]
- 20. Zhao L, Jiang L, He L, Wei Q, Bi J, Wang Y, Yu L, He M, Zhao L, Wei M. Identification of a novel cell cycle-related gene signature predicting survival in patients with gastric cancer. J Cell Physiol. 2019; 234:6350–60. https://doi.org/10.1002/jcp.27365 [PubMed]
- 21. Long J, Zhang L, Wan X, Lin J, Bai Y, Xu W, Xiong J, Zhao H. A four-gene-based prognostic model predicts overall survival in patients with hepatocellular carcinoma. J Cell Mol Med. 2018; 22:5928–38. https://doi.org/10.1111/jcmm.13863 [PubMed]
- 22. Qiao GJ, Chen L, Wu JC, Li ZR. Identification of an eight-gene signature for survival prediction for patients with hepatocellular carcinoma based on integrated bioinformatics analysis. PeerJ. 2019; 7:e6548. https://doi.org/10.7717/peerj.6548 [PubMed]
- 23. Zuo S, Wei M, Zhang H, Chen A, Wu J, Wei J, Dong J. A robust six-gene prognostic signature for prediction of both disease-free and overall survival in non-small cell lung cancer. J Transl Med. 2019; 17:152. https://doi.org/10.1186/s12967-019-1899-y [PubMed]
- 24. Yang L, Roberts D, Takhar M, Erho N, Bibby BA, Thiruthaneeswaran N, Bhandari V, Cheng WC, Haider S, McCorry AM, McArt D, Jain S, Alshalalfa M, et al. Development and validation of a 28-gene hypoxia-related prognostic signature for localized prostate cancer. EBioMedicine. 2018; 31:182–89. https://doi.org/10.1016/j.ebiom.2018.04.019 [PubMed]
- 25. Kuo FC, Mar BG, Lindsley RC, Lindeman NI. The relative utilities of genome-wide, gene panel, and individual gene sequencing in clinical practice. Blood. 2017; 130:433–39. https://doi.org/10.1182/blood-2017-03-734533 [PubMed]
- 26. Feng H, Wang X, Chen J, Cui J, Gao T, Gao Y, Zeng W. Nuclear imaging of glucose metabolism: beyond 18F-FDG. Contrast Media Mol Imaging. 2019; 2019:7954854. https://doi.org/10.1155/2019/7954854 [PubMed]
- 27. Kim BK, Kang WJ, Kim JK, Seong J, Park JY, Kim DY, Ahn SH, Lee DY, Lee KH, Lee JD, Han KH. 18F-fluorodeoxyglucose uptake on positron emission tomography as a prognostic predictor in locally advanced hepatocellular carcinoma. Cancer. 2011; 117:4779–87. https://doi.org/10.1002/cncr.26099 [PubMed]
- 28. Yin J, Ren W, Huang X, Deng J, Li T, Yin Y. Potential mechanisms connecting purine metabolism and cancer therapy. Front Immunol. 2018; 9:1697. https://doi.org/10.3389/fimmu.2018.01697 [PubMed]
- 29. Starokadomskyy P, Gemelli T, Rios JJ, Xing C, Wang RC, Li H, Pokatayev V, Dozmorov I, Khan S, Miyata N, Fraile G, Raj P, Xu Z, et al. DNA polymerase-α regulates the activation of type I interferons through cytosolic RNA:DNA synthesis. Nat Immunol. 2016; 17:495–504. https://doi.org/10.1038/ni.3409 [PubMed]
- 30. Suzuki NN, Koizumi K, Fukushima M, Matsuda A, Inagaki F. Structural basis for the specificity, catalysis, and regulation of human uridine-cytidine kinase. Structure. 2004; 12:751–64. https://doi.org/10.1016/j.str.2004.02.038 [PubMed]
- 31. Mateo J, Harden TK, Boyer JL. Functional expression of a cDNA encoding a human ecto-ATPase. Br J Pharmacol. 1999; 128:396–402. https://doi.org/10.1038/sj.bjp.0702805 [PubMed]
- 32. Hofmann ER, Boyanapalli M, Lindner DJ, Weihua X, Hassel BA, Jagus R, Gutierrez PL, Kalvakolanu DV. Thioredoxin reductase mediates cell death effects of the combination of beta interferon and retinoic acid. Mol Cell Biol. 1998; 18:6493–504. https://doi.org/10.1128/mcb.18.11.6493 [PubMed]
- 33. Xiao J, Liu Y, Wu F, Liu R, Xie Y, Yang Q, Li Y, Liu M, Li S, Tang H. miR-639 expression is silenced by DNMT3A-mediated hypermethylation and functions as a tumor suppressor in liver cancer cells. Mol Ther. 2020; 28:587–98. https://doi.org/10.1016/j.ymthe.2019.11.021 [PubMed]
- 34. Yu S, Li X, Guo X, Zhang H, Qin R, Wang M. UCK2 upregulation might serve as an indicator of unfavorable prognosis of hepatocellular carcinoma. IUBMB Life. 2019; 71:105–12. https://doi.org/10.1002/iub.1941 [PubMed]
- 35. McLoughlin MR, Orlicky DJ, Prigge JR, Krishna P, Talago EA, Cavigli IR, Eriksson S, Miller CG, Kundert JA, Sayin VI, Sabol RA, Heinemann J, Brandenberger LO, et al. TrxR1, gsr, and oxidative stress determine hepatocellular carcinoma Malignancy. Proc Natl Acad Sci USA. 2019; 116:11408–17. https://doi.org/10.1073/pnas.1903244116 [PubMed]
- 36. Lee D, Xu IM, Chiu DK, Leibold J, Tse AP, Bao MH, Yuen VW, Chan CY, Lai RK, Chin DW, Chan DF, Cheung TT, Chok SH, et al. Induction of oxidative stress through inhibition of thioredoxin reductase 1 is an effective therapeutic approach for hepatocellular carcinoma. Hepatology. 2019; 69:1768–86. https://doi.org/10.1002/hep.30467 [PubMed]
- 37. Huang S, Li J, Tam NL, Sun C, Hou Y, Hughes B, Wang Z, Zhou Q, He X, Wu L. Uridine-cytidine kinase 2 upregulation predicts poor prognosis of hepatocellular carcinoma and is associated with cancer aggressiveness. Mol Carcinog. 2019; 58:603–15. https://doi.org/10.1002/mc.22954 [PubMed]
- 38. Zhou Q, Jiang H, Zhang J, Yu W, Zhou Z, Huang P, Wang J, Xiao Z. Uridine-cytidine kinase 2 promotes metastasis of hepatocellular carcinoma cells via the Stat3 pathway. Cancer Manag Res. 2018; 10:6339–55. https://doi.org/10.2147/CMAR.S182859 [PubMed]
- 39. Tuo L, Xiang J, Pan X, Gao Q, Zhang G, Yang Y, Liang L, Xia J, Wang K, Tang N. PCK1 downregulation promotes TXNRD1 expression and hepatoma cell growth via the Nrf2/Keap1 pathway. Front Oncol. 2018; 8:611. https://doi.org/10.3389/fonc.2018.00611 [PubMed]
- 40. Yeh HW, Lee SS, Chang CY, Hu CM, Jou YS. Pyrimidine metabolic rate limiting enzymes in poorly-differentiated hepatocellular carcinoma are signature genes of cancer stemness and associated with poor prognosis. Oncotarget. 2017; 8:77734–51. https://doi.org/10.18632/oncotarget.20774 [PubMed]
- 41. Chiu DK, Tse AP, Xu IM, Di Cui J, Lai RK, Li LL, Koh HY, Tsang FH, Wei LL, Wong CM, Ng IO, Wong CC. Hypoxia inducible factor HIF-1 promotes myeloid-derived suppressor cells accumulation through ENTPD2/CD39L1 in hepatocellular carcinoma. Nat Commun. 2017; 8:517. https://doi.org/10.1038/s41467-017-00530-7 [PubMed]
- 42. Han T, Goralski M, Capota E, Padrick SB, Kim J, Xie Y, Nijhawan D. The antitumor toxin CD437 is a direct inhibitor of DNA polymerase α. Nat Chem Biol. 2016; 12:511–15. https://doi.org/10.1038/nchembio.2082 [PubMed]
- 43. Cantor JR, Sabatini DM. Cancer cell metabolism: one hallmark, many faces. Cancer Discov. 2012; 2:881–98. https://doi.org/10.1158/2159-8290.CD-12-0345 [PubMed]
- 44. Liguri G, Camici G, Manao G, Cappugi G, Nassi P, Modesti A, Ramponi G. A new acylphosphatase isoenzyme from human erythrocytes: purification, characterization, and primary structure. Biochemistry. 1986; 25:8089–94. https://doi.org/10.1021/bi00372a044 [PubMed]
- 45. Ritchie ME, Phipson B, Wu D, Hu Y, Law CW, Shi W, Smyth GK. Limma powers differential expression analyses for RNA-sequencing and microarray studies. Nucleic Acids Res. 2015; 43:e47. https://doi.org/10.1093/nar/gkv007 [PubMed]
- 46. Wu S, Zheng J, Li Y, Yu H, Shi S, Xie W, Liu H, Su Y, Huang J, Lin T. A radiomics nomogram for the preoperative prediction of lymph node metastasis in bladder cancer. Clin Cancer Res. 2017; 23:6904–11. https://doi.org/10.1158/1078-0432.CCR-17-1510 [PubMed]
- 47. Huang da W, Sherman BT, Lempicki RA. Systematic and integrative analysis of large gene lists using DAVID bioinformatics resources. Nat Protoc. 2009; 4:44–57. https://doi.org/10.1038/nprot.2008.211 [PubMed]
- 48. Huang da W, Sherman BT, Lempicki RA. Bioinformatics enrichment tools: paths toward the comprehensive functional analysis of large gene lists. Nucleic Acids Res. 2009; 37:1–13. https://doi.org/10.1093/nar/gkn923 [PubMed]
- 49. Subramanian A, Tamayo P, Mootha VK, Mukherjee S, Ebert BL, Gillette MA, Paulovich A, Pomeroy SL, Golub TR, Lander ES, Mesirov JP. Gene set enrichment analysis: a knowledge-based approach for interpreting genome-wide expression profiles. Proc Natl Acad Sci USA. 2005; 102:15545–50. https://doi.org/10.1073/pnas.0506580102 [PubMed]
- 50. Li T, Fu J, Zeng Z, Cohen D, Li J, Chen Q, Li B, Liu XS. TIMER2.0 for analysis of tumor-infiltrating immune cells. Nucleic Acids Res. 2020; 48:W509–W514. https://doi.org/10.1093/nar/gkaa407 [PubMed]
- 51. Uhlén M, Fagerberg L, Hallström BM, Lindskog C, Oksvold P, Mardinoglu A, Sivertsson Å, Kampf C, Sjöstedt E, Asplund A, Olsson I, Edlund K, Lundberg E, et al. Tissue-based map of the human proteome. Science. 2015; 347:1260419. https://doi.org/10.1126/science.1260419 [PubMed]
- 52. Gao J, Aksoy BA, Dogrusoz U, Dresdner G, Gross B, Sumer SO, Sun Y, Jacobsen A, Sinha R, Larsson E, Cerami E, Sander C, Schultz N. Integrative analysis of complex cancer genomics and clinical profiles using the cBioPortal. Sci Signal. 2013; 6:pl1. https://doi.org/10.1126/scisignal.2004088 [PubMed]
- 53. Cerami E, Gao J, Dogrusoz U, Gross BE, Sumer SO, Aksoy BA, Jacobsen A, Byrne CJ, Heuer ML, Larsson E, Antipin Y, Reva B, Goldberg AP, et al. The cBio cancer genomics portal: an open platform for exploring multidimensional cancer genomics data. Cancer Discov. 2012; 2:401–4. https://doi.org/10.1158/2159-8290.CD-12-0095 [PubMed]