


Introduction
Systemic sclerosis (SSc), a complex and heterogeneous connective tissue disease, is observed mainly in female patients. The main characteristics of SSc include immune abnormalities, microvasculopathy, excessive extracellular deposition, and progressive fibrosis of the skin and other internal organs [1]. Currently, the mechanisms underlying SSc remain largely unknown, although infection, immune activation by cancer, and dysbiosis might trigger SSc on the genetic level [2, 3]. In addition, serious complications of SSc, such as interstitial lung disease, pulmonary hypertension, and heart failure, can be life-threatening [4].
Fibroblasts play an important role in fibrosis and maintain profibrotic phenotypes in vitro when explanted from affected tissues, resulting in increased secretion of collagen, extra-cellular matrix proteins, and alpha-smooth muscle actin (α-SMA), a crucial marker of myofibroblasts [5]. Additional in vitro studies are needed to investigate the underlying molecular and epigenetic mechanisms related to fibrosis [6]. For example, a recent study demonstrated that transforming growth factor beta (TGF-β) played a key role in SSc by regulating fibrosis progression [7].
microRNAs (miRNAs), a type of small non-coding RNA molecule approximately 22 nucleotides in length, are present in plants, animals, and some viruses, and can both silence RNA expression and regulate gene expression post-transcriptionally [8]. miRNA expression has been associated with regulation of developmental processes and a variety of disease states [9]. Accumulating evidence suggests that miRNA plays a crucial role in many fibrotic conditions [10]. For example, miR-16-5p regulates epigenetic modification of the connective tissue and plays a key role in immune diseases [11]. miR-16-5p also modulates inflammatory cytokines and might be crucial for anti-inflammatory response [12].
It is well known that the NOTCH family of cell surface receptors is crucial for intercellular communication [13]. When activated by ligand binding, the NOTCH intracellular domain (NICD) is released, forms a transcriptional activator complex with RBPJ/RBPSUH, and activates genes in the enhancer of split locus [14]. It also affects the initiation of tissue differentiation, proliferation, and apoptotic programs [15]. It was previously demonstrated that NOTCH signaling is regulated by certain miRNAs, such as miR-164a, miR-34a, and miR-143-3p [16–18].
In this study, we examined miR-16-5p expression in SSc patients and found that miR-16-5p suppressed profibrotic activation of dermal fibroblasts in vitro. Furthermore, we show that this phenotype is driven by miR-16-5p-mediated NOTCH pathway suppression.
Results
Identification of DEGs and DEMs
The GSE137472 (miRNA) and GSE145120 (mRNA) gene expression profiles were obtained from the GEO database. The data were analyzed using the GEO2R online tool. A total of 28 upregulated and 29 downregulated DEMs, including miR-16-5p, were identified in SSc patients as compared to normal controls. 392 upregulated DEGs, including NOTCH2, and 348 downregulated DEGs were identified in SSc patients compared to controls. The top 30 up-regulated and top 30 down-regulated miRNAs and mRNAs are shown in Figures 1 and 2, respectively.
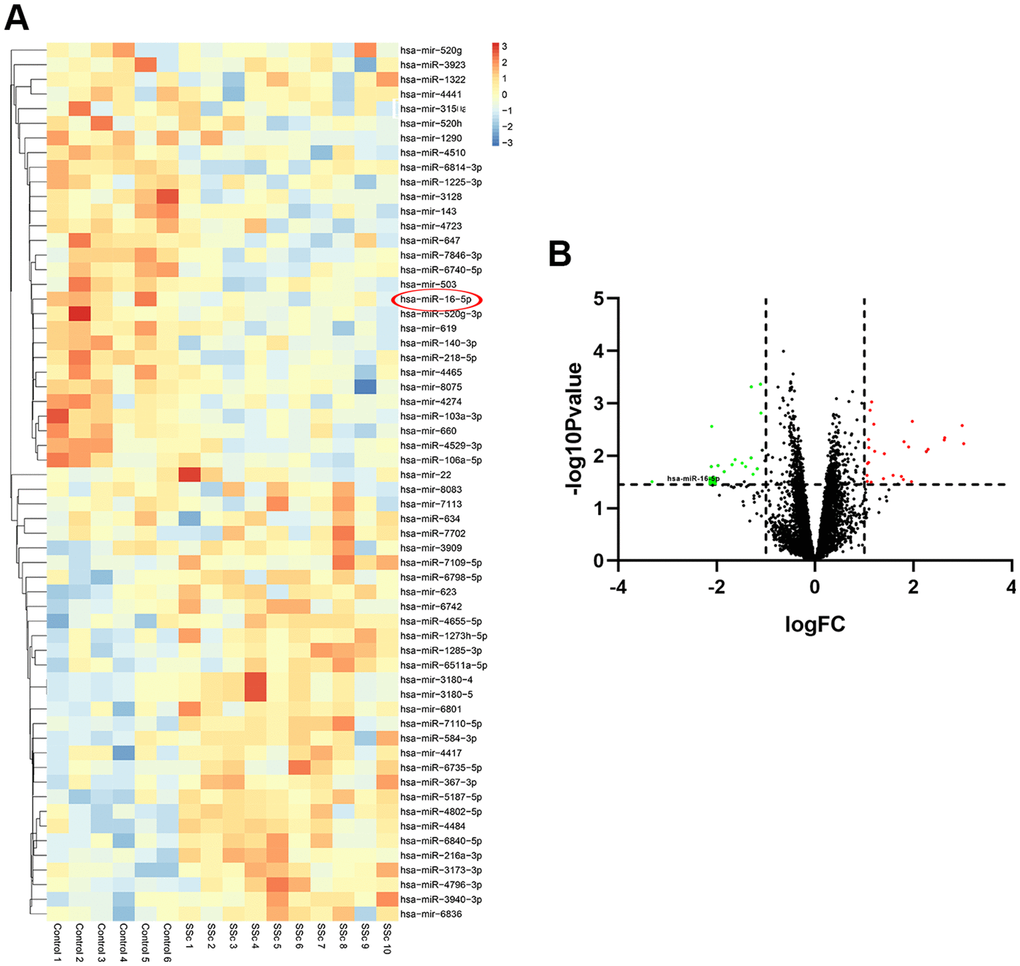
Figure 1. Differentially expressed miRNAs in SSc patient samples compared to healthy controls. (A) The heat map shows hierarchical clustering of differentially expressed miRNAs in SSc patients compared to healthy controls (n=30 per group) in the GSE137472 dataset. (B) The volcano plot shows differentially expressed miRNAs in SSc patients compared to healthy controls (n=30 per group) in the GSE137472 dataset.
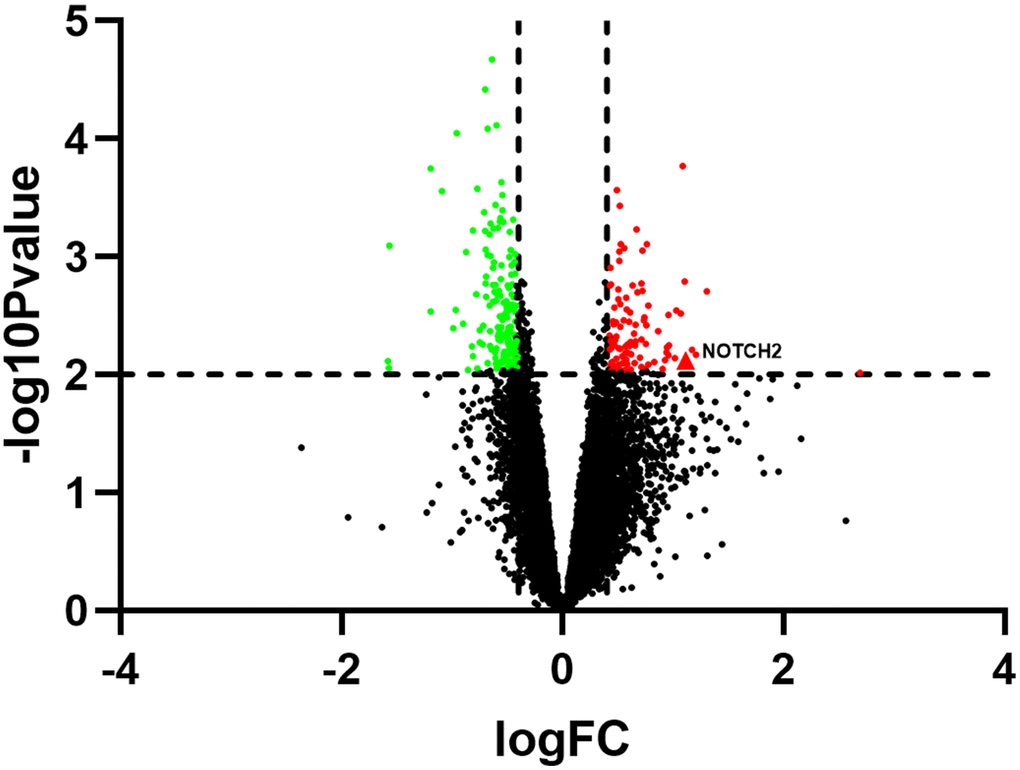
Figure 2. Volcano plot showing differentially expressed genes in SSc patients compared to healthy controls (n=30 per group) in the GSE145120 dataset.
miRNA-targeted gene prediction
miR-16-5p, which was down-regulated in SSc, has been reported as an epigenetic regulator of the connective tissue as well as a key regulator in immune diseases [11]. We therefore searched TargetScanHiman to identify potential downstream targets of miR16-5p; 1515 potential targeted genes were identified. Interestingly, NOTCH2 was both listed as a potential target gene of miR-16-5p and was among the DEGs identified in SSc patients, and the Notch family of cell surface receptors is crucial for intercellular communication [13]. These results suggest that the effects of miR-16-5p may be in mediated in part by downstream NOTCH2 activity; in vitro and in vivo experiments supported this hypothesis. A schematic diagram of the target gene prediction process is shown in Figure 3.
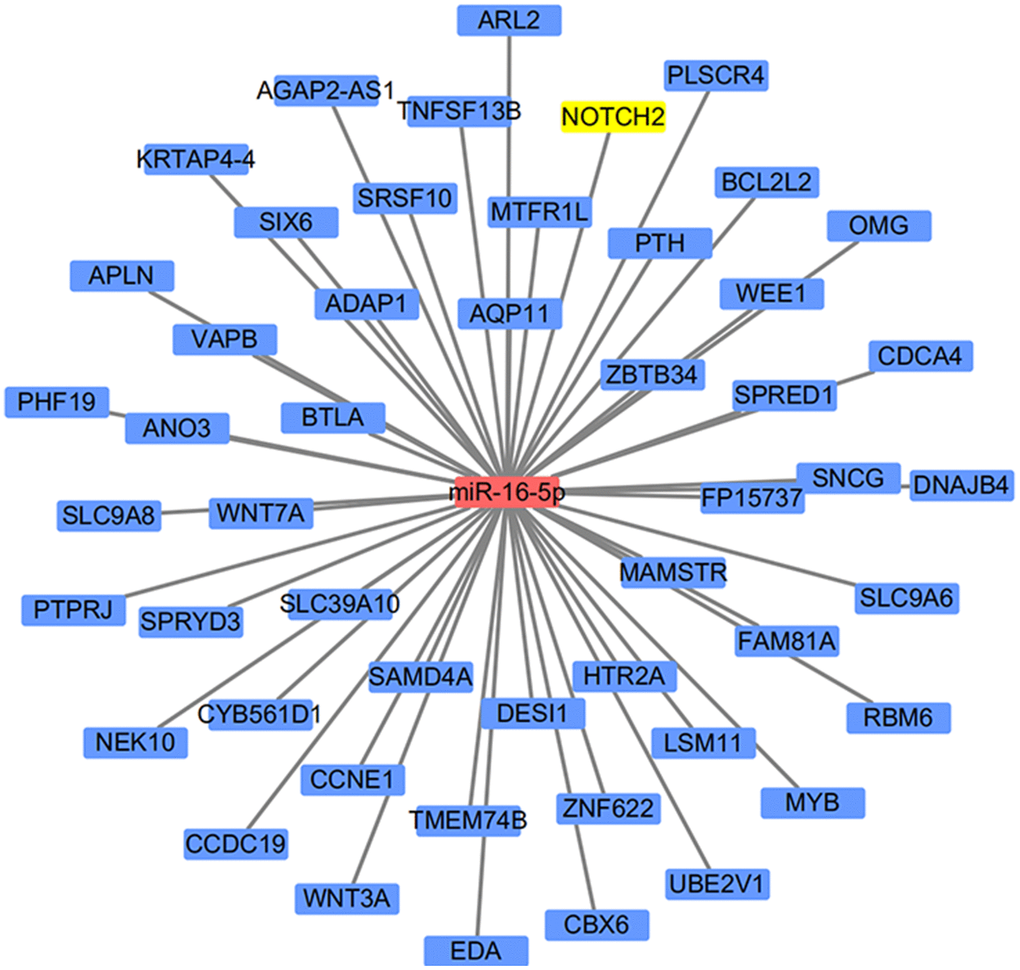
Figure 3. Schematic diagram of the miRNA target prediction strategy.
GO and KEGG enrichment analysis
GO term analysis and KEGG pathway enrichment analyses were performed using the DAVID bioinformatics tool. DEGs in SSc patients were significantly enriched in the following categories and processes: in the biological process category, defense response to virus, response to virus, and type I interferon; in the cellular component category, membrane, cytosol, and Golgi apparatus; in the molecular function category, protein binding, double-stranded RNA binding, and phosphatase activity (Table 1 and Figure 4). The top 5 KEGG pathways associated with DEGs in SSc patients were influenza A, herpes simplex infection, measles, protein processing in endoplasmic reticulum, and hepatitis C (Table 2 and Figure 5).
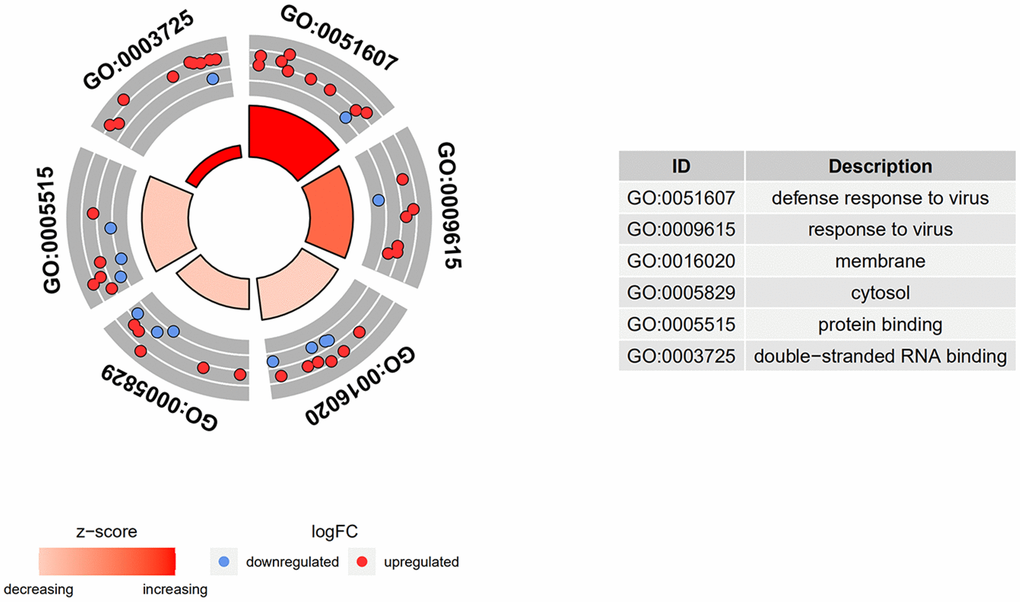
Figure 4. GO and KEGG enrichment analysis of DEGs. DEGs in SSc patients were significantly enriched in the following categories and pathways: in the biological process category, defense response to virus, response to virus, and type I interferon; in the cellular component category, membrane, cytosol, and Golgi apparatus; in the molecular function category, protein binding, double-stranded RNA binding, and phosphatase activity.
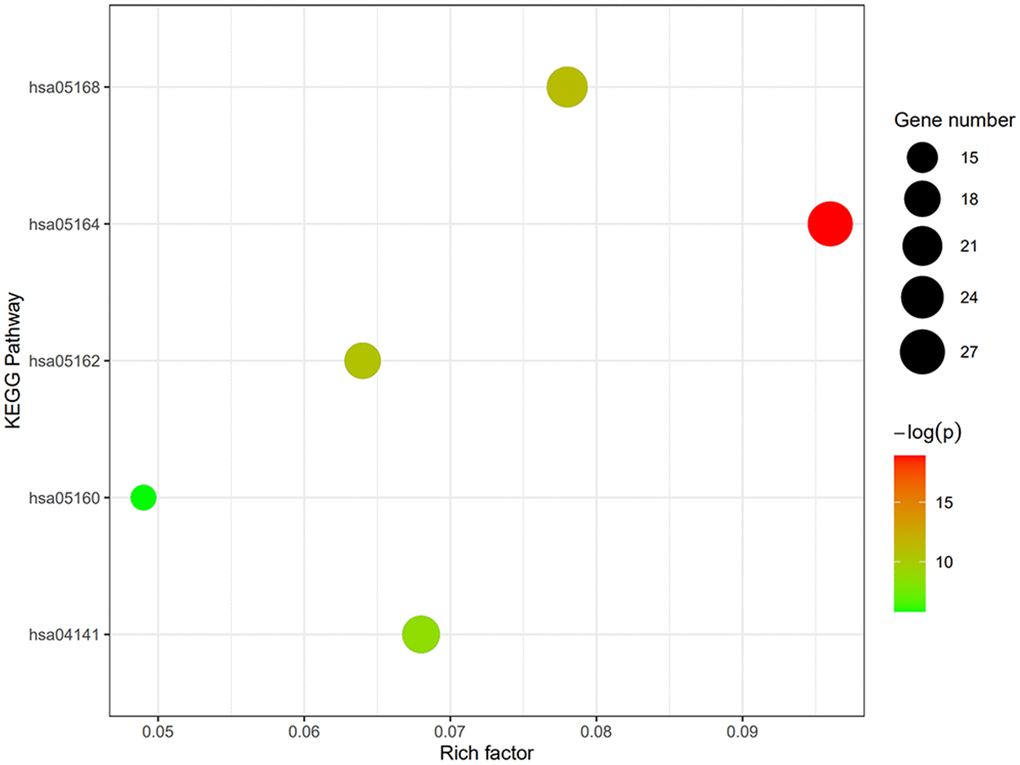
Figure 5. Degree, betweenness, and closeness centrality of hub genes. The top 5 KEGG pathways of DEGs in SSc patients were influenza A, herpes simplex infection, measles, protein processing in endoplasmic reticulum, and hepatitis C.
Table 1. GO functional enrichment analysis of the genes in module.
| A, Biological process | |||||||||||||||||||||||||||||||||||||||||||||||||||||||||||||||||||||||||||||||||||||||||||||||||||
| Term | Name | Count | P-value | ||||||||||||||||||||||||||||||||||||||||||||||||||||||||||||||||||||||||||||||||||||||||||||||||
| GO:0051607 | defense response to virus | 29 | 3.03E-11 | ||||||||||||||||||||||||||||||||||||||||||||||||||||||||||||||||||||||||||||||||||||||||||||||||
| GO:0009615 | response to virus | 22 | 9.79E-10 | ||||||||||||||||||||||||||||||||||||||||||||||||||||||||||||||||||||||||||||||||||||||||||||||||
| GO:0060337 | type I interferon | 17 | 1.57E-9 | ||||||||||||||||||||||||||||||||||||||||||||||||||||||||||||||||||||||||||||||||||||||||||||||||
| B, Cellular component | |||||||||||||||||||||||||||||||||||||||||||||||||||||||||||||||||||||||||||||||||||||||||||||||||||
| Term | Name | Count | P-value | ||||||||||||||||||||||||||||||||||||||||||||||||||||||||||||||||||||||||||||||||||||||||||||||||
| GO:0016020 | membrane | 134 | 2.02E-9 | ||||||||||||||||||||||||||||||||||||||||||||||||||||||||||||||||||||||||||||||||||||||||||||||||
| GO:0005829 | cytosol | 174 | 2.38E-7 | ||||||||||||||||||||||||||||||||||||||||||||||||||||||||||||||||||||||||||||||||||||||||||||||||
| GO:0005794 | golgi apparatus | 61 | 1.33E-6 | ||||||||||||||||||||||||||||||||||||||||||||||||||||||||||||||||||||||||||||||||||||||||||||||||
| C, Molecular function | |||||||||||||||||||||||||||||||||||||||||||||||||||||||||||||||||||||||||||||||||||||||||||||||||||
| Term | Name | Count | P-value | ||||||||||||||||||||||||||||||||||||||||||||||||||||||||||||||||||||||||||||||||||||||||||||||||
| GO:0005515 | protein binding | 408 | 2.74E-10 | ||||||||||||||||||||||||||||||||||||||||||||||||||||||||||||||||||||||||||||||||||||||||||||||||
| GO:0003725 | double-stranded RNA binding | 10 | 4.30E-4 | ||||||||||||||||||||||||||||||||||||||||||||||||||||||||||||||||||||||||||||||||||||||||||||||||
| GO:0016791 | phosphatase activity | 7 | 3.57E-3 | ||||||||||||||||||||||||||||||||||||||||||||||||||||||||||||||||||||||||||||||||||||||||||||||||
| GO: Gene Ontology. | |||||||||||||||||||||||||||||||||||||||||||||||||||||||||||||||||||||||||||||||||||||||||||||||||||
| Top 2 terms were selected according to P-value when more than 2 terms enriched terms were identified in each category. | |||||||||||||||||||||||||||||||||||||||||||||||||||||||||||||||||||||||||||||||||||||||||||||||||||
Table 2. KEGG pathway enrichment analysis of the genes in module.
| KEGG pathway | |||||||||||||||||||||||||||||||||||||||||||||||||||||||||||||||||||||||||||||||||||||||||||||||||||
| Term | Name | Count | P-value | ||||||||||||||||||||||||||||||||||||||||||||||||||||||||||||||||||||||||||||||||||||||||||||||||
| Hsa05164 | Influenza A | 27 | 6.24E-9 | ||||||||||||||||||||||||||||||||||||||||||||||||||||||||||||||||||||||||||||||||||||||||||||||||
| Hsa05168 | Herpes simplex infection | 22 | 1.49E-5 | ||||||||||||||||||||||||||||||||||||||||||||||||||||||||||||||||||||||||||||||||||||||||||||||||
| hsa05162 | Measles | 18 | 2.46E-5 | ||||||||||||||||||||||||||||||||||||||||||||||||||||||||||||||||||||||||||||||||||||||||||||||||
| hsa04141 | Protein processing in endoplasmic reticulum | 19 | 1.62E-4 | ||||||||||||||||||||||||||||||||||||||||||||||||||||||||||||||||||||||||||||||||||||||||||||||||
| hsa05160 | Hepatitis C | 14 | 2.85E-3 | ||||||||||||||||||||||||||||||||||||||||||||||||||||||||||||||||||||||||||||||||||||||||||||||||
| KEGG, Kyoto Encyclopedia of Genes and Genomes. | |||||||||||||||||||||||||||||||||||||||||||||||||||||||||||||||||||||||||||||||||||||||||||||||||||
| Top 5 terms were selected according to P-value when more than 5 terms enriched terms were identified in each category. | |||||||||||||||||||||||||||||||||||||||||||||||||||||||||||||||||||||||||||||||||||||||||||||||||||
Inhibition of miR-16-5p activates myofibroblasts by targeting NOTCH2
A luciferase assay performed to verify the association between miR-16-5p and NOTCH2 indicated that miR-16-5p specifically bound to the predicted NOTCH2 mRNA target region. Furthermore, miR-16-5p no longer reduced luciferase activity when a mutation was present in the predicted NOTCH2 target region (Figure 6A and Supplementary Figure 1). miR-16-5p agonist and antagonists were then transfected, and successful transfection was confirmed using qRT-PCR (Figure 6B). qRT-PCR and western blot results also demonstrated that NOTCH2 expression was clearly suppressed when miR-16-5p was upregulated (Figure 6C and Supplementary Figure 2). Small interfering RNA (siRNA) was then used to inhibit NOTCH2 expression in HSFs, and qRT-PCR indicated that the NOTCH2 siRNA transfection was successful (Figure 6D and Supplementary Figure 3). Furthermore, NOTCH2 siRNA partially reversed the miR-16-5p antagonist-induced increase in NOTCH2 levels (Figure 6E). We then examined the expression of profibrotic marker levels in fibroblasts expressing antagomiR-16-5p and NOTCH2 siRNA. Inhibition of miR-16-5p in HSFs increased levels of collagen type 1A1 (Col 1A1), 1A2 (Col 1A2), α-SMA, and connective tissue growth factor (CTGF) transcript (Figure 6F–6I). In addition, matrix metallopeptidase 1 (MMP-1) and matrix metallopeptidase 8 (MMP-8) expression decreased when miR-16-5p was inhibited, and NOTCH2 knockdown partially reversed that decrease (Figure 6J, 6K). Vimentin, Galectin-3, transforming growth factor-β (TGF-β), and collagen type1 expression and release were also investigated in vitro; those results are shown in Supplementary Figure 4.
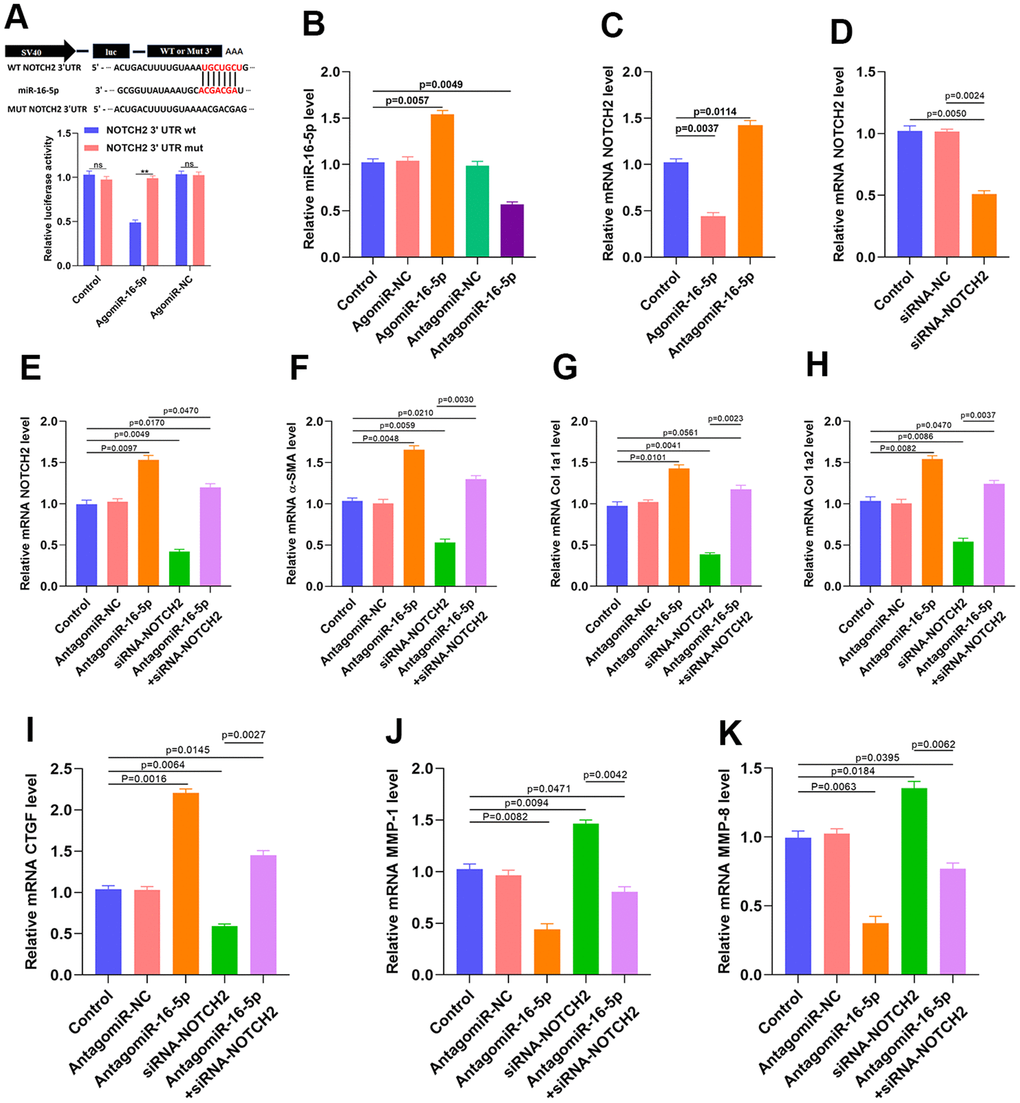
Figure 6. Inhibition of miR-16-5p activates myofibroblasts. (A) Luciferase assay results. (B) miR-16-5p transfection rate was measured by qRT-PCR. (C) NOTCH2 expression in the different groups. (D) siRNA transfection rate was measured by qRT-PCR. (E–I) Levels of collagen-related markers were measured by qRT-PCR after different treatments in HSFs. (J, K) MMP levels in the different groups were measured by qRT-PCR. Data are shown as means ± SDs of three independent experiments.
miR-16-5p and NOTCH2 expression in SSc patients and NOTCH2 overexpression-induced myofibroblast activation in HSFs
qRT-PCR and western blot analyses of serum samples collected from SSc patients and healthy controls suggested that miR-16-5p was downregulated and NOTCH2 was upregulated in SSc patients (Figure 7A–7B and Supplementary Figures 5 and 6). Transfection of a NOTCH2 overexpression plasmid resulted in the expected increase in NOTCH2 levels in HSFs according to qRT-PCR and western blot analysis (Figure 7C and Supplementary Figure 7). We then measured the expression of profibrotic markers in NOTCH2 overexpressing fibroblasts. NOTCH2 overexpression in HSFs increased levels of Col 1A1, Col 1A2, α-SMA, and CTGF transcript, and miR-16-5p inhibition partially reversed these increases (Figure 7C–7F). Furthermore, MMP-1 and MMP-8 expression decreased when NOTCH2 was overexpressed, and inhibition of miR-16-5p partially restored MMP-1 and MMP-8 levels (Figure 7G–7H).
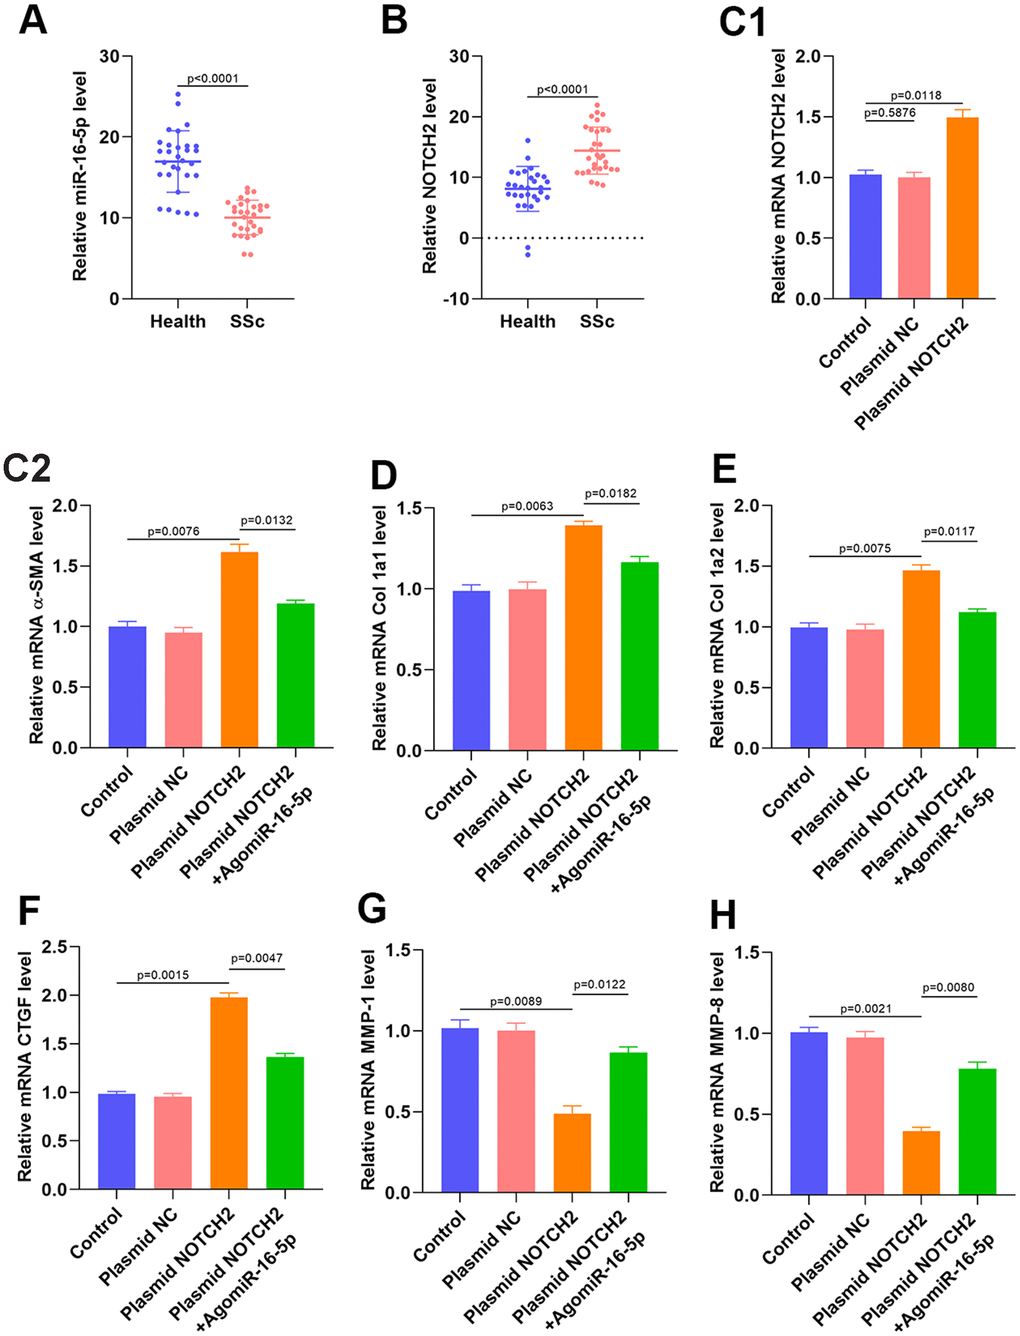
Figure 7. NOTCH2 is overexpressed in SSc patients and promotes fibrosis in vitro. (A, B) miR-16-5p and NOTCH2 expression in SSc patients and healthy controls (n=30 per group). (C1) The effects of NOTCH2 plasmid transfection on NOTCH2 levels in HSFs was assessed using qRT-PCR. (C2–F) Levels of collagen-related markers were measured by qRT-PCR analysis after different treatments in HSFs. (G–H) MMP levels in the different groups were measured by qRT-PCR. Data are shown as means ± SDs of three independent experiments.
Discussion
Myofibroblasts play a key role in tissue fibrosis, and α-SMA expression is a significant marker of myofibroblast activation [19]. The proportion of myofibroblasts in the overall fibroblast population is closely associated with the severity of fibrosis-related diseases [20]. For an example, a recent study indicated that α-SMA expression was increased in fibroblasts cultured from SSc skin biopsies, which is consistent with the transforming growth factor-β (TGF-β)-induced increase in α-SMA levels observed in vitro. Furthermore, a recent single-cell RNA-sequencing analysis identified different subgroups of fibroblasts in human skin samples [21]. In this study, we found that α-SMA levels were elevated both in antagomiR-16-5p-treated and NOTCH2 overexpression plasmid-treated HSFs, suggesting that both miR-16-5p inhibition and NOTCH2 overexpression can activate myofibroblasts in HSFs.
Our bioinformatics analyses also indicated that miR-16-5p is a regulatory factor for priming myofibroblasts. miR-16-5p expression was reduced in SSc patients compared to healthy volunteers, and miR-16-5p knockdown induced α-SMA expression in HSFs. Additionally, miR-16-5p has previously been reported to regulate epigenetic changes in connective tissue and to play a key role in immune diseases [11]. We therefore hypothesized that miR-16-5p expression would affect collagen secretion in HSFs and performed additional in vitro and in vivo assays to confirm the role of miR-16-5p in fibrosis.
Matrix metallopeptidases (MMPs) are known to degrade a variety of extra cellular matrix components and play significant roles in tissue fibrosis processes [22]. The collagenases MMP1 and MMP8 initiate the cleavage of fibrillar collagen, the digested products of which are further degraded by other MMPs [23]. In this study, we found that inhibition of miR-16-5p reduced MMP-1 and MMP-8 expression in HSFs, indicating that miR-16-5p has direct antifibrotic effects. However, the potential molecular mechanisms underlying those effects should be investigated further in future studies.
Prior studies reported that NOTCH signaling, which is responsible for profibrotic phenotypes in vitro and tissue fibrosis in vivo, is activated in fibroblasts extracted from SSc patients’ skin [24]. Accumulating evidence also indicates that miR-16-5p is an important regulator of NOTCH signaling [25–26]. The bioinformatics results of this study indicate that NOTCH2 is enriched in SSc patients, and qRT-PCR also demonstrated that NOTCH2 levels were elevated in the serum of SSc patients. We therefore verified the association between miR-16-5p and NOTCH2 in vitro and found that miR-16-5p partially reversed NOTCH2-dependent myofibroblast activation. These results suggest that miR-16-5p affects myofibroblast activation by regulating NOTCH signaling.
In summary, our data show that miR-16-5p is downregulated in SSc patients compared to healthy controls, and this downregulation is crucial for NOTCH2 signaling-induced myofibroblast activation. Additionally, our findings suggest that drugs that inhibit miR-16-5p overexpression might be a promising clinical treatment for SSc.
Materials and Methods
Identification of differentially expressed genes (DEGs) and differentially expressed miRNAs (DEMs)
The GSE137472 (miRNAs) and GSE145120 (mRNAs) microarray datasets including SSc patients and control subjects were retrieved from NCBI Gene Expression Omnibus (GEO). The online software GEO2R was used to identify DEGs using default settings. Gene expression was visualized using imageGP (http://www.ehbio.com/ImageGP/index.php/home/index/pheatmap.html). Genes with logFC >0.4 or <-0.4 were considered DEGs, and miRNAs with logFC >0.1 or <-0.1 were considered DEMs.
Gene ontology (GO) and kyoto encyclopedia of genes and genomes (KEGG) pathway analyses
The online Database for Annotation, Visualization and Integrated Discovery (DAVID) Bioinformatics Resources version 6.8 tool was used to perform GO term and KEGG pathway enrichment analysis of the DEGs. Results were visualized by GOplot, and the volcano plot was generated using GraphPad Prism 8.0.
MiRNA target gene prediction
The online prediction tool TargetScanHuman (http://www.targetscan.org/vert_72/) was used to identify target genes of the differentially expressed miRNAs. The results of target gene analysis were visualized using Cytoscape 3.7.2.
Ethical statement
The study protocols were approved by the Ethics Committee of Affiliated Zhoupu Hospital, Shanghai University of Medicine and Health Sciences, and informed consent was obtained from all participants.
Blood collection
Peripheral blood samples were collected from patients at our Hospital. (30 healthy volunteers, 30 SSc patients) from May 2018 to March 2020 for measurement of miR-16-5p and NOTCH2 mRNA expression.
Cell culture and transfection
High-glucose Dulbecco's modified eagle medium (Gibco BRL, Grand Island, USA) was used to culture human skin fibroblasts (HSFs, FuHeng Biology, Shanghai, China). HSFs were cultured at 37° C with 5% CO2 and 95% humidity. The agomiR and antagomiR transfection constructs were purchased from GenePharma (Shanghai), and transfection was performed according to the manufacturer’s protocol using a concentration of 200 mM. RNA interference was used for endogenous NOTCH2 knockdown. siRNA oligonucleotides were purchased from Life Technologies, and transfection was performed using Lipofectamine RNAiMAX (Life Technologies) according to the manufacturer's protocol. The NOTCH2 expression plasmid was purchased from the Public Protein/Plasmid Library (PPL, #BC071562).
Luciferase reporter assay
The putative miR-16-5p target site (nucleotides 44-50) was identified using TargetScan (version 7.0; http://www.targetscan.org/vert_70/). PCR was then used to amplify this target site from HSF cDNA, and the sequence was ligated to the pGL3-basic vector (Promega Corporation). To create the pGL3-NOTCH2-3’UTR-mutant (Mut) vector, two site mutations were made in the potential miR-16-5p target site using a QuikChange Site-Directed Mutagenesis kit (Agilent Technologies, Inc.). Next, Lipofectamine® 2000 (Thermo Fisher Scientific) was used to co-infect HSFs with the Renilla plasmid and either pGL3-NOTCH2-3’UTR-wild-type (200 ng) or pGL3-NOTCH2-3’UTR-Mut (200 ng). HSFs were then transfected with the miRNA negative control mimic (10 nM) or miR-16-5p mimic (10 nM) for 48 h at 37° C. A Dual-Luciferase Reporter assay system (Promega Corporation) was used to measure the relative luciferase activity of each well.
qRT-PCR analysis
First, total RNA was isolated from cells and serum samples using TRIzol® reagent (Thermo Fisher Scientific). Next, the reverse-transcription was performed using ReverTra Ace® qPCR RT Master Mix (Toyobo Life Science) to obtain cDNA based on the manufacturer’s protocol. Relative miRNA levels were normalized to GAPDH levels (the internal control) and were calculated using the 2-ΔΔCt approach. All experiments were conducted in triplicate; miRNA and mRNA primer sequences are listed in Table 3.
Table 3. microRNAs and mRNA primer sequences.
| microRNA or gene names | Primer sequence (5’ to 3’) |
| hsa-miR-16-5p-Forward | TGGGGTAGCAGCACGTAAA |
| hsa-miR-16-5p-Reverse | CTCAACTGGTGTCGTGGAGTC |
| hsa-U6-Forward | CTCGCTTCGGCAGCACA |
| hsa-U6-Reverse | AACGCTTCACGAATTTGCGT |
| hsa-MMP-1-Forward | CTGCTTACGAATTTGCCGACAGA |
| hsa-MMP-1-Reverse | GTTCTAGGGAAGCCAAAGGAGCTG |
| hsa-MMP-8-Forward | AGTGCCTGACAGTGGTGGTT |
| hsa-MMP-8-Reverse | TCCCTGTGAGATCCTGGTGA |
| hsa-Notch2-Forward | GGGACCCTGTCATACCCTCT |
| hsa-Notch2-Reverse | GAGCCATGCTTACGCTTTCG |
| hsa-α-SMA-Forward | TGTATGTGGCTATCCAGGCG |
| hsa-α-SMA-Reverse | AGAGTCCAGCACGATGCCAG |
| hsa-Col-1a1-Forward | CCTCCAGGGCTCCAACGAG |
| hsa-Col-1a1-Reverse | TCTATCACTGTCTTGCCCCA) |
| hsa-Col-1a2-Forward | GATGTTGAACTTGTTGCTGAGC |
| hsa-Col-1a2-Reverse | TCTTTCCCCATTCATTTGTCTT |
| hsa-CTGF-Forward | GTGTGCACTGCCAAAGATGGT |
| hsa-CTGF-Reverse | TTGGAAGGACTCACCGCT |
| hsa-GAPDH-Forward | ACCCACTCCTCCACCTTTGA |
| hsa-GAPDH-Reverse | CTGTTGCTGTAGCCAAATTCGT |
Western blotting
Total protein was extracted from HSFs or blood samples, resolved using SDS-PAGE gels (10-15% TrisGlycine), transferred onto Hybond nitrocellulose membranes (Amersham Biosciences), and probed with antibodies specific for NOTCH2 (1:500, #ab8927, Abcam, Cambridge, UK) and GAPDH (1:1000, #ab8245, Abcam). Immunoblots were visualized using species-specific HRP conjugated secondary antibodies (Abcam) and electrochemiluminescence (Thermo/Pierce) on a Bio-Rad ChemiDoc imaging system.
Statistical analysis
GraphPad Prism 8.0 was used to perform statistical analyses. Results are shown as mean ± SD. Student’s t-tests were used to compare two groups, while one-way analysis of variance with Tukey’s post hoc test was used to compare more than two groups. A significance threshold of p < 0.05 was used.
Ethical approval
The Ethics Committee of The Affiliated Zhoupu Hospital, Shanghai University of Medicine and Health Sciences, Shanghai 201318, China approved this study.
Supplementary Materials
Author Contributions
WC, QY, and XX designed the study. QY and YX conducted experiments and performed the bioinformatic analysis, QY, YX, and ZW collected and analyzed the data and produced the initial draft of the manuscript. QY, YX, ZW, JL, QL, MH, YC, BL, and XY revised the figures and tables. QY, YX, ZW, and WC helped draft the manuscript. All authors read and approved the final submitted manuscript.
Conflicts of Interest
The authors declare that they have no conflicts of interest.
Funding
This study was supported by the Research and Development Fund of the Second Affiliated Hospital of Hainan Medical University (Hospital Fund Number: 2018-19) and the Shanghai Pudong New Area Key Discipline Construction Project Fund (Number PWZxk2017-22).
References
- 1. Beretta L, Barturen G, Vigone B, Bellocchi C, Hunzelmann N, De Langhe E, Cervera R, Gerosa M, Kovács L, Ortega Castro R, Almeida I, Cornec D, Chizzolini C, et al, and PRECISESADS SSc substudy group, and PRECISESADS Flow Cytometry study group. Genome-wide whole blood transcriptome profiling in a large European cohort of systemic sclerosis patients. Ann Rheum Dis. 2020; 79:1218–26. https://doi.org/10.1136/annrheumdis-2020-217116 [PubMed]
- 2. Hughes M, Allanore Y, Chung L, Pauling JD, Denton CP, Matucci-Cerinic M. Raynaud phenomenon and digital ulcers in systemic sclerosis. Nat Rev Rheumatol. 2020; 16:208–21. https://doi.org/10.1038/s41584-020-0386-4 [PubMed]
- 3. Maehara T, Kaneko N, Perugino CA, Mattoo H, Kers J, Allard-Chamard H, Mahajan VS, Liu H, Murphy SJ, Ghebremichael M, Fox D, Payne AS, Lafyatis R, et al. Cytotoxic CD4+ T lymphocytes may induce endothelial cell apoptosis in systemic sclerosis. J Clin Invest. 2020; 130:2451–64. https://doi.org/10.1172/JCI131700 [PubMed]
- 4. Khanna D, Tashkin DP, Denton CP, Renzoni EA, Desai SR, Varga J. Etiology, risk factors, and biomarkers in systemic sclerosis with interstitial lung disease. Am J Respir Crit Care Med. 2020; 201:650–60. https://doi.org/10.1164/rccm.201903-0563CI [PubMed]
- 5. Hinz B, Phan SH, Thannickal VJ, Prunotto M, Desmoulière A, Varga J, De Wever O, Mareel M, Gabbiani G. Recent developments in myofibroblast biology: paradigms for connective tissue remodeling. Am J Pathol. 2012; 180:1340–55. https://doi.org/10.1016/j.ajpath.2012.02.004 [PubMed]
- 6. Hinz B, Lagares D. Evasion of apoptosis by myofibroblasts: a hallmark of fibrotic diseases. Nat Rev Rheumatol. 2020; 16:11–31. https://doi.org/10.1038/s41584-019-0324-5 [PubMed]
- 7. Zehender A, Huang J, Györfi AH, Matei AE, Trinh-Minh T, Xu X, Li YN, Chen CW, Lin J, Dees C, Beyer C, Gelse K, Zhang ZY, et al. The tyrosine phosphatase SHP2 controls TGFβ-induced STAT3 signaling to regulate fibroblast activation and fibrosis. Nat Commun. 2018; 9:3259. https://doi.org/10.1038/s41467-018-05768-3 [PubMed]
- 8. Xiong Y, Chen L, Yu T, Yan C, Zhou W, Cao F, You X, Zhang Y, Sun Y, Liu J, Xue H, Hu Y, Chen D, et al. Inhibition of circulating exosomal microRNA-15a-3p accelerates diabetic wound repair. Aging (Albany NY). 2020; 12:8968–86. https://doi.org/10.18632/aging.103143 [PubMed]
- 9. Xiong Y, Chen L, Yan C, Zhou W, Yu T, Sun Y, Cao F, Xue H, Hu Y, Chen D, Mi B, Liu G. M2 macrophagy-derived exosomal miRNA-5106 induces bone mesenchymal stem cells towards osteoblastic fate by targeting salt-inducible kinase 2 and 3. J Nanobiotechnology. 2020; 18:66. https://doi.org/10.1186/s12951-020-00622-5 [PubMed]
- 10. Sun SF, Tang PM, Feng M, Xiao J, Huang XR, Li P, Ma RC, Lan HY. Novel lncRNA Erbb4-IR promotes diabetic kidney injury in db/db mice by targeting miR-29b. Diabetes. 2018; 67:731–44. https://doi.org/10.2337/db17-0816 [PubMed]
- 11. Zhang H, Yang K, Ren T, Huang Y, Tang X, Guo W. miR-16-5p inhibits chordoma cell proliferation, invasion and metastasis by targeting Smad3. Cell Death Dis. 2018; 9:680. https://doi.org/10.1038/s41419-018-0738-z [PubMed]
- 12. Yamada K, Takizawa S, Ohgaku Y, Asami T, Furuya K, Yamamoto K, Takahashi F, Hamajima C, Inaba C, Endo K, Matsui R, Kitamura H, Tanaka S. MicroRNA 16-5p is upregulated in calorie-restricted mice and modulates inflammatory cytokines of macrophages. Gene. 2020; 725:144191. https://doi.org/10.1016/j.gene.2019.144191 [PubMed]
- 13. Körbel C, Gerstner MD, Menger MD, Laschke MW. Notch signaling controls sprouting angiogenesis of endometriotic lesions. Angiogenesis. 2018; 21:37–46. https://doi.org/10.1007/s10456-017-9580-7 [PubMed]
- 14. Portela M, Yang L, Paul S, Li X, Veraksa A, Parsons LM, Richardson HE. Lgl reduces endosomal vesicle acidification and Notch signaling by promoting the interaction between Vap33 and the V-ATPase complex. Sci Signal. 2018; 11:eaar1976. https://doi.org/10.1126/scisignal.aar1976 [PubMed]
- 15. Rajakulendran N, Rowland KJ, Selvadurai HJ, Ahmadi M, Park NI, Naumenko S, Dolma S, Ward RJ, So M, Lee L, MacLeod G, Pasiliao C, Brandon C, et al. Wnt and Notch signaling govern self-renewal and differentiation in a subset of human glioblastoma stem cells. Genes Dev. 2019; 33:498–510. https://doi.org/10.1101/gad.321968.118 [PubMed]
- 16. Huang H, Cui G, Tang H, Kong L, Wang X, Cui C, Xiao Q, Ji H. Silencing of microRNA-146a alleviates the neural damage in temporal lobe epilepsy by down-regulating Notch-1. Mol Brain. 2019; 12:102. https://doi.org/10.1186/s13041-019-0523-7 [PubMed]
- 17. Wasson CW, Abignano G, Hermes H, Malaab M, Ross RL, Jimenez SA, Chang HY, Feghali-Bostwick CA, Del Galdo F. Long non-coding RNA HOTAIR drives EZH2-dependent myofibroblast activation in systemic sclerosis through miRNA 34a-dependent activation of NOTCH. Ann Rheum Dis. 2020; 79:507–17. https://doi.org/10.1136/annrheumdis-2019-216542 [PubMed]
- 18. Rani N, Nowakowski TJ, Zhou H, Godshalk SE, Lisi V, Kriegstein AR, Kosik KS. A primate lncRNA mediates Notch signaling during neuronal development by sequestering miRNA. Neuron. 2016; 90:1174–88. https://doi.org/10.1016/j.neuron.2016.05.005 [PubMed]
- 19. Rodriguez P, Sassi Y, Troncone L, Benard L, Ishikawa K, Gordon RE, Lamas S, Laborda J, Hajjar RJ, Lebeche D. Deletion of delta-like 1 homologue accelerates fibroblast-myofibroblast differentiation and induces myocardial fibrosis. Eur Heart J. 2019; 40:967–78. https://doi.org/10.1093/eurheartj/ehy188 [PubMed]
- 20. Tsubouchi K, Araya J, Minagawa S, Hara H, Ichikawa A, Saito N, Kadota T, Sato N, Yoshida M, Kurita Y, Kobayashi K, Ito S, Fujita Y, et al. Azithromycin attenuates myofibroblast differentiation and lung fibrosis development through proteasomal degradation of NOX4. Autophagy. 2017; 13:1420–34. https://doi.org/10.1080/15548627.2017.1328348 [PubMed]
- 21. Philippeos C, Telerman SB, Oulès B, Pisco AO, Shaw TJ, Elgueta R, Lombardi G, Driskell RR, Soldin M, Lynch MD, Watt FM. Spatial and single-cell transcriptional profiling identifies functionally distinct human dermal fibroblast subpopulations. J Invest Dermatol. 2018; 138:811–25. https://doi.org/10.1016/j.jid.2018.01.016 [PubMed]
- 22. Hibbert SA, Watson RE, Griffiths CE, Gibbs NK, Sherratt MJ. Selective proteolysis by matrix metalloproteinases of photo-oxidised dermal extracellular matrix proteins. Cell Signal. 2019; 54:191–99. https://doi.org/10.1016/j.cellsig.2018.11.024 [PubMed]
- 23. Seifert O, Mrowietz U. Keloid scarring: bench and bedside. Arch Dermatol Res. 2009; 301:259–72. https://doi.org/10.1007/s00403-009-0952-8 [PubMed]
- 24. Dees C, Tomcik M, Zerr P, Akhmetshina A, Horn A, Palumbo K, Beyer C, Zwerina J, Distler O, Schett G, Distler JH. Notch signalling regulates fibroblast activation and collagen release in systemic sclerosis. Ann Rheum Dis. 2011; 70:1304–10. https://doi.org/10.1136/ard.2010.134742 [PubMed]
- 25. Hui S, Yang Y, Li J, Li N, Xu P, Li H, Zhang Y, Wang S, Lin G, Li S, Qiu G, Zhao RC, Zhang J, Zhuang Q. Differential miRNAs profile and bioinformatics analyses in bone marrow mesenchymal stem cells from adolescent idiopathic scoliosis patients. Spine J. 2019; 19:1584–96. https://doi.org/10.1016/j.spinee.2019.05.003 [PubMed]
- 26. Ye X, Wei W, Zhang Z, He C, Yang R, Zhang J, Wu Z, Huang Q, Jiang Q. Identification of microRNAs associated with glioma diagnosis and prognosis. Oncotarget. 2017; 8:26394–403. https://doi.org/10.18632/oncotarget.14445 [PubMed]