


Introduction
The RIPK2 kinase transduces signaling downstream of the intracellular peptidoglycan sensors, nucleotide-binding, and oligomerization domain (NOD1) and NOD2, to promote a productive inflammatory response [1, 2]. The NOD1 and NOD2 are cytosolic Nod-like receptor (NLR) family proteins, activation of which will further activate NF-κB and MAP kinases, leading to the transcription of pro-inflammatory cytokines and the induction of autophagy [3]. Signaling by NOD2-RIPK2 has attracted wide scientific attention owing to its significant role in numerous diseases, making pharmacologic inhibition of RIPK2 activity be a promising strategy [2, 4]. Accumulating studies have implicated that RIPK2 predominantly expresses in the human breast, kidney, liver, and ovary tissues, and is upregulated in different types of tumors, including bladder, breast, and lung cancers [5–8]. As a remarkable association between the expression level of the RIPK2 gene and oncogenesis has been established, it has been shown as a potential target for cancer therapeutic intervention.
Kidney renal clear cell carcinoma (KIRC) is the eighth most common type of cancer and accounts for 70–80% of renal cell carcinoma, representing 4.2% of all new cancer cases, with about 73,820 new cases and 14,770 deaths estimated for 2019 in the United States [9]. Generally, there is no early clinical symptom revealed until the volume of the tumor is large enough. Thus, most KIRC patients are diagnosed in the medium or late stages, in which the mortality and recurrence rates are quite high. It is urgent to study the carcinogenesis and progression of KIRC and identify some biomarkers for the early diagnosis of KIRC [10, 11]. However, to date, limited is known about the oncogenesis and pathogenesis of KIRC, and few biomarkers for clinical use has been found. As far as we have known, the oncogenic and prognosis role of the RIPK2 gene in KIRC has not been systematically analyzed, and additional investigations are merited.
As one of the largest cancer genomics databases, The Cancer Genome Atlas (TCGA) has profiled more than five hundred KIRC samples with genomic alterations, expression profiles, and clinical annotations data have been involved. The genomics, transcriptomics, and clinical data of the KIRC cohort (a total of 526 tumor samples) from the TCGA database were been explored to obtain a better understanding of the roles of the RIPK2 gene in the carcinogenesis process of KIRC. We investigated the somatic mutations, copy number variation, expression profiling, immunological features of the tumor microenvironment, and clinical association significance of the RIPK2 gene in this work. Our analysis demonstrated that RIPK2 upregulation correlated with signature genes of tumor immunity, clinical features of metastasis, and high histological grade, suggesting that RIPK is a potential oncogene and unfavorable clinical prognosis marker for KIRC.
Results
Oncogenic role and prognosis value of RIPK2 upregulation
First, the mRNA expression value of RIPK2 was determined in KIRC samples based on RNA-sequencing data of the TCGA database. The results showed that the RIPK2 gene was dramatically higher expressed in KIRC tumor samples (N = 526) compared with normal tissues (N=72) (Figure 1A, top, log-scale). The over-expression trend of RIPK2 was also detected when compared with the matched tumor samples with adjacent normal samples (P < 0.0001) (Figure 1A, bottom, linear-scale). To further investigate whether the upregulation of RIPK2 is due to the gene copy number amplification or epigenetics change (like promoter demethylated), we interrogated the chromosomal segment to determine the copy number alterations of KIRC samples. The KIRC patients could be stratified into four sub-groups based on the copy number values of gene RIPK2 estimated by GISTIC2 algorithm (Low-level deletion sub-group, N = 64; Diploid sub-group, N = 389; Low-level amplification sub-group, N = 62; High-level amplification sub-group, N = 3) [12, 13]. The results revealed that about one-fifth of all KIRC samples harbored RIPK2 copy number amplification (Figure 1B), and consistently, exhibited higher gene expression value than those harboring diploid RIPK2. In addition, we did not find any association between the methylation level at the gene region of RIPK2 and its mRNA expression level (Figure 1C). Consequently, copy number gains of the gene RIPK2 was likely the key machinery that contributes to the overexpression in KIRC patients. Furthermore, the upregulation of RIPK2 was also confirmed at both protein level, while the phosphorylation level of RIPK2 that representing it activated state was also significantly increased in KIRC samples (Supplementary Figure 2, 3).
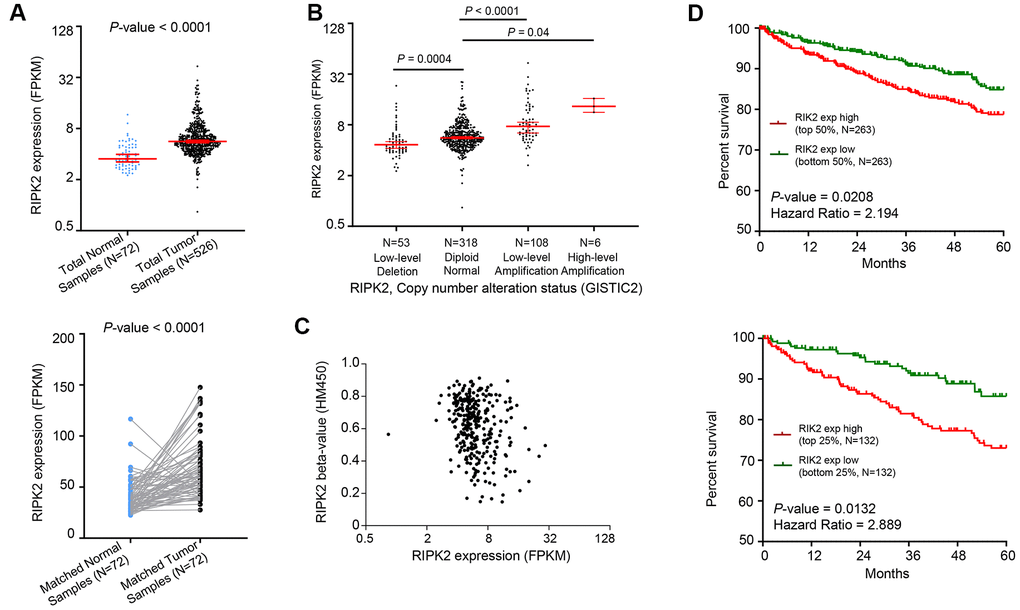
Figure 1. Oncogenic role of RIPK2 in human kidney cancer. (A) Change of RIPK2 mRNA expression between tumor samples and normal samples from TCGA KIRC studies. (B) Dot plot showing the positive correlation between RIPK2 copy number values defined by GISTIC2 approach and mRNA expression values quantified by FPKM. (C) Dot plot showing the correlation between RIPK2 methylation values defined by HM450 approach and mRNA expression values quantified by FPKM. (D) Kaplan–Meier survival curve comparing the high and low expression value of RIPK2 (determined by the mean or quantile value) for the TCGA KIRC patient cohort. Statistical significance was determined by one-way ANOVA and the log-rank test.
Since the RIPK2 gene was aberrantly upregulated in KIRC tumor samples, we next determined the prognostic value of its expression in KIRC patients. As shown in Figure 1D, the comparison of Kaplan–Meier curves (5-year overall survival) determined by the quartile (median, respectively) of RIPK2 gene expression value revealed that higher expression sub-group was significantly correlated with inferior survival for KIRC patients. Taken together, a positive correlation between gene copy number amplification and over-expression of the gene RIPK2 was observed in KIRC tumor samples, and its up-regulated expression could serve as an adverse prognostic marker for KIRC patients.
RIPK2 upregulation is associated with the dysregulated immune pathway
We next performed the differential gene expression (DGE) analysis between RIPK2 high-expression sub-group (N = 132) and RIPK2 low-expression sub-group (N = 132) based on the KIRC cohort of the TCGA database (Figure 2). In total, we identified 471 significantly up-regulated genes and 263 down-regulated genes in RIPK2 high expression samples when compared with low expression samples (Supplementary Table 1). And more interestingly, when we performed the gene ontology (GO) enrichment analysis by using these up-regulated genes as input, the results showed that nearly all of the enriched functional terms (9 of the top 10 enriched gene ontology terms) were immune-related (Figure 2B). Then, the gene set enrichment analysis (GSEA) by using the KEGG pathway gene sets from MSigDB database was also been employed (Figure 3A), which revealed that most of the immunologically related pathways (Cytokine-cytokine receptor interaction pathway, Antigen processing and presentation pathway, Natural killer cell mediated cytotoxicity, B cell receptor signaling pathway, T cell receptor signaling pathway) were positively enriched in samples harboring RIPK2 high-expression compared with RIPK2-low expression samples (Figure 3A, Supplementary Figure 1). We also found a very limited number of significantly enriched metabolism-related gene sets (Butanoate metabolism pathway, Valine, leucine, and isoleucine degradation pathway, Propanoate metabolism pathway) were negatively enriched in RIPK2 high-expression KIRC patients (Figure 3B). Consistently, most significantly KEGG pathway gene sets (the two of three) that enriched in sub-groups with RIPK2 high-expression of KIRC patients were immune signaling related pathways (Figure 3B).
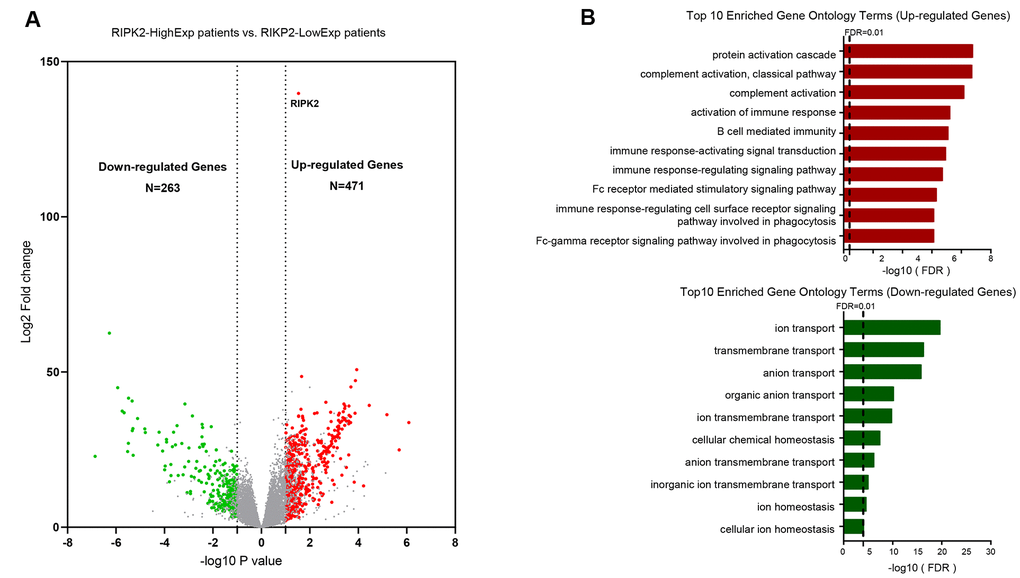
Figure 2. Identification of differentially upregulated expressed genes. (A) Volcano plot of mRNA expression changes between KIRC samples harboring RIPK2 high- and low- expression value. The x-axis specifies the log2 fold-changes (FC) and the y-axis specifies the negative logarithm to the base 10 of the adjusted p-values. Gray vertical and horizontal dashed lines reflect the filtering criteria. Red and green dots represent genes expressed at significantly higher or lower levels, respectively. (B) Top 10 Gene ontology enrichment terms for up-regulated (top) and down-regulated (bottom) genes, respectively.
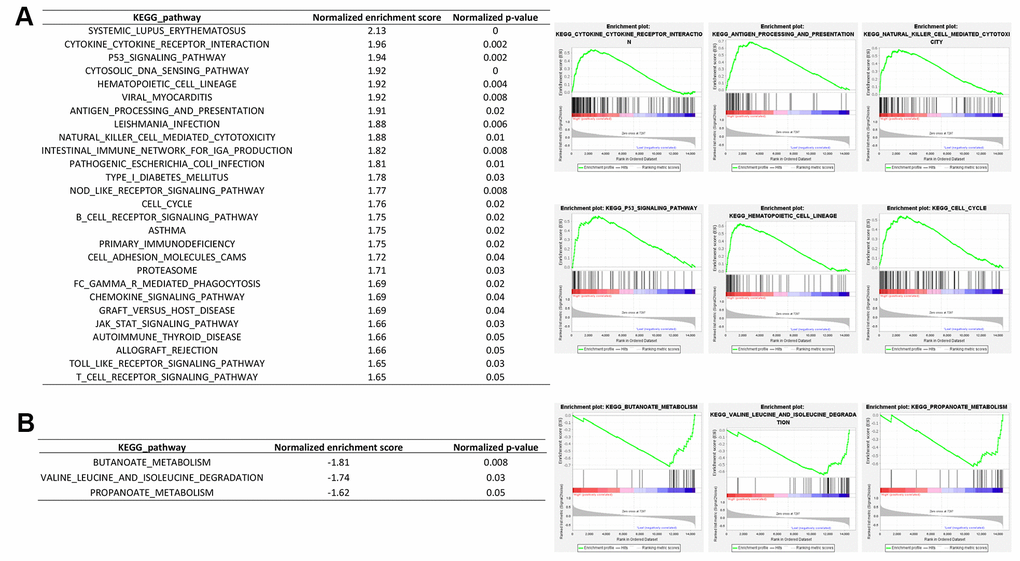
Figure 3. Gene set enrichment analysis between RIPK2 high- and low- expression samples. GSEA comparing gene-expression signatures of TCGA KIRC tumors with the RIPK2 high- and low-expression by using hallmark gene sets. GSEA positive result table (A) showing all the significant enrichment terms of the hallmark keg pathway gene sets from MSigDB, and GSEA negative result table (B) showing significant enrichment terms of the KEGG pathway gene sets from MSigDB.
Interaction pattern and immune phenotypes changes by RIPK2 upregulation in the kidney tumor microenvironment
The tumor microenvironment is a dynamic multi-scale molecular and cellular networks with high complexity that plays critical roles in tumor prevention, but also its initiation and progression. To determine the network-based interaction pattern change of the immunological activity, we next performed the pathways enrichment and signaling network analysis by using the Ingenuity Pathway Analysis (IPA) software. The identified significantly up-regulated genes in KIRC samples based on the above analysis were used as the input gene list. The results showed that among all the enriched networks, about half (7/14) are immune-related, which were consistent with differential expression analysis and GSEA pathway activity results (Figure 4A). The network representation of the high-ranked immunological signal network associated with “Cell-To-Cell Signaling and Interaction, Cellular Movement, Immune Cell Trafficking” was shown in Figure 4B. Collectively, these data demonstrated an obvious positive correlation between dysregulation of RIPK2 gene expression and immunological changes in the tumor microenvironment. Considering KIRC is usually abundant in immune infiltrates consisting of lymphocytes, dendritic cells, macrophages, and others. Different functions are ascribed to the different subsets of immune cells. The role of the immune system changes in kidney cancer is not only observed through the inflammatory mediators but also at the cellular level, that is, via the changes of immune phenotypes and cellular interactions would lead to tumor microenvironment reorganizations. Furthermore, to investigate whether some specific subsets of leukocytes were affected by the RIPK2 expression level, we estimated the abundance of each immune cell phenotype in the tumor microenvironment of KIRC by using the TIMER algorithm [14]. Among the major tumor-infiltrating immune effector cells that can be identified by TIMER, including T cell (CD4 T cells and CD8 T cells), B cells, macrophages, neutrophils, and dendritic cells. As shown in Figure 5A, most of the immune cell phenotypes had a higher infiltration level in RIPK2-overexpression samples compared with low expression KIRC samples, except for CD4 T cells.
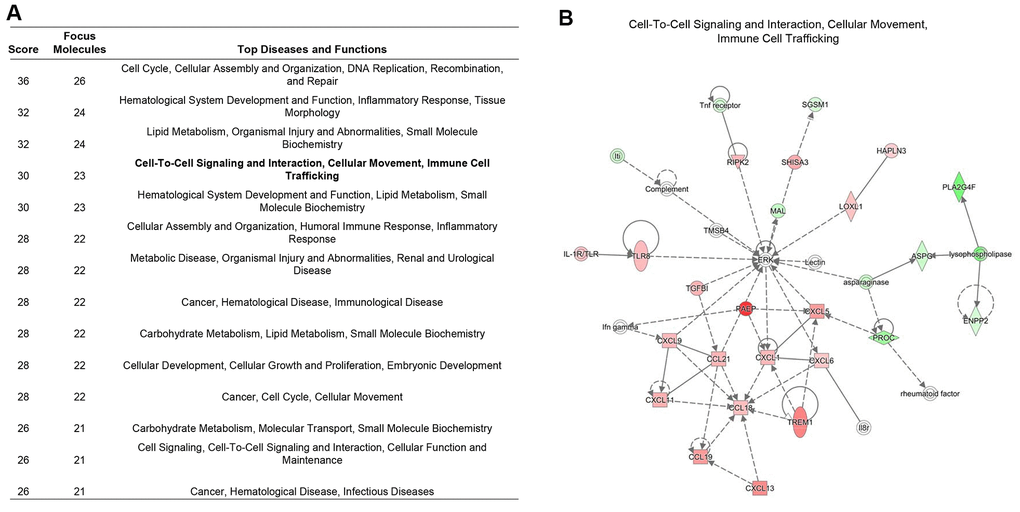
Figure 4. Immune signaling interactions and network analysis. (A) The table showed the significant signaling networks actively compared between the RIPK2 high-, and low-expression samples by using Ingenuity Pathway Analysis (IPA) database. (B) The highest-ranked immunological signal pathway network revealed by IPA. Proteins indicated in red were up-regulated in RIPK2-high KIRC samples and the intensity of red means the foldchange. The shapes are indicative of the molecular class (i.e. protein family). Lines connecting the molecules indicate molecular relationships. In detail, dashed lines indicate indirect interactions, and solid lines indicate direct interactions. The style of the arrows indicates specific molecular relationships and the directionality of the interaction (A acts on B).
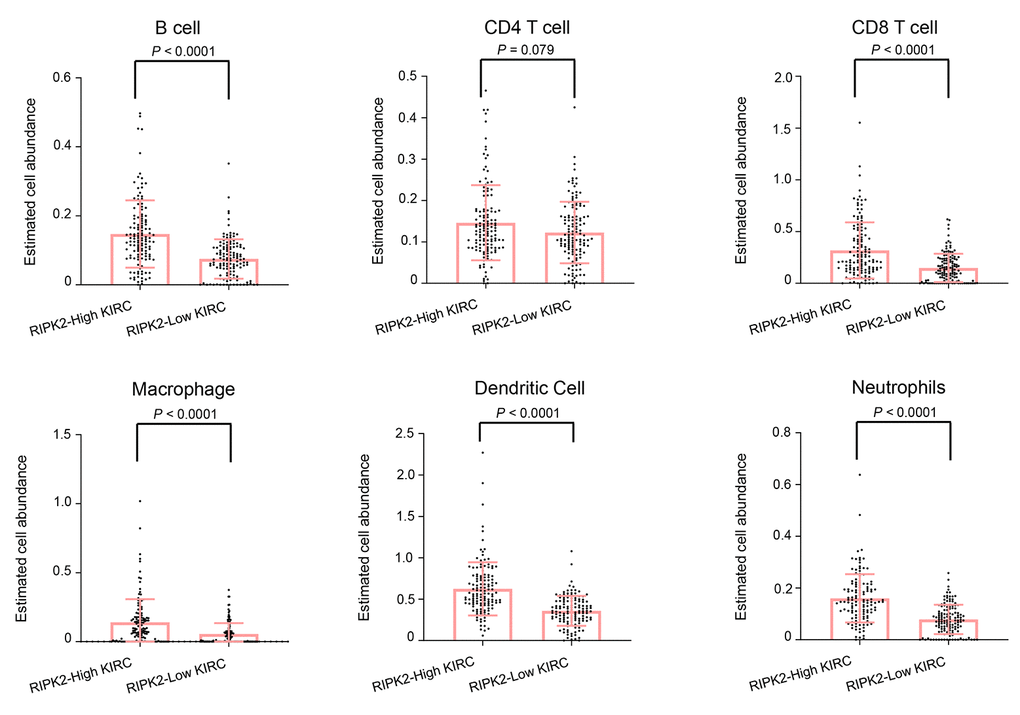
Figure 5. The difference in estimated immune cell fraction. Distribution plot of estimated immune cell fraction among between RIPK2 high- and low- expression samples. Statistical significance was determined by the Wilcoxon rank-sum test.
RIPK2 upregulation samples exhibit a selective increase of SETD2 and BAP1 genomic alterations
There are many well-recognized hyper-mutated genes (VHL, PBRM1, SETD2, BAP1, and MTOR) in KIRC patients cohorts from the TCGA database. So we next evaluated the correlation of the RIPK2 over-expression and the mutation profile of these genes to examine whether the tumor samples with RIPK2 upregulation were enriched for some specific somatic alterations. The OncoPrint function (from cBioPortal for Cancer Genomics web-server toolkits, https://www.cbioportal.org/) was employed to investigate the somatic mutation rate of these top five altered genes in the TCGA KIRC cohort (Figure 6A). Interestingly, the results revealed that the alteration rate of SETD2 and BAP1 genes in the sub-group of KIRC patients with RIPK2 high-expression is 3-fold higher than RIPK2 low-expression sub-group (Figure 6B). Recent studies identified SETD2 functions as a tumor suppressor in kidney cancer, which was frequently inactivated and associated with the recurrence of clear cell renal cell carcinoma [15, 16]. For BAP1, it had been proven that BAP1 served as a tumor suppressor, and the loss of BAP1 could result in enhanced mesenchymal-epithelial transition in kidney tumor cells [17, 18]. However, the expression of both SETD2 and BAP1 was not affected by RIPK2 knockdown (Supplementary Figure 4F, 5B, 5C).
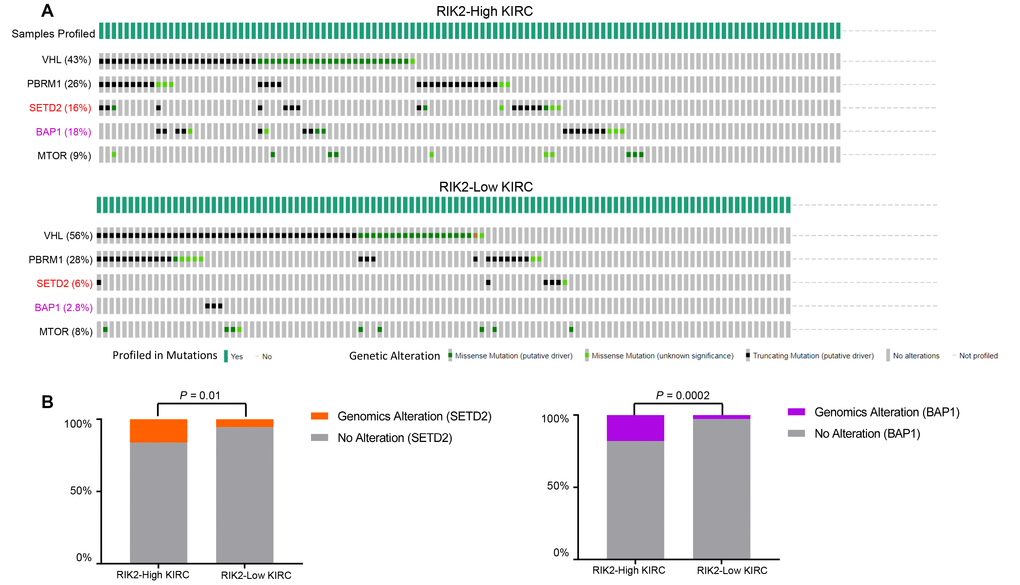
Figure 6. SETD2 and BAP1 genomic alterations are selectively enriched in RIPK2-high expression samples. (A) cBioPortal OncoPrint plot showing the distribution of VHL, PBRM1, CDKN2A, SETD2, BAP1, and MTOR genomic alterations rate in the TCGA KIRC dataset. (B) Bar graphs showing the percentage of TCGA KIRC samples with genomic alterations in SETD2 and BAP1 by different RIPK2 expression groups.
Associations between tumor clinical state and RIPK2 expression
We next analyzed the distribution of clinical and pathological features among different RIPK2 expression sub-groups. As expected, the tumor samples with metastasis status: M1 (spread to other parts of the body patients) were dramatically enriched in the sub-groups of KIRC patients harboring high-expression of the RIPK2 gene (P < 0.0001, Figure 7A). Moreover, we also observed that there were dramatic differences in tumor stage (Figure 7B) and histologic grade (Figure 7C) distribution between high- and low-expression of RIPK2 sub-groups. The tumors with RIPK2 over-expression showed an increased risk of the high-grade stage when compared with RIPK2 low-expression samples, and this was also confirmed at protein levels of both total protein and phosphorylation state (Supplementary Figure 3).
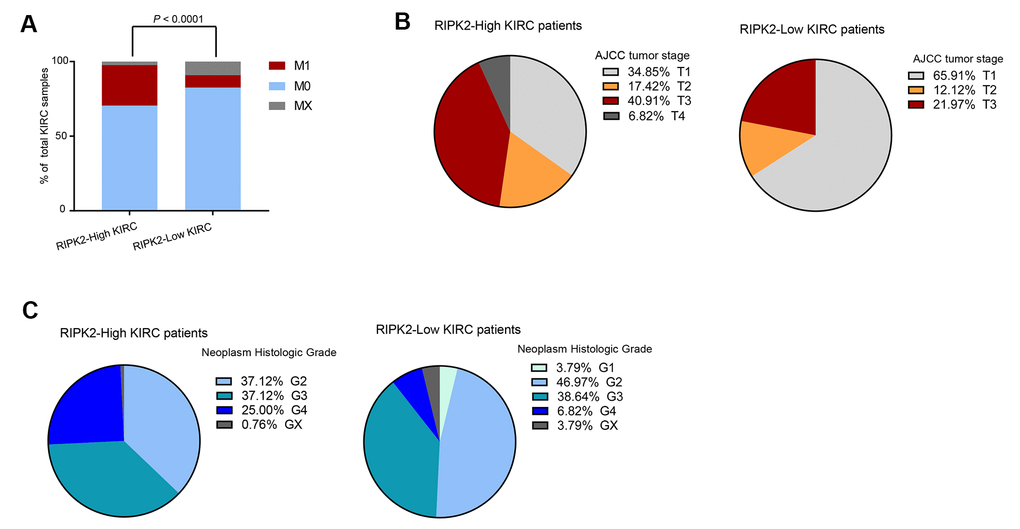
Figure 7. The difference in clinical characteristics between RIPK2 high- and low- expression samples. (A) Distribution of M0 and MX samples among different RIPK2 expression subtypes of KIRC from the TCGA patient cohort and functional modules activation analysis by IPA based on up-regulated genes in RIPK2-high samples. (B) Distribution of tumor stages among different RIPK2 expression subtypes. (C) The distribution plot of the patient’s somatic mutation count (left) and the patient’s fraction of copy number altered (right) among KIRC patients between RIPK2 high- and low- expression samples.
Inhibition of RIPK2 activity suppressed cell proliferation in vitro and in vivo
To investigate the relationship between RIPK2 expression and tumorigenic capacity, we firstly knocked down RIPK2 expression by shRNA strategy. Realtime PCR and Western blot results showed that the expression level of RIPK2 was reduced to about 20% by two different shRNA (Figure 8A, 8B). Cell count kit 8 assay and colony formation assay were performed to determine the ability of cell proliferation after RIPK2 knockdown. We found that decreased RIPK2 expression significantly delayed cell proliferation, and colony formation capacity (Figure 8C, 8D). Moreover, cell migration ability was also attenuated after reducing RIPK2 expression (Figure 8E). Mechanistically, RIPK2 knockdown greatly decreased the phosphorylation level of NF-κB and c-Jun N-terminal kinase (JNK), while no change was observed in the total protein levels of NF-κB and JNK. In a complemental experiment, GSK2983559 (3 μM), a selective inhibitor of RIPK2, was used to suppress RIPK2 activity. Expectedly, inhibition of RIPK2 by 3 μM GSK2983559 completely reproduced the effect of RIPK2 knockdown in cell proliferation and migration (Supplementary Figure 4B–4D). Furthermore, the combination of shRNA targeting RIPK2 and GSK2983559 showed no additive inhibitory effect on cell proliferation, thus excluding the possibility for off-target. To evaluate whether RIPK2 can be used as a potential therapeutic target in KIRC, we established the xenograft model by injection of RIPK2-knockdown or control cells into nude mice and monitored the tumor size over time. We observed that, the tumor size of nude mice in the RIPK2-knockdown group was significantly smaller, suggesting that inhibition of RIPK2 activity effectively suppress tumor growth in vivo (Figure 8F). Consistently, administration of GSK2983559 also suppressed the in vivo tumor growth (Supplementary Figure 4E).
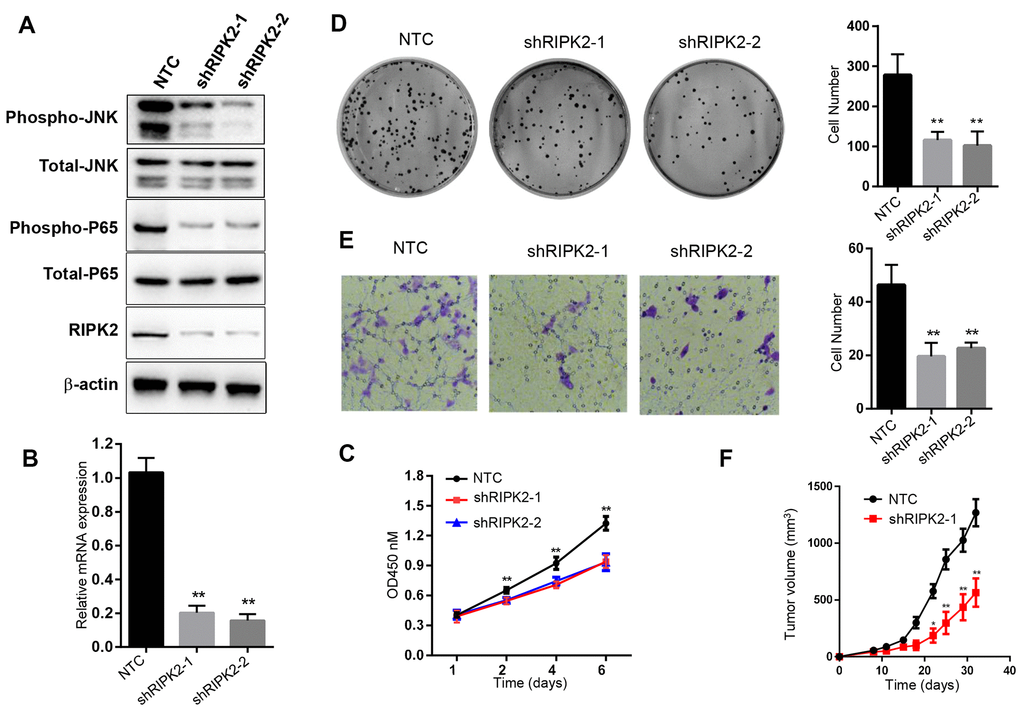
Figure 8. Knockdown of RIPK2 inhibit the 786-O cell proliferation, migration, colony formation and in vivo growth. (A) Western blot analysis of the 786-O cells stably transfected with control shRNA (NTC), or that targeting RIPK2 coding region (shRIPK2-1 and shRIPK2-2). (B) Quantitative PCR analysis of the RIPK2 mRNA level. Data are means ± SD (n=3), **p<0.01; (C) Cell proliferation results expressed in means ± SD (n=5), **p<0.01. (D) Colony formation assay photos (left) and quantitative results (right), Data are means ± SD (n=3), **p<0.01. (E) Migration result of 786-O cells, migrated cells were calculated and expressed with means ± SD (n=5), **p<0.01. (F) In vivo xenograft model of 786-O, the tumor volume was determined twice a week. Tumor volume was expressed in means ± SEM (n=5), **p<0.01.
Discussion
Previous studies have reported that the gene RIPK2 played important roles in both inflammatory activity and tumor invasion and metastasis processes [4, 19]. Serine/threonine/tyrosine kinase contributes to the modulation of innate and adaptive immune responses and is involved in the tyrosine phosphorylation of the guanine exchange factor ARHGEF2 leading to NFκB activation by NOD2 [1, 20]. To our knowledge, this is the first demonstration of RIPK2 upregulation during carcinogenesis in human kidney cancers. Our results highlighted the oncogenic role of RIPK2 over-expression in KIRC and suggested that the copy number amplification would be one of the potential genetic drivers for its upregulation. Furthermore, our data revealed that RIPK2 could serve as a potential unfavorable prognosis biomarker for KIRC patients. In the past few years, even though significant progress in biomedical imaging technology and application has greatly improved the diagnosis of renal cell carcinomas, most of these malignancies are still detected at an advanced stage due to their asymptomatic nature. Consequently, more oncogenes, particularly potential biomarkers for diagnosis and/or prognosis of KIRC are urgently required in this field.
RIPK2 has been associated with activation of the NF-κB, JNK, extracellular signal-regulated kinase (ERK), and mitogen-activated protein kinase (p-38) pathways. RIPK2 also mediates pro-inflammatory signaling from the bacterial sensors NOD1 and NOD2 and is an emerging therapeutic target in autoimmune and inflammatory diseases [19, 21, 22]. Interestingly, a strong correlation between RIPK2 over-expression and dysregulated tumor immune infiltration level was found in this work. RIPK2 promoted various immunological signaling pathways and immune phenotypes (including CD8 T cell, Dendritic cell, B cells, Neutrophils, and Macrophages) in the tumor microenvironment. The tumor microenvironment with chemotactic characteristics would recruit infiltrating immune cells including lymphocytes (such as T cell, B cell, and NK cell) and myeloid cell (such as monocyte, macrophage, and neutrophil). Usually, these infiltrating immune cells serve as a protective antitumoral role in the tumor microenvironment, but they could also contribute to cancer progression under particular circumstances. As exemplified by the tumor-associated macrophages (TAM), they could release angiogenic factors and fibroblast growth factors, which result in tumorigenesis and promote the process of tumor growth, invasion, and apoptotic resistance [7, 13, 23]. Thus, high infiltration of immune cells in kidney tumor samples may support tumors as that tumor cells, in turn, modulate the microenvironment within which they reside. Given that our work showed the potential linking between RIPK2 dysregulated expression and altered immunological activities in the tumor microenvironment of KIRC, we believe that the increase of RIPK2 transcripts would cause NF-κB signaling activation and subsequently contributing to KIRC pathogenesis and aggressiveness. The mechanism is still unclear what causes these links but the results presented lead us to suggest the possible use of RIPK2 as a therapeutic marker, which will shed light on the future development of anti-cancer therapies for KIRC.
In this work, it is a very interesting and promising finding that our results showed the KIRC samples harboring RIPK2 over-expression enriched in the somatics mutants of gene SETD2 and BAP1, these results provided potential interaction between RIPK2 and these two well-known oncogenes of kidney cancer [24, 25]. As far as we have known, the gene RIPK2 is not the target gene of SETD2 and BAP1, and there is no published work that has leaked the possible correlation between them, so it will be an open question for the researcher in this filed. Besides, our data revealed that the copy number amplification probably provides a genetic fix that facilitates RIPK2 overexpression in the KIRC cohort of this study, however, we believe that the gene amplification that we mentioned in this work would not the only mechanism to up-regulate the mRNA expression of the gene RIPK2 in the cancer cells of KIRC. More exploratory and integrative cancer genomics work based on KIRC (such as epigenomics analysis) datasets will be needed in future work.
Conclusions
Our findings identified RIPK2 as a potential oncogenic gene for KIRC and revealed its involvement in dysregulated immunological activities in the tumor microenvironment of KIRC. We also proved that RIPK2 could serve as a novel prognosis marker and therapeutic target in KIRC. In future clinical use, the anti-RIPK2 agents as a potential therapy for KIRC patients may open new avenues for the development of antineoplastic drugs.
Materials and Methods
Plasmids and reagents
shRNA plasmids. RIPK2 shRNA sequence was cloned into SHC201 vector (Sigma-Aldrich) and the plasmids were verified by DNA sequencing. The shRNA primer sequences are as follows: shRIPK2-1: 5′- GGA CAT CGA CCT GTT ATT AAT -3′; sh RIPK2-2: 5′- CAC CAA TCC TTT GCA GAT AAT-3. Antibodies for RIPK2 (ab75257), JNK1+JNK2+JNK3 (ab179461) and JNK1 + JNK2 + JNK3 (phospho Thr183+Thr183+Thr221) (ab124956) were purchased Abcam, and the antibody for β-actin (A5441) was obtained from Sigma-Aldrich; NF-κB p65 (# 8242), Phospho-NF-κB p65 (Ser536) (# 3033) were purchased from Cell Signaling Technology, Inc. GSK2983559 (# S8927) was from Selleck.
Cells and cell culture
Human KIRC cell line 786-O cells (CRL-1932™) and HEK293T cells (CRL-11268™) were obtained from ATCC. 786-O cells were cultured in RPMI-1640 medium (Gibco, 31870082). HEK293T cells were cultured in DMEM medium (Gibco, C11965500BT). The complete culture media were composed of 10% heat-inactivated fetal bovine serum (FBS) (Gibco, 10099-141), 1% antibiotics mixture of penicillin and streptomycin (Gibco, 15070063) and 2 mM glutamine (Gibco, 15140-122). Cells were maintained in a wet incubator at 37° C with 5% CO2. Mycoplasma contamination was tested by PCR.
Lentivirus package
The recombinant SHC201 vectors were co-transfected in HEK293T cells with PMD2.G (Addgene, #12259) and psPAX2 (Addgene, #12260) using Lipofectamine 3000 (Life Technologies) for lentivirus packaging. Then the virus particles were harvested and used to infect 786-O cells. And the infected cells were selected in media supplemented with 5 μg/ml of puromycin for 3 days. SHC201 empty vectors were used as controls.
Cell count kit 8 assay
Cell Counting Kit 8 (Cat. No C0038) was purchased from Beyotimes and used to evaluate cell proliferation. Briefly, 2000 cells were seeded into 96 well plates and cultured with 100 μl complete culture medium. Cell activity was analyzed by adding 10μl CCK8 reagent to each well at day 1, 2, 4 and 6. Multiskan™ FC (Thermo) was used to detect the value of OD450 at each well of the plates after incubation for 1 hour. Experiments were performed in triplicate.
Colony formation assay
786-O cells were cultured in six-diameter dish (500 cells / well) with 4ml complete medium. After 2 weeks incubation, the cells were washed with cold phosphate buffer saline (PBS) and then fixed with methanol for 30min, followed by incubation with crystal violet dye for another 30 min, colonies were imaged and counted for analysis.
Transwell assay
24-well chemotaxis chambers (Corning, #3422) were used to analyze migration potential. 10,000 cells were resuspended in 100 μl serum-free medium and then were added into the top chambers. the bottom chamber was filled with 600ul complete medium. 24 hour later, the membranes were firstly fixed with methanol for about 30 minute at 23° C, ant then were stained with crystal violet for 30 minutes. The migrated cells were imaged and counted in six independent fields per group using a microscope.
qPCR
The total RNA was extracted from 786-O using Trizol (InvivoGen, 15596018) based method according to the manufacturer’s instructions. The first strand of cDNA was synthesized from 1 μg of total RNA with random primers and MMLV reverse transcriptase (Vazyme, R021). The polymerase chain reaction were performed with the CFX-96 Real-Time PCR System (Bio-Rad). The Glyceraldehyde-3-phosphate dehydrogenase (GAPDH) was chosen as an internal control for normalization, and the ΔΔCt method was used to analyze the relative expression of the analyzed genes. Each sample was measured in duplicates. The primer sequences are as follows: GAPDH: sense, 5′- GAA GGT GAA GGT CGG AGT C-3′; antisense, 5′-GAA GAT GGT GAT GGG ATT TC-3′; RIPK2: sense, 5′- CAG AAG CCT GCC TTA ACC -3′; antisense, 5′- CTT GGA TGT CAG TAG TGT CTA -3′; SETD2: sense, 5′- AGA CAG CAG AAG CAG ACA -3′; antisense, 5′- GCA CTG GAC GAT GAA CTG -3′; BAP1: sense, 5′- AAG GAG GAG GTA GAG AAG AG -3′; antisense, 5′- TGA GCC AGC ATG GAG ATA -3′.
Western blot
The 786-O cells were collected and resuspended in lysis buffer (20mM Tris, pH7.5, 150mM NaCl, 5mM EDTA, 0.5% NP-40, 10% glycerol, protease inhibitor cocktail (Roche) at 4° C for 30 minutes, followed by centrifugation (12,000 × g for 15 minutes, at 4° C). The protein concentration was determined by Bicinchoninic acid (BCA) assay. Proteins were separated by SDS–PAGE and immunoblotted with anti-RIPK2 or anti-β-actin antibody.
Animal experiment
All procedures of the animal experiment were approved by the Animal Experiment Ethics Committee of General Hospital of the Chinese People's Liberation Army. Female athymic BALB/c nude mice (aged 5-6 weeks) were purchased from the Vital River Laboratory Animal Technology Co. Ltd. To establish a xenograft model, nude mice were randomized into two groups and 5 × 10⁶ 786-O cells were respectively injected subcutaneously into the right flanks of mice of each group. An electronic caliper was used to measure the length and width of each tumor, and tumor volume was estimated by applying the following equation: volume = length × width2/2. For the in vivo pharmacodynamic model, GSK2983559 was administrated at 50 mg/kg b.i.d doses.
Datasets
The genomics, transcriptomics, and clinical information data of the KIRC cohort were accessed from the TCGA database (Figure 1). Through the TCGA data portal (https://portal.gdc.cancer.gov/, March 2020), the masked copy number segment profiles and mRNA expression quantification profiles (HTSeq–FPKM) of all the KIRC tumor samples were obtained. The GISTIC2 algorithm was used to determine the gain or loss of copy number for each gene by transforming the DNA segment data with a noise threshold [26]. The detailed clinical information and annotated mutation files of KIRC tumor samples were accessed from cBioPortal for Cancer Genomics web-server (http://www.cbioportal.org/index.do, February 2020).
Gene-set enrichment analysis
The gene-set enrichment analysis (GSEA) in this work was performed by using the GSEA software (version 3.0) [27]. The gene signatures that summarize the biological functions and pathway processes were accessed from the Broad Molecular Signatures Database (MSigDB v6.0, https://www.gsea-msigdb.org/gsea/msigdb/).
Then the hallmark gene-sets (N=50) and KEGG pathway gene-sets (N=186) were used as input for GSEA software. The signal-to-noise metric (with default parameters) was employed to rank all genes, and the 1,000 permutations were performed for the estimation of statistical significance.
Survival analysis
To describe the effect of categorical or quantitative variables on overall survival time (5-year), the Kaplan-Meier curve with quantile level (the top 25% and the bottom 25%) as the cut-off value was performed, and the log-rank test was used to estimate the significance among multiple curves. The Cox proportional hazard regression model (5-year overall survival) was employed to perform the univariate survival analysis for the prognostic significance of each feature.
Biostatistical analysis
For comparisons, the Mann-Whitney test (between two groups) and the one-way analysis of variance (ANOVA) test (among multiple groups) were used for statistical significance estimated. For the correlation analysis between two continuous variables, the correlation coefficient (Spearman) was calculated to estimate the significance of the association. For the enrichment analysis, Fisher's exact test was employed for significance estimation. For the differential expression analysis, the DESeq2 algorithm was used to perform between RIPK2-high and RIPK2-low KIRC samples [28] (False Discovery Rate (FDR) <0.05), log2ratio of expression mean value>1, and the difference of the mean value of normalized counts for each gene >500) to determine the significant difference. All the statistical calculations were performed using R software (https://www.r-project.org/) and the graphs display were performed by using GraphPad PRISM software (version 8.3, GraphPad Software, Inc.).
Ingenuity pathway analysis
The Ingenuity Pathway Analysis (IPA) software was used for pathway enrichment and signaling network analysis in this work. The significantly up-regulated gene expression profile (with fold-change and P-value) based on DEG analysis was employed for the IPA software as the input gene list. Then the two functional models (1, Canonical Pathways, and 2, Signaling Network Analysis) of IPA software were run with default parameters.
Availability of data or materials
The datasets used for the current study are available upon reasonable request from the corresponding author.
Author Contributions
Diangeng Li, Liangyou Tang, and Wu Bo designed and conducted the experiments; Bo Liu contributed to the animal experiments; Xu Shibo performed the clinical data analysis, Diangeng Li wrote the manuscript; Meiling Jin and Bo Wu supervised the project and edited the manuscript.
Acknowledgments
We thank Academician Xiangmei Chen for his professional advice on this work and Zhang Xianpeng for his support in the field of bioinformatics.
Conflicts of Interest
The authors declare that they have no conflicts of interest.
Funding
This research was supported by Beijing Municipal Natural Science Foundation(No. 7204308); grants from Shanxi key research and development program (Social development aspects 201803D31110); the National Natural Science Foundation of China (No. 81901404); the National Natural Science Foundation of China (No. 81900605); the Open Project Program of the State Key Laboratory of Kidney Diseases in PLA General Hospital (No. KF2018-06).
References
- 1. Hrdinka M, Schlicher L, Dai B, Pinkas DM, Bufton JC, Picaud S, Ward JA, Rogers C, Suebsuwong C, Nikhar S, Cuny GD, Huber KV, Filippakopoulos P, et al. Small molecule inhibitors reveal an indispensable scaffolding role of RIPK2 in NOD2 signaling. EMBO J. 2018; 37:e99372. https://doi.org/10.15252/embj.201899372 [PubMed]
- 2. Tigno-Aranjuez JT, Benderitter P, Rombouts F, Deroose F, Bai X, Mattioli B, Cominelli F, Pizarro TT, Hoflack J, Abbott DW. In vivo inhibition of RIPK2 kinase alleviates inflammatory disease. J Biol Chem. 2014; 289:29651–64. https://doi.org/10.1074/jbc.M114.591388 [PubMed]
- 3. Shi Y, Lv X, Liu Y, Li B, Liu M, Yan M, Liu Y, Li Q, Zhang X, He S, Zhu M, He J, Zhu Y, et al. Elevating ATP-binding cassette transporter G1 improves re-endothelialization function of endothelial progenitor cells via Lyn/Akt/eNOS in diabetic mice. FASEB J. 2018; 32:6525–36. https://doi.org/10.1096/fj.201800248RR [PubMed]
- 4. Nachbur U, Stafford CA, Bankovacki A, Zhan Y, Lindqvist LM, Fiil BK, Khakham Y, Ko HJ, Sandow JJ, Falk H, Holien JK, Chau D, Hildebrand J, et al. A RIPK2 inhibitor delays NOD signalling events yet prevents inflammatory cytokine production. Nat Commun. 2015; 6:6442. https://doi.org/10.1038/ncomms7442 [PubMed]
- 5. Zare A, Petrova A, Agoumi M, Amstrong H, Bigras G, Tonkin K, Wine E, Baksh S. RIPK2: new elements in modulating inflammatory breast cancer pathogenesis. Cancers (Basel). 2018; 10:184. https://doi.org/10.3390/cancers10060184 [PubMed]
- 6. Uramoto H, Yamada T, Yano S, Kondo N, Hasegawa S, Tanaka F. Prognostic value of acquired resistance-related molecules in Japanese patients with NSCLC treated with an EGFR-TKI. Anticancer Res. 2012; 32:3785–90. [PubMed]
- 7. Cortazar P, Zhang L, Untch M, Mehta K, Costantino JP, Wolmark N, Bonnefoi H, Cameron D, Gianni L, Valagussa P, Swain SM, Prowell T, Loibl S, et al. Pathological complete response and long-term clinical benefit in breast cancer: the CTNeoBC pooled analysis. Lancet. 2014; 384:164–72. https://doi.org/10.1016/S0140-6736(13)62422-8 [PubMed]
- 8. Chan LP, Wang LF, Chiang FY, Lee KW, Kuo PL, Liang CH. IL-8 promotes HNSCC progression on CXCR1/2-meidated NOD1/RIP2 signaling pathway. Oncotarget. 2016; 7:61820–31. https://doi.org/10.18632/oncotarget.11445 [PubMed]
- 9. Siegel RL, Miller KD, Jemal A. Cancer statistics, 2019. CA Cancer J Clin. 2019; 69:7–34. https://doi.org/10.3322/caac.21551 [PubMed]
- 10. Angulo JC, Shapiro O. The changing therapeutic landscape of metastatic renal cancer. Cancers (Basel). 2019; 11:1227. https://doi.org/10.3390/cancers11091227 [PubMed]
- 11. Cancer Genome Atlas Research Network. Comprehensive molecular characterization of clear cell renal cell carcinoma. Nature. 2013; 499:43–49. https://doi.org/10.1038/nature12222 [PubMed]
- 12. Zhang P, Zheng P, Liu Y. Amplification of the CD24 gene is an independent predictor for poor prognosis of breast cancer. Front Genet. 2019; 10:560. https://doi.org/10.3389/fgene.2019.00560 [PubMed]
- 13. Zwergel C, Schnekenburger M, Sarno F, Battistelli C, Manara MC, Stazi G, Mazzone R, Fioravanti R, Gros C, Ausseil F, Florean C, Nebbioso A, Strippoli R, et al. Identification of a novel quinoline-based DNA demethylating compound highly potent in cancer cells. Clin Epigenetics. 2019; 11:68. https://doi.org/10.1186/s13148-019-0663-8 [PubMed]
- 14. Li T, Fan J, Wang B, Traugh N, Chen Q, Liu JS, Li B, Liu XS. TIMER: a web server for comprehensive analysis of tumor-infiltrating immune cells. Cancer Res. 2017; 77:e108–10. https://doi.org/10.1158/0008-5472.CAN-17-0307 [PubMed]
- 15. Liu J, Hanavan PD, Kras K, Ruiz YW, Castle EP, Lake DF, Chen X, O’Brien D, Luo H, Robertson KD, Gu H, Ho TH. Loss of SETD2 induces a metabolic switch in renal cell carcinoma cell lines toward enhanced oxidative phosphorylation. J Proteome Res. 2019; 18:331–40. https://doi.org/10.1021/acs.jproteome.8b00628 [PubMed]
- 16. Stone L. Kidney cancer: SETD2 affects DNA replication. Nat Rev Urol. 2015; 12:183. https://doi.org/10.1038/nrurol.2015.53 [PubMed]
- 17. Chen P, Wang H, Zhang W, Chen Y, Lv Y, Wu D, Guo M, Deng H. Loss of BAP1 results in growth inhibition and enhances mesenchymal-epithelial transition in kidney tumor cells. Mol Cell Proteomics. 2019; 18:1320–29. https://doi.org/10.1074/mcp.RA119.001457 [PubMed]
- 18. Stone L. Bladder cancer: genetic urinary biomarker panel is promising. Nat Rev Urol. 2017; 14:198. https://doi.org/10.1038/nrurol.2017.6 [PubMed]
- 19. Singel SM, Batten K, Cornelius C, Jia G, Fasciani G, Barron SL, Wright WE, Shay JW. Receptor-interacting protein kinase 2 promotes triple-negative breast cancer cell migration and invasion via activation of nuclear factor-kappaB and c-Jun N-terminal kinase pathways. Breast Cancer Res. 2014; 16:R28. https://doi.org/10.1186/bcr3629 [PubMed]
- 20. Duggan BM, Foley KP, Henriksbo BD, Cavallari JF, Tamrakar AK, Schertzer JD. Tyrosine kinase inhibitors of Ripk2 attenuate bacterial cell wall-mediated lipolysis, inflammation and dysglycemia. Sci Rep. 2017; 7:1578. https://doi.org/10.1038/s41598-017-01822-0 [PubMed]
- 21. Tigno-Aranjuez JT, Asara JM, Abbott DW. Inhibition of RIP2’s tyrosine kinase activity limits NOD2-driven cytokine responses. Genes Dev. 2010; 24:2666–77. https://doi.org/10.1101/gad.1964410 [PubMed]
- 22. Jacquet S, Nishino Y, Kumphune S, Sicard P, Clark JE, Kobayashi KS, Flavell RA, Eickhoff J, Cotten M, Marber MS. The role of RIP2 in p38 MAPK activation in the stressed heart. J Biol Chem. 2008; 283:11964–71. https://doi.org/10.1074/jbc.M707750200 [PubMed]
- 23. Chevrier S, Levine JH, Zanotelli VR, Silina K, Schulz D, Bacac M, Ries CH, Ailles L, Jewett MA, Moch H, van den Broek M, Beisel C, Stadler MB, et al. An immune atlas of clear cell renal cell carcinoma. Cell. 2017; 169:736–49.e18. https://doi.org/10.1016/j.cell.2017.04.016 [PubMed]
- 24. Chia JM, Song C, Bradbury PJ, Costich D, de Leon N, Doebley J, Elshire RJ, Gaut B, Geller L, Glaubitz JC, Gore M, Guill KE, Holland J, et al. Maize HapMap2 identifies extant variation from a genome in flux. Nat Genet. 2012; 44:803–07. https://doi.org/10.1038/ng.2313 [PubMed]
- 25. Kanu N, Grönroos E, Martinez P, Burrell RA, Yi Goh X, Bartkova J, Maya-Mendoza A, Mistrík M, Rowan AJ, Patel H, Rabinowitz A, East P, Wilson G, et al. SETD2 loss-of-function promotes renal cancer branched evolution through replication stress and impaired DNA repair. Oncogene. 2015; 34:5699–708. https://doi.org/10.1038/onc.2015.24 [PubMed]
- 26. Mermel CH, Schumacher SE, Hill B, Meyerson ML, Beroukhim R, Getz G. GISTIC2.0 facilitates sensitive and confident localization of the targets of focal somatic copy-number alteration in human cancers. Genome Biol. 2011; 12:R41. https://doi.org/10.1186/gb-2011-12-4-r41 [PubMed]
- 27. Subramanian A, Tamayo P, Mootha VK, Mukherjee S, Ebert BL, Gillette MA, Paulovich A, Pomeroy SL, Golub TR, Lander ES, Mesirov JP. Gene set enrichment analysis: a knowledge-based approach for interpreting genome-wide expression profiles. Proc Natl Acad Sci USA. 2005; 102:15545–50. https://doi.org/10.1073/pnas.0506580102 [PubMed]
- 28. Love MI, Huber W, Anders S. Moderated estimation of fold change and dispersion for RNA-seq data with DESeq2. Genome Biol. 2014; 15:550. https://doi.org/10.1186/s13059-014-0550-8 [PubMed]