


Introduction
Glioblastoma (GBM) is the most prevalent and a deadly primary malignant central nervous system tumor [1]. Genomic profiling has identified three major pathways that are deregulated in GBM: the RTK/Ras/PI3K/AKT signaling, TP53, and RB pathways [2–5]. Many drugs that target these three signaling pathways. However, only a few patients respond to these drugs [6]. Therapeutic failure occurs because of intra-tumor heterogeneity and a lack of effective therapeutic strategies, such as combination therapies [6, 7].
The tumor microenvironment (TME), which involves interactions between immune cells and tumor cells, play pivotal roles in glioma progression [8]. The TME may be shaped by the oncogenic signaling pathways of tumor cells [8, 9]. PTEN deficiency and activation of phosphatidylinositol-3-OH kinase (PI3K) could aggravate CD274 expression and weaken the function of tumor-associated T cells in gliomas [10]. Loss of PTEN in glioblastoma cells increases macrophage infiltration, subsequently supporting glioma-cell survival and promoting angiogenesis [9]. TP53 mutations are associated with increased expression of immune checkpoint genes and activation of effector T cells in lung adenocarcinoma [11]. These findings indicate that combination of oncogenic signaling-pathway inhibitors and immunotherapy is a promising therapeutic strategy for gliomas. One preclinical model suggests that a combination therapy targeting TP53 and PD-1 can kill glioma cells more effectively than monotherapy against either of these targets [12]. Consequently, improving the understanding of the association between oncogenic signaling pathways and the TME in gliomas may lead to the development of therapeutic strategies for patients with gliomas.
This study was conducted to explore the potential changes in the TME caused by alterations in GBM oncogenic signaling pathways due to gene mutations, fusions, or copy number variations. The TME was described based on the expression of immune check point genes, immune-cell infiltration, tumor mutation burden (TMB), immune cytolytic activity (CYT), tumor purity, and tumor infiltrating CD8+ T cells; all of which are predictive biomarkers for immunotherapy.
Results
Identification of RTK/Ras/PI3K/AKT signaling-related biological processes
We analyzed differential gene expression data from TCGA database and identified numerous DEGs associated with alterations in the RTK/Ras/PI3K/AKT signaling, RB, and TP53 pathways. The genes involved in these three oncogenic signaling pathways were described by cBioPortal and are listed in Supplementary Table 1. GO analysis was performed for the identified DEGs using DAVID and showed that alterations in RTK/Ras/PI3K/AKT signaling were involved in the inflammatory and immune responses (Figure 1A). Moreover, there were abundant cytokines and chemokines that were elevated in tumors with activated RTK/Ras/PI3K/AKT signaling (Figure 1B). Notably, the gene expression levels of interferon-stimulated chemokines (CXCL9/10/CXCL11), which recruit activated T and NK cells [13, 14], were significantly increased in tumors with altered RTK/Ras/PI3K/AKT signaling.
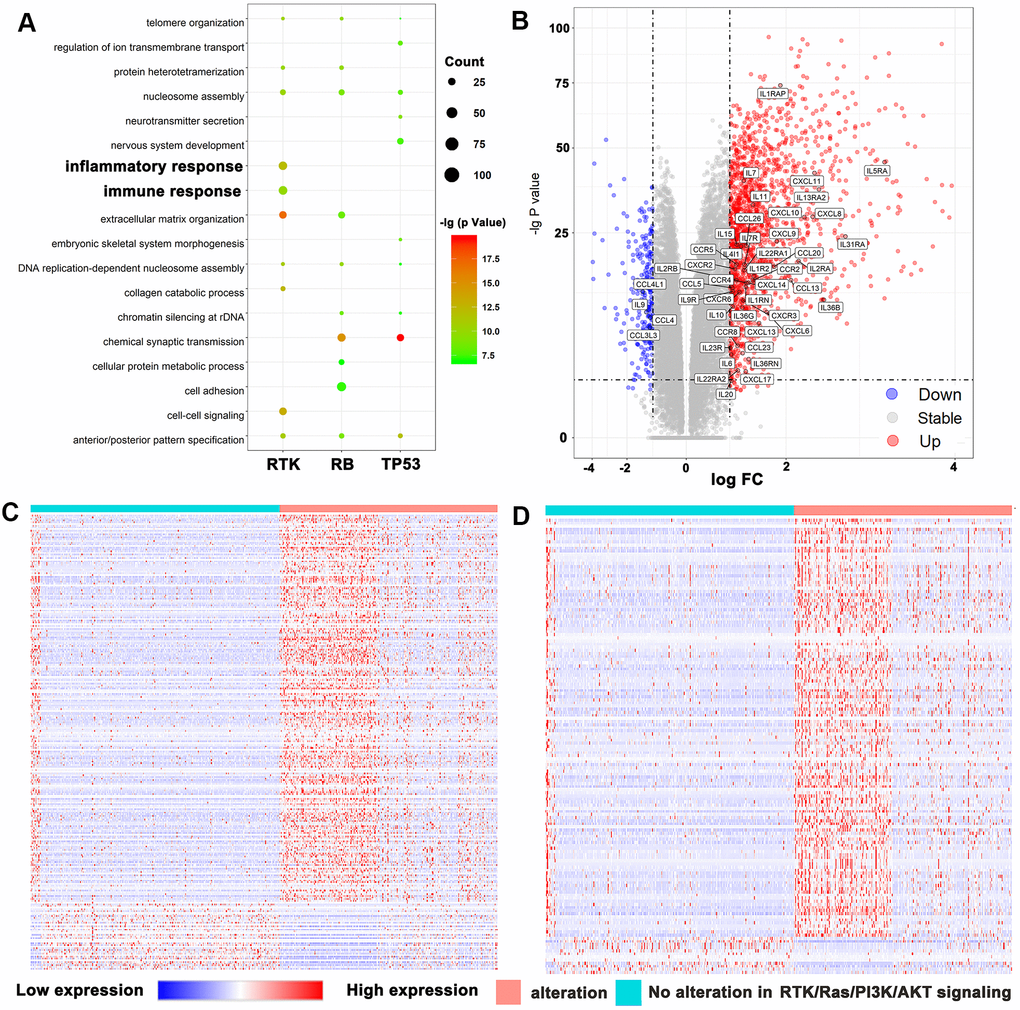
Figure 1. RTK/Ras/PI3K/AKT pathway was strongly related to immune functions in glioma. (A) GO analysis showed that RTK/Ras/PI3K/AKT pathway was involved in immune response and inflammatory response. (B) Volcano plot display differentially expressed cytokines and chemokines according to RTK/Ras/PI3K/AKT signaling. Heat maps display the association between RTK/Ras/PI3K/AKT pathway, and most correlated gene expression in the immune response (C) and inflammatory response (D).
Next, we downloaded the genes that are related to the immune response (GO: 0006955) or the inflammatory response (GO: 0006954) from the AmiGO 2 website (http://amigo.geneontology.org/amigo). We matched the downloaded genes with DEGs according to the status of the RTK/Ras/PI3K/AKT pathway. We identified 228 upregulated and 40 downregulated genes involved in the immune response (Supplementary Table 2) and 135 upregulated and 12 downregulated genes involved in the inflammatory response (Supplementary Table 3). All the DEGs from the two biological process were selected for heatmap analysis (Figure 1C, D).
Relationship between the RTK/Ras/PI3K/AKT signaling status and predictive biomarkers
There were data indicating that lower tumor purity is associated with an intense local immune response [15]. Here, we found that TMB was significantly increased in diffuse gliomas and Lower grade gliomas (LGGs), in which the RKT signaling pathway was activated (p < 0.001, Figure 2A). Tumors with altered RTK also showed elevated levels in gliomas and LGG (p < 0.001, Figure 2B). CYT reflected the immune cytolytic activity in gliomas and was tremendously increased in cancer patients treated with immune checkpoint inhibitors (ICIs) [16, 17]. Our study also showed that CYT was significantly upregulated in tumors with altered RTK/Ras/PI3K/AKT signaling (p < 0.001, Figure 2C). Moreover, we showed that tumors with activated RTK/Ras/PI3K/AKT pathway were enriched with LGG-infiltrating CD8+ T cells (p <0.001, Figure 2D). However, we also found significant differences in immunotherapy biomarkers between LGG and GBM, the reason for which is unclear and requires further analysis. The tumor purity, TMB, CYT, and tumor infiltrating CD8+ T cells were all compared by the Wilcoxon test.
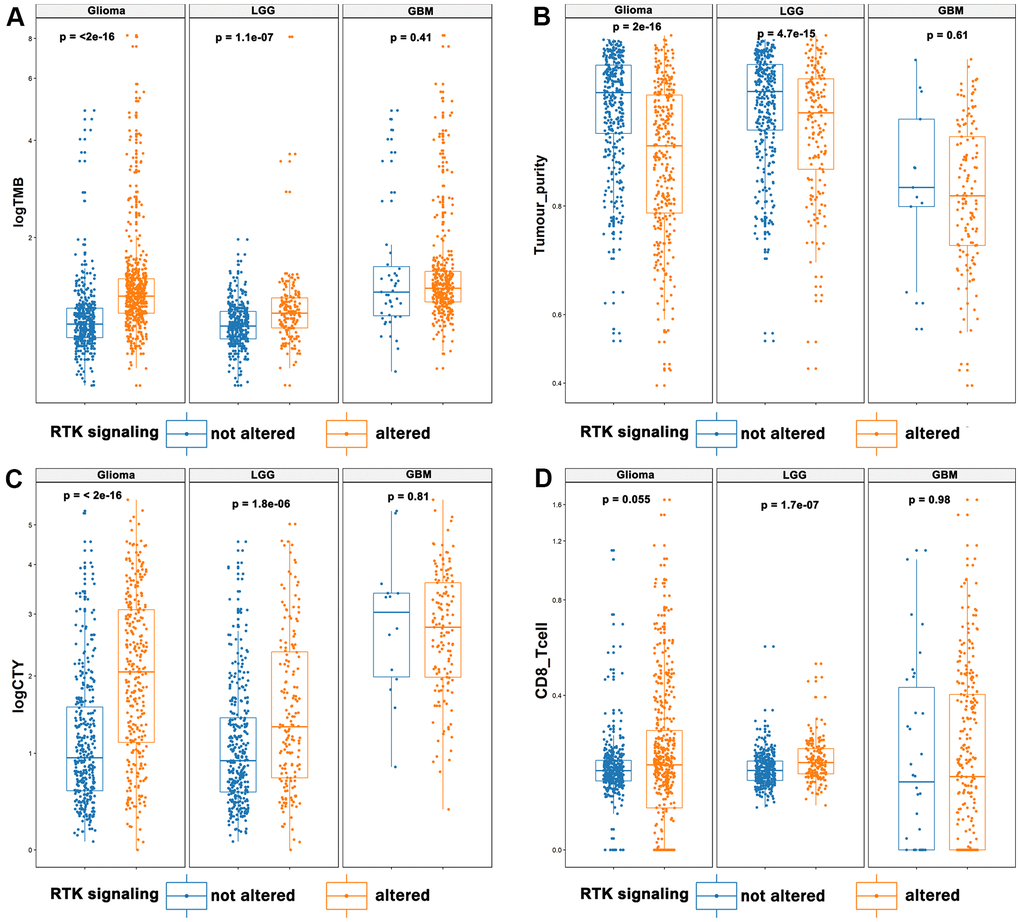
Figure 2. The landscape of immunotherapy predictive biomarkers in association with RTK/Ras/PI3K/AKT pathway. It displayed that elevated TMB (A), CYT (C), and infiltrating CD8+ T cells (D), and decreased tumor purity (B) in the activated RTK/Ras/PI3K/AKT pathway.
Correlations between RTK/Ras/PI3K/AKT signaling and immune-regulatory gene-transcript signatures
Immune checkpoints involved in the PD-1 signaling pathway were found to be strong predictive markers for anti-PD-1 treatment and were significantly upregulated in the altered RTK/Ras/PI3K/AKT pathway subgroup (Student’s t test, Figure 3A). However, the single cell RNA sequencing results showed that CD274 and PDCD1LG2 were not only expressed in malignant cells, but were also heavily expressed in immune cells in gliomas (Supplementary Figure 1A, 1B). So, we analysed the immune checkpoints according to cell type. As GSEA analysis indicated a prominent enrichment of transcript signatures involved in the PI3K-AKT-mTOR and IFN-γ pathways for the TCGA bulk sequencing (Figure 3B), we quantified the signaling pathway of each single cell by ssGSEA [18, 19] using the “INTERFERON_GAMMA_RESPONSE” and “PI3K_AKT_MTOR_SIGNALING” gene sets. There was a significant positive correlation between “PI3K_AKT_MTOR_SIGNALING” and “INTERFERON_GAMMA_RESPONSE” in the malignant cells (Figure 3C). Moreover, malignant cells with detectable CD274 expression showed elevated levels of “PI3K_AKT_MTOR_SIGNALING” (Figure 3D). However, the activity of this pathway was increased in glioma cells with detectable PDCD1LG2 expression in the study by Neftel et al [7] but not in that by Filbin et al [20] (Figure 3E). PD-L2 expression was also increased in gliomas with RTK activation in the study by Filbin et al., but the increase was not significant. It is possible that RTK was activated in fewer cells in the study by Filbin et al. compared to that in the study by Neftel et al. Finally, “PI3K_AKT_MTOR_SIGNALING” was significantly increased in tumor-associated macrophages with detectable PDCD1 but not in T cells (Figure 3F).
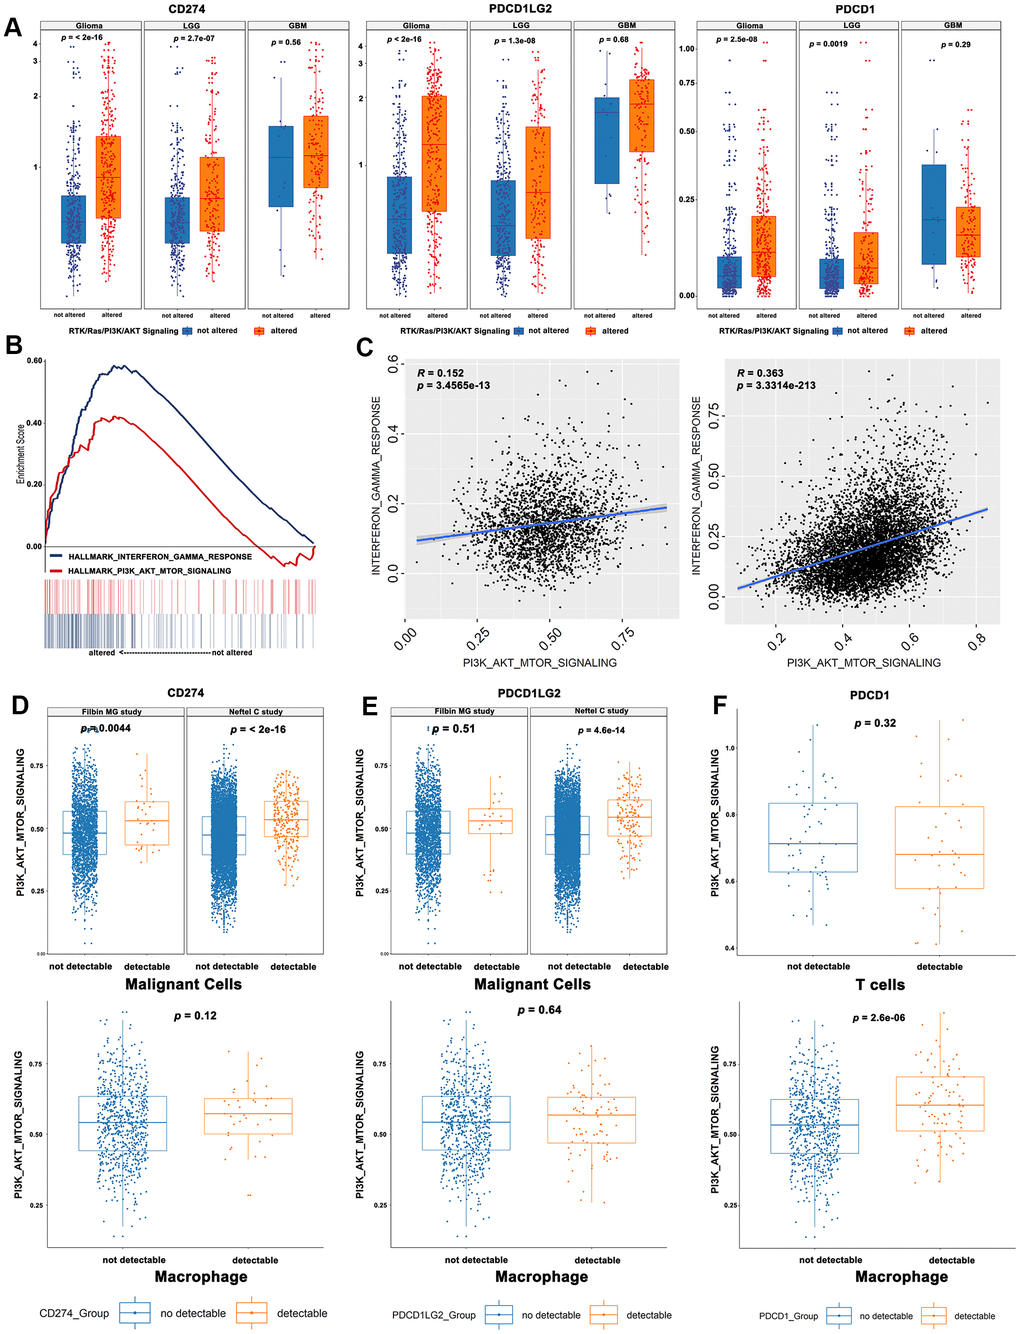
Figure 3. Correlations between RTK/Ras/PI3K/AKT signaling and immune-regulatory genes mRNA signatures. (A) The immune checkpoint genes were significantly upregulated in the activated RTK/Ras/PI3K/AKT signaling. (B) GSEA analysis showed a prominent enrichment of IFNγ pathways and PI3K-AKT-mTOR. (C) The single cell RNA seq showed a significant correlation between PI3K-AKT-mTOR and IFNγ pathway. The glioma cells with detectable CD274 (D) or PDCD1LG2 (E) showed an elevated activity of “PI3K_AKT_MTOR_SIGNALING”. (F) The PI3K_AKT_MTOR_SIGNALING pathway activity was significantly increased in tumor-associated macrophages, instead of T cells.
RTK/Ras/PI3K/AKT signaling predicts the immune phenotype and cell survival in diffuse gliomas
CD274, TMB, and CD8+ T cell infiltration were selected as markers for identifying the immune phenotype [21–23]. The cut-offs of these predictive biomarkers were determined based on survival outcomes. We observed that the activated RTK/Ras/PI3K/AKT signaling pathway predicted a worse OS for diffuse gliomas (Supplementary Figure 2). Next, we investigated the prognostic value of the immune phenotype according to the status of the RTK/Ras/PI3K/AKT signaling pathway. First, we classified the immune phenotypes based on CD274 and TMB, which served as a strong predictor for patients with cancers treated with ICIs [21]. Here, we saw that a higher proportion of high-CD274 and high-TMB samples exhibited alterations in the RTK/Ras/PI3K/AKT signaling group than their counterparts (p < 0.001, Figure 4A). However, we found that the group with both high CD274 and TMB suffered the worst OS compared with other groups, regardless of the RTK/Ras/PI3K/AKT signaling status (p < 0.001, Figure 4B). Furthermore, CD274 and CD8+ T cells were used for classifying TME according to previous reports [22, 23]. There was a lower proportion of the group with lower CD274 and CD8+ T cells in tumors without RTK/Ras/PI3K/AKT signaling alterations (p < 0.001, Figure 4C). The immune phenotype based on the presence of CD274 and CD8+ T cells also showed different survival outcomes based on whether RTK/Ras/PI3K/AKT signaling was altered (p < 0.001, Figure 4D).
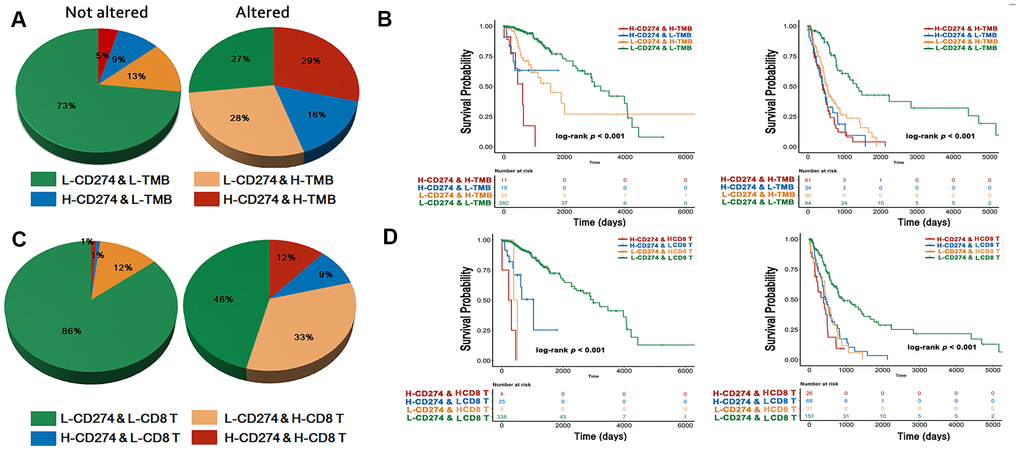
Figure 4. Immune phenotype and survival analysis. The immuno-phenotype showed higher CD274 and TMB (A) in the tumor with altered RTK/Ras/PI3K/AKT signaling with different survival outcome (B). CD274 and CD8+ T cells (C) were significantly higher in activated RTK/Ras/PI3K/AKT pathway, with difference in OS (D).
Associations of RTK/Ras/PI3K/AKT signaling with clinical characteristics
The predictive immunotherapy biomarkers were divided into two groups according to survival outcomes, and the cut-off values are presented in Supplementary Table 4. We observed that RTK/Ras/PI3K/AKT signaling occurred more frequently in the subgroup with lower TMB, CYT, and CD274 expression. However, alterations in this pathway were consistently high regardless of changes in tumor purity, and PDCD1LG2 and PDCD1 expression (Figure 5).
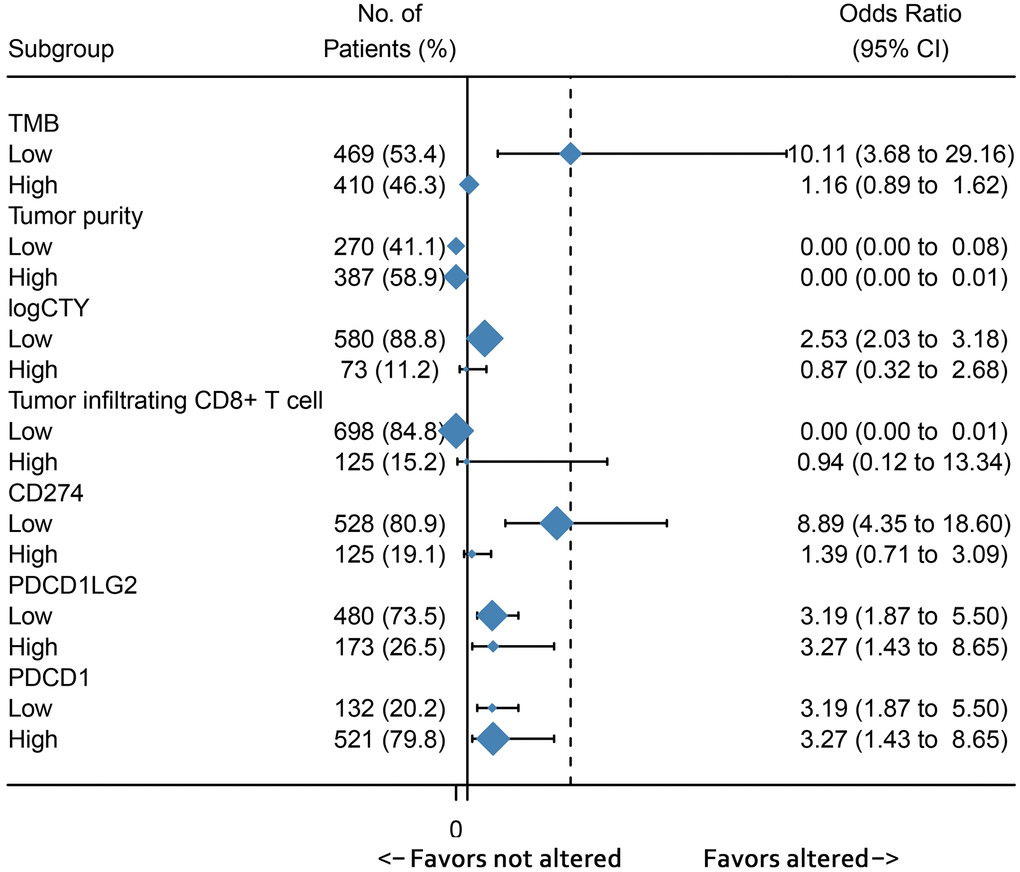
Figure 5. Subgroup analysis showed the association between immunotherapy predictive biomarkers and RTK/Ras/PI3K/AKT pathway.
The association between the RTK/Ras/PI3K/AKT signaling status and the clinicopathological factors of patients is presented in Table 1. Patients with altered RTK/Ras/PI3K/AKT signaling were significantly younger. Moreover, alteration in this pathway was more likely to occur in the neural and proneural TCGA transcript subtype, and in LGG. Additionally, isocitrate dehydrogenase mutations and ATRX chromatin remodeller loss were significantly correlated with activated RTK/Ras/PI3K/AKT signaling (Table 1). Analysis of the prognostic value of the clinicopathological factors by the log-rank test, showed that age, grade, isocitrate dehydrogenase, and RTK/Ras/PI3K/AKT pathways were independent variables for overall survival (Table 2). A nomogram based on these four independent prognostic factors was built, and the C-index for this model was 0.81. The nomogram model effectively predicted the 1-, 3-, and 5-year overall survival rates (Supplementary Figure 3).
Table 1. Association of RTK/Ras/PI3K/AKT signaling and clinicopathological factors.
| Variables | No (%) | RTK/Ras/PI3K/AKT signaling | ||
| not altered | altered | p value | ||
| Age | ||||
| 885 (100%) | 52.66 ± 16.11 | 49.47 ± 15.57 | 0.003 | |
| Gender | ||||
| Female | 363 (41.2%) | 152 | 211 | 0.581 |
| Male | 518 (58.7%) | 227 | 291 | |
| Grade | ||||
| LGG | 507 (57.3%) | 201 | 306 | 0.020 |
| GBM | 378 (42.7%) | 180 | 198 | |
| TCGA subtype | ||||
| Classical | 129 (18.9%) | 64 | 65 | 0.003 |
| Mesenchymal | 145 (21.2%) | 72 | 73 | |
| Neural | 133 (19.4%) | 46 | 87 | |
| Proneural | 277 (40.5%) | 101 | 176 | |
| IDH-1 R132H | ||||
| Mutant | 439 (50.2%) | 157 | 282 | < 0.001 |
| Wild-type | 436 (49.8%) | 218 | 218 | |
| ATRX | ||||
| Loss | 206 (25.8%) | 69 | 137 | 0.005 |
| Expression | 594 (74.3%) | 265 | 329 | |
| MGMT | ||||
| Methylated | 563 (68.2%) | 225 | 338 | 0.059 |
| Unmethylated | 263 (31.8%) | 124 | 139 | |
Table 2. Univariate and multivariate survival analysis.
| Variables | Univariate analysis | Multivariate analysis | |||
| HR (95%CI) | p-val | HR (95%CI) | p-val | ||
| Age > 65 | 2.09 (1.52 ~ 2.86) | < 0.001 | 2.09 (1.52 ~ 2.86) | < 0.001 | |
| Grade (GBM) | 7.45 (5.95 ~ 9.32) | < 0.001 | 2.26 (1.55 ~ 3.29) | < 0.001 | |
| IDH (WILD-TYPE) | 9.32 (7.27 ~ 11.96) | < 0.001 | 3.76 (2.26 ~ 6.25) | < 0.001 | |
| ATRX (WILD-TYPE) | 3.15 (2.34 ~ 4.26) | < 0.001 | 0.98 (0.64 ~ 1.48) | 0.907 | |
| MGMT (Methylated) | 2.96 (2.39 ~ 3.65) | < 0.001 | 1.27 (0.95 ~ 1.70) | 0.113 | |
| TCGA subtype (PN) | 0.58 (0.53 ~ 0.63) | < 0.001 | 0.97 (0.83 ~ 1.12) | 0.633 | |
| RTK/Ras/PI3K/AKT signaling | 4.82 (3.79 ~ 6.13) | < 0.001 | 1.56 (1.08 ~ 2.24) | 0.017 | |
Discussion
Pathway-level activities have proven to be more stable than single-gene activities for stratifying patients into subgroups for predicting survival and guiding special therapeutics [24, 25]. In our study, we defined the activation of a pathway by CNV or genetic mutation and excluded unknown significant genetic alterations. Moreover, we performed a GSEA analysis using transcriptomic data to confirm that the two subgroups showed different PI3K_AKT_MTOR_SIGNALING activities. Next, we showed that tumors with altered RTK/Ras/PI3K/AKT signaling are characterized by favourable predictive immunotherapy biomarkers, including TMB, tumor-infiltrating CD8+ T cells, immune checkpoints, and interferon-γ signaling. These results indicated a selection of patients for a combination of immunotherapy and treatment with PI3K inhibitors.
Three distinct immune patterns have been previously proposed: immune-inflamed, immune-excluded, and immune-desert [26]. Immune-inflamed tumors are characterized by increased TMB, checkpoint expression, interferon-γ signaling, and CD8+ T cell infiltration and are responsive to immunotherapy [26, 27]. Here, we found that gliomas with altered RTK/Ras/PI3K/AKT signaling mainly participate in the immune and inflammatory responses and are classified as immune-inflamed tumors. Moreover, this subgroup of gliomas also exhibited the same patterns as the immune-inflamed tumors in terms of having higher TMB, immune checkpoints, CD8+ T cell infiltration, and interferon-γ signaling. The single-cell RNA seq data revealed a positive association between the activated RTK signaling pathway and PD-1 expression in tumor-associated macrophages, and PD-L1 expression in tumor cells. These results indicate that gliomas with active RTK/Ras/PI3K/AKT signaling are responsive to ICI immunotherapy via the targeting of PD-1/PD-L1 both on tumor cells and tumor-associated macrophages. Interestingly, increased RTK/Ras/PI3K/AKT pathway-related gene expression not only increased CD274 expression in malignant cells, but also increased the expression of PDCD1 in macrophages in our study. PDCD1 was shown to inhibit phagocytosis by tumor-associated macrophages, thus providing anti-tumor immunity [28]. Consequently, inhibitors targeting the RTK/Ras/PI3K/AKT pathway in gliomas may exert benefits by activating tumor-associated macrophages.
Numerous inhibitors targeting the RTK/Ras/PI3K/AKT pathway have been developed and tested in clinical trials, but few have achieved a satisfactory therapeutic effect [29, 30]. Immunotherapy based on ICIs for gliomas has also not significantly improved survival in gliomas [31]. However, our results indicated that a combination of these two therapies could exert a better therapeutic effect. Moreover, experimental results showed that combinatorial therapy with nivolumab and inhibitors of tyrosine kinase effectively prolonged the survival of mice with GBM [32]. As nivolumab showed limited effects in patients with GBMs refractory to bevacizumab therapy [31], we suggest that this combination therapy may be applied to patients with altered RTK/Ras/PI3K/AKT pathway expression, who had predictive biomarkers for both treatments.
Conclusions
The RTK/Ras/PI3K/AKT pathway is frequently altered in gliomas, which has important prognostic and predictive value for immunotherapy. Moreover, our results indicate that a combination of immunotherapy and treatment with RTK/Ras/PI3K/AKT pathway inhibitors may benefit the survival of patients with gliomas. Clinical studies are necessary to validate the analytical accuracy of our study and examine the clinical utility of our findings in the personalized treatment of gliomas.
Materials and Methods
Patients and data
The alterations in oncogenic signaling pathways in diffuse gliomas were identified based on copy number variation (CNV) and somatic mutation through the cBioPortal (http://www.cbioportal.org) [33, 34]. The CNV and mutations in genes of unknown significance and germline mutations were excluded when identifying alterations in pathways. The Cancer Genome Atlas (TCGA) PanCancer Atlas database was used, which consists of 661 cases with both mutation and CNV data. One or more gene alterations in the oncosignaling pathways were identified as an “altered pathway” patient sample. The corresponding transcriptome and whole exome sequencing data were downloaded from the GDC Data Portal of TCGA (https://portal.gdc.cancer.gov/). We used the somatic mutation as determined using TCGA as the mutation count per sample. Thirty-five megabases (Mb) was considered as the total exome size. We counted the TMB as the number of mutations/35 [35]. SingleCellPortal (https://portals.broadinstitute.org/single_cell/) was used to download single cell mRNA-seq data from the Neftel et al. study [7] and the Filbin et al. study [20]. Moreover, tumor-infiltrating immune cells were accessed from the Timer website (https://cistrome.shinyapps.io/timer/) [36]. ESTIMATE was used to calculate tumor purity [37].
Bioinformatic analysis
The package “edgeR” was employed to identify differentially expressed genes with a log fold change > 1 and FDR < 0.05. Gene ontology (GO) was used for the analysis of differentially expressed genes (DEGs) through the DAVID website (http://david.ncifcrf.gov/) [38]. Data were log-transformed before drawing heat maps. Gene set enrichment analysis (GSEA) was used to investigate the potential association between the RTK/Ras/PI3K/AKT pathway status and the immune response in the “hallmark gene sets (h.all.v7.0.symbols)” using Java 4.0 Desktop Application (http://software.broadinstitute.org/gsea/index.jsp) [39]. The threshold for GSEA results was set at NES > 1.5 and FDR < 0.25. GSVA was used to evaluate the pathways in samples with mRNA data using the single-sample gene set enrichment analysis (ssGSEA) method. CYT was calculated by the genomic means of GZMA (granzyme A) and PRF1 (perforin 1) in TPM values [40].
Statistical analysis
The R (3.5.2) language was used as the main tool for analysing data and drawing figures. The discrepancies in TMB, tumor purity, CYT, and tumor-infiltrating CD8+ T cells were compared by the Wilcoxon test using the wilcox.test package. Immune checkpoint expression data were log transformed and compared by Student’s t-test. Correlations between CD274/2 and genes involved in the RTK/Ras/PI3K/AKT pathway were analysed by Spearman correlation and correlogram analysis. The cut-off for continuous variables were determined by survival data using X-tile 3.6.1 [41]. Overall survival (OS) analysis was performed using the log-rank test. A p < 0.05 was considered as statistically significant.
Supplementary Materials
Author Contributions
Conception and design: Chang-xiang Yan; Data Collection and Analysis: Song Han, Pengfei Wang and Hong-qing Cai; Figures and tables: Pengfei Wang and Hong-qing Cai; Manuscript writing: All authors; Final approval of manuscript: All authors.
Conflicts of Interest
The authors declare that they have no conflicts of interest.
Editorial Note
This corresponding author has a verified history of publications using the personal email address for correspondence.
References
- 1. Ostrom QT, Gittleman H, Truitt G, Boscia A, Kruchko C, Barnholtz-Sloan JS. CBTRUS Statistical Report: Primary Brain and Other Central Nervous System Tumors Diagnosed in the United States in 2011-2015. Neuro Oncol. 2018; 20:iv1–v86. https://doi.org/10.1093/neuonc/noy131 [PubMed]
- 2. Brennan CW, Verhaak RG, McKenna A, Campos B, Noushmehr H, Salama SR, Zheng S, Chakravarty D, Sanborn JZ, Berman SH, Beroukhim R, Bernard B, Wu CJ, et al, and TCGA Research Network. The somatic genomic landscape of glioblastoma. Cell. 2013; 155:462–77. https://doi.org/10.1016/j.cell.2013.09.034 [PubMed]
- 3. Dunn GP, Rinne ML, Wykosky J, Genovese G, Quayle SN, Dunn IF, Agarwalla PK, Chheda MG, Campos B, Wang A, Brennan C, Ligon KL, Furnari F, et al. Emerging insights into the molecular and cellular basis of glioblastoma. Genes Dev. 2012; 26:756–84. https://doi.org/10.1101/gad.187922.112 [PubMed]
- 4. Zheng H, Ying H, Yan H, Kimmelman AC, Hiller DJ, Chen AJ, Perry SR, Tonon G, Chu GC, Ding Z, Stommel JM, Dunn KL, Wiedemeyer R, et al. Pten and p53 converge on c-Myc to control differentiation, self-renewal, and transformation of normal and neoplastic stem cells in glioblastoma. Cold Spring Harb Symp Quant Biol. 2008; 73:427–37. https://doi.org/10.1101/sqb.2008.73.047 [PubMed]
- 5. Cancer Genome Atlas Research Network. Comprehensive genomic characterization defines human glioblastoma genes and core pathways. Nature. 2008; 455:1061–68. https://doi.org/10.1038/nature07385 [PubMed]
- 6. Venkatesan S, Lamfers ML, Dirven CM, Leenstra S. Genetic biomarkers of drug response for small-molecule therapeutics targeting the RTK/Ras/PI3K, p53 or Rb pathway in glioblastoma. CNS Oncol. 2016; 5:77–90. https://doi.org/10.2217/cns-2015-0005 [PubMed]
- 7. Neftel C, Laffy J, Filbin MG, Hara T, Shore ME, Rahme GJ, Richman AR, Silverbush D, Shaw ML, Hebert CM, Dewitt J, Gritsch S, Perez EM, et al. An Integrative Model of Cellular States, Plasticity, and Genetics for Glioblastoma. Cell. 2019; 178:835–849.e21. https://doi.org/10.1016/j.cell.2019.06.024 [PubMed]
- 8. Quail DF, Joyce JA. The Microenvironmental Landscape of Brain Tumors. Cancer Cell. 2017; 31:326–41. https://doi.org/10.1016/j.ccell.2017.02.009 [PubMed]
- 9. Chen P, Zhao D, Li J, Liang X, Li J, Chang A, Henry VK, Lan Z, Spring DJ, Rao G, Wang YA, DePinho RA. Symbiotic Macrophage-Glioma Cell Interactions Reveal Synthetic Lethality in PTEN-Null Glioma. Cancer Cell. 2019; 35:868–884.e6. https://doi.org/10.1016/j.ccell.2019.05.003 [PubMed]
- 10. Parsa AT, Waldron JS, Panner A, Crane CA, Parney IF, Barry JJ, Cachola KE, Murray JC, Tihan T, Jensen MC, Mischel PS, Stokoe D, Pieper RO. Loss of tumor suppressor PTEN function increases B7-H1 expression and immunoresistance in glioma. Nat Med. 2007; 13:84–88. https://doi.org/10.1038/nm1517 [PubMed]
- 11. Dong ZY, Zhong WZ, Zhang XC, Su J, Xie Z, Liu SY, Tu HY, Chen HJ, Sun YL, Zhou Q, Yang JJ, Yang XN, Lin JX, et al. Potential Predictive Value of TP53 and KRAS Mutation Status for Response to PD-1 Blockade Immunotherapy in Lung Adenocarcinoma. Clin Cancer Res. 2017; 23:3012–24. https://doi.org/10.1158/1078-0432.CCR-16-2554 [PubMed]
- 12. Kim SS, Harford JB, Moghe M, Slaughter T, Doherty C, Chang EH. A tumor-targeting nanomedicine carrying the p53 gene crosses the blood-brain barrier and enhances anti-PD-1 immunotherapy in mouse models of glioblastoma. Int J Cancer. 2019; 145:2535–46. https://doi.org/10.1002/ijc.32531 [PubMed]
- 13. Mahadevan D, Choi J, Cooke L, Simons B, Riley C, Klinkhammer T, Sud R, Maddipoti S, Hehn S, Garewal H, Spier C. Gene Expression and Serum Cytokine Profiling of Low Stage CLL Identify WNT/PCP, Flt-3L/Flt-3 and CXCL9/CXCR3 as Regulators of Cell Proliferation, Survival and Migration. Hum Genomics Proteomics. 2009; 2009:453634. https://doi.org/10.4061/2009/453634 [PubMed]
- 14. Romagnani P, Annunziato F, Lasagni L, Lazzeri E, Beltrame C, Francalanci M, Uguccioni M, Galli G, Cosmi L, Maurenzig L, Baggiolini M, Maggi E, Romagnani S, Serio M. Cell cycle-dependent expression of CXC chemokine receptor 3 by endothelial cells mediates angiostatic activity. J Clin Invest. 2001; 107:53–63. https://doi.org/10.1172/JCI9775 [PubMed]
- 15. Zhang C, Cheng W, Ren X, Wang Z, Liu X, Li G, Han S, Jiang T, Wu A. Tumor Purity as an Underlying Key Factor in Glioma. Clin Cancer Res. 2017; 23:6279–91. https://doi.org/10.1158/1078-0432.CCR-16-2598 [PubMed]
- 16. Herbst RS, Soria JC, Kowanetz M, Fine GD, Hamid O, Gordon MS, Sosman JA, McDermott DF, Powderly JD, Gettinger SN, Kohrt HE, Horn L, Lawrence DP, et al. Predictive correlates of response to the anti-PD-L1 antibody MPDL3280A in cancer patients. Nature. 2014; 515:563–67. https://doi.org/10.1038/nature14011 [PubMed]
- 17. Wang ZL, Wang Z, Li GZ, Wang QW, Bao ZS, Zhang CB, Jiang T. Immune Cytolytic Activity Is Associated With Genetic and Clinical Properties of Glioma. Front Immunol. 2019; 10:1756. https://doi.org/10.3389/fimmu.2019.01756 [PubMed]
- 18. Benci JL, Xu B, Qiu Y, Wu TJ, Dada H, Twyman-Saint Victor C, Cucolo L, Lee DS, Pauken KE, Huang AC, Gangadhar TC, Amaravadi RK, Schuchter LM, et al. Tumor Interferon Signaling Regulates a Multigenic Resistance Program to Immune Checkpoint Blockade. Cell. 2016; 167:1540–1554.e12. https://doi.org/10.1016/j.cell.2016.11.022 [PubMed]
- 19. Zhang L, Zhao Y, Dai Y, Cheng JN, Gong Z, Feng Y, Sun C, Jia Q, Zhu B. Immune Landscape of Colorectal Cancer Tumor Microenvironment from Different Primary Tumor Location. Front Immunol. 2018; 9:1578. https://doi.org/10.3389/fimmu.2018.01578 [PubMed]
- 20. Filbin MG, Tirosh I, Hovestadt V, Shaw ML, Escalante LE, Mathewson ND, Neftel C, Frank N, Pelton K, Hebert CM, Haberler C, Yizhak K, Gojo J, et al. Developmental and oncogenic programs in H3K27M gliomas dissected by single-cell RNA-seq. Science. 2018; 360:331–35. https://doi.org/10.1126/science.aao4750 [PubMed]
- 21. Rizvi H, Sanchez-Vega F, La K, Chatila W, Jonsson P, Halpenny D, Plodkowski A, Long N, Sauter JL, Rekhtman N, Hollmann T, Schalper KA, Gainor JF, et al. Molecular Determinants of Response to Anti-Programmed Cell Death (PD)-1 and Anti-Programmed Death-Ligand 1 (PD-L1) Blockade in Patients With Non-Small-Cell Lung Cancer Profiled With Targeted Next-Generation Sequencing. J Clin Oncol. 2018; 36:633–41. https://doi.org/10.1200/JCO.2017.75.3384 [PubMed]
- 22. Teng MW, Ngiow SF, Ribas A, Smyth MJ. Classifying Cancers Based on T-cell Infiltration and PD-L1. Cancer Res. 2015; 75:2139–45. https://doi.org/10.1158/0008-5472.CAN-15-0255 [PubMed]
- 23. Ock CY, Keam B, Kim S, Lee JS, Kim M, Kim TM, Jeon YK, Kim DW, Chung DH, Heo DS. Pan-Cancer Immunogenomic Perspective on the Tumor Microenvironment Based on PD-L1 and CD8 T-Cell Infiltration. Clin Cancer Res. 2016; 22:2261–70. https://doi.org/10.1158/1078-0432.CCR-15-2834 [PubMed]
- 24. Vaske CJ, Benz SC, Sanborn JZ, Earl D, Szeto C, Zhu J, Haussler D, Stuart JM. Inference of patient-specific pathway activities from multi-dimensional cancer genomics data using PARADIGM. Bioinformatics. 2010; 26:i237–45. https://doi.org/10.1093/bioinformatics/btq182 [PubMed]
- 25. Fa B, Luo C, Tang Z, Yan Y, Zhang Y, Yu Z. Pathway-based biomarker identification with crosstalk analysis for robust prognosis prediction in hepatocellular carcinoma. EBioMedicine. 2019; 44:250–60. https://doi.org/10.1016/j.ebiom.2019.05.010 [PubMed]
- 26. Hegde PS, Karanikas V, Evers S. The Where, the When, and the How of Immune Monitoring for Cancer Immunotherapies in the Era of Checkpoint Inhibition. Clin Cancer Res. 2016; 22:1865–74. https://doi.org/10.1158/1078-0432.CCR-15-1507 [PubMed]
- 27. Sun R, Limkin EJ, Vakalopoulou M, Dercle L, Champiat S, Han SR, Verlingue L, Brandao D, Lancia A, Ammari S, Hollebecque A, Scoazec JY, Marabelle A, et al. A radiomics approach to assess tumour-infiltrating CD8 cells and response to anti-PD-1 or anti-PD-L1 immunotherapy: an imaging biomarker, retrospective multicohort study. Lancet Oncol. 2018; 19:1180–91. https://doi.org/10.1016/S1470-2045(18)30413-3 [PubMed]
- 28. Gordon SR, Maute RL, Dulken BW, Hutter G, George BM, McCracken MN, Gupta R, Tsai JM, Sinha R, Corey D, Ring AM, Connolly AJ, Weissman IL. PD-1 expression by tumour-associated macrophages inhibits phagocytosis and tumour immunity. Nature. 2017; 545:495–99. https://doi.org/10.1038/nature22396 [PubMed]
- 29. Li X, Wu C, Chen N, Gu H, Yen A, Cao L, Wang E, Wang L. PI3K/Akt/mTOR signaling pathway and targeted therapy for glioblastoma. Oncotarget. 2016; 7:33440–50. https://doi.org/10.18632/oncotarget.7961 [PubMed]
- 30. Chinot OL, Wick W, Mason W, Henriksson R, Saran F, Nishikawa R, Carpentier AF, Hoang-Xuan K, Kavan P, Cernea D, Brandes AA, Hilton M, Abrey L, Cloughesy T. Bevacizumab plus radiotherapy-temozolomide for newly diagnosed glioblastoma. N Engl J Med. 2014; 370:709–22. https://doi.org/10.1056/NEJMoa1308345 [PubMed]
- 31. Chamberlain MC, Kim BT. Nivolumab for patients with recurrent glioblastoma progressing on bevacizumab: a retrospective case series. J Neurooncol. 2017; 133:561–69. https://doi.org/10.1007/s11060-017-2466-0 [PubMed]
- 32. Sadahiro H, Kang KD, Gibson JT, Minata M, Yu H, Shi J, Chhipa R, Chen Z, Lu S, Simoni Y, Furuta T, Sabit H, Zhang S, et al. Activation of the Receptor Tyrosine Kinase AXL Regulates the Immune Microenvironment in Glioblastoma. Cancer Res. 2018; 78:3002–13. https://doi.org/10.1158/0008-5472.CAN-17-2433 [PubMed]
- 33. Gao J, Aksoy BA, Dogrusoz U, Dresdner G, Gross B, Sumer SO, Sun Y, Jacobsen A, Sinha R, Larsson E, Cerami E, Sander C, Schultz N. Integrative analysis of complex cancer genomics and clinical profiles using the cBioPortal. Sci Signal. 2013; 6:pl1. https://doi.org/10.1126/scisignal.2004088 [PubMed]
- 34. Cerami E, Gao J, Dogrusoz U, Gross BE, Sumer SO, Aksoy BA, Jacobsen A, Byrne CJ, Heuer ML, Larsson E, Antipin Y, Reva B, Goldberg AP, et al. The cBio cancer genomics portal: an open platform for exploring multidimensional cancer genomics data. Cancer Discov. 2012; 2:401–04. https://doi.org/10.1158/2159-8290.CD-12-0095 [PubMed]
- 35. Chalmers ZR, Connelly CF, Fabrizio D, Gay L, Ali SM, Ennis R, Schrock A, Campbell B, Shlien A, Chmielecki J, Huang F, He Y, Sun J, et al. Analysis of 100,000 human cancer genomes reveals the landscape of tumor mutational burden. Genome Med. 2017; 9:34. https://doi.org/10.1186/s13073-017-0424-2 [PubMed]
- 36. Li T, Fan J, Wang B, Traugh N, Chen Q, Liu JS, Li B, Liu XS. TIMER: A Web Server for Comprehensive Analysis of Tumor-Infiltrating Immune Cells. Cancer Res. 2017; 77:e108–10. https://doi.org/10.1158/0008-5472.CAN-17-0307 [PubMed]
- 37. Yoshihara K, Shahmoradgoli M, Martínez E, Vegesna R, Kim H, Torres-Garcia W, Treviño V, Shen H, Laird PW, Levine DA, Carter SL, Getz G, Stemke-Hale K, et al. Inferring tumour purity and stromal and immune cell admixture from expression data. Nat Commun. 2013; 4:2612. https://doi.org/10.1038/ncomms3612 [PubMed]
- 38. Huang da W, Sherman BT, Lempicki RA. Systematic and integrative analysis of large gene lists using DAVID bioinformatics resources. Nat Protoc. 2009; 4:44–57. https://doi.org/10.1038/nprot.2008.211 [PubMed]
- 39. Subramanian A, Tamayo P, Mootha VK, Mukherjee S, Ebert BL, Gillette MA, Paulovich A, Pomeroy SL, Golub TR, Lander ES, Mesirov JP. Gene set enrichment analysis: a knowledge-based approach for interpreting genome-wide expression profiles. Proc Natl Acad Sci USA. 2005; 102:15545–50. https://doi.org/10.1073/pnas.0506580102 [PubMed]
- 40. Tian T, Wan J, Han Y, Liu H, Gao F, Pan Y, Song Q, Wei Z. A Comprehensive Survey of Immune Cytolytic Activity-Associated Gene Co-Expression Networks across 17 Tumor and Normal Tissue Types. Cancers (Basel). 2018; 10:307. https://doi.org/10.3390/cancers10090307 [PubMed]
- 41. Camp RL, Dolled-Filhart M, Rimm DL. X-tile: a new bio-informatics tool for biomarker assessment and outcome-based cut-point optimization. Clin Cancer Res. 2004; 10:7252–59. https://doi.org/10.1158/1078-0432.CCR-04-0713 [PubMed]