


Introduction
Almost all systemic blood vessels are surrounded by perivascular fat, whose density changes as a surrogate marker of localized inflammation [1].
Perivascular fat encases the carotid artery without an intervening fascial barrier. Limited work has attempted to identify the significance of pericarotid fat. A previous study showed that the fat density around symptomatic internal carotid artery (ICA) stenosis is increased in patients with ischemic events secondary to carotid disease [2]. In addition, a recent study showed that the presence and density of pericarotid fat could be used as an indirect marker of carotid plaque instability [3].
Cerebral small vessel disease (CSVD) is common in the population, especially among elderly individuals [4–6]. Magnetic resonance imaging (MRI) can identify many features of CSVD, including lacunes, white matter hyperintensities (WMHs), and dilated perivascular spaces (PVSs) [4, 7].
The relationship between perivascular fat and adjacent tissues and organs is complex and likely bidirectional. For instance, epicardial adipose tissue is associated with metabolic disorders, arterial wall inflammation and subsequent atherogenesis [7, 8]. In addition, the association with pericardial fat may depend on the particular location of fat relative to the pericardium, and fat distribution surrounding the aorta may also be important [9]. Pathological changes surrounding vessels seem to be associated with nearby parenchymal alterations.
Whether pericarotid fat is correlated with CSVD has not been investigated. The aim of the current study was to investigate the distribution pattern of pericarotid fat and its association with the imaging markers of CSVD.
Results
Baseline characteristics
In total, 572 subjects were included. As shown in Table 1, the average age of the patients was 66 (59, 74) years, and 65.2% of the patients were males. The overall mean HU of the pericarotid fat was -77.32±13.03, and the overall maximum HU was -62.48±14.55. Pericarotid fat was weakly correlated with age (mean HU R=0.116 P=0.006 and maximum HU R=0.100 P=0.017). In addition, the patients with hypertension had a significantly higher mean pericarotid fat density (-76.72±13.13 vs. -79.34±12.55, P=0.008, Supplementary Table 1), and the patients with hyperlipidemia had a significantly higher mean pericarotid fat density (-76.40±12.50 vs. -78.75±13.71, P=0.040, Supplementary Table 1).
Table 1. Baseline characteristics of the participants.
| Characteristics | All (n=572) | Without AIS (n=195) | With AIS (n=377) | P | |||||||||||||||||||||||||||||||||||||||||||||||||||||||||||||||||||||||||||||||||||||||||||||||
| Age, years | 66 (59, 74) | 64 (58, 70) | 68 (60, 76) | <0.001 | |||||||||||||||||||||||||||||||||||||||||||||||||||||||||||||||||||||||||||||||||||||||||||||||
| Male, n (%) | 373 (65.2%) | 131 (67.2%) | 242 (64.2%) | 0.555 | |||||||||||||||||||||||||||||||||||||||||||||||||||||||||||||||||||||||||||||||||||||||||||||||
| Hypertension | 440 (76.9%) | 141 (72.3%) | 299 (79.3%) | 0.041 | |||||||||||||||||||||||||||||||||||||||||||||||||||||||||||||||||||||||||||||||||||||||||||||||
| Diabetes mellitus | 225 (39.3%) | 70 (35.9%) | 155 (41.1%) | 0.201 | |||||||||||||||||||||||||||||||||||||||||||||||||||||||||||||||||||||||||||||||||||||||||||||||
| Hyperlipidemia | 348 (60.8%) | 115 (58.7%) | 233 (61.8%) | 0.444 | |||||||||||||||||||||||||||||||||||||||||||||||||||||||||||||||||||||||||||||||||||||||||||||||
| Coronary heart disease | 152 (26.6%) | 53 (27.2%) | 99 (26.3%) | 0.855 | |||||||||||||||||||||||||||||||||||||||||||||||||||||||||||||||||||||||||||||||||||||||||||||||
| Atrial fibrillation | 145 (25.3%) | 41 (21.0%) | 114 (30.2%) | 0.018 | |||||||||||||||||||||||||||||||||||||||||||||||||||||||||||||||||||||||||||||||||||||||||||||||
| Current smoking | 186 (32.5%) | 48 (24.6%) | 138 (36.6%) | 0.003 | |||||||||||||||||||||||||||||||||||||||||||||||||||||||||||||||||||||||||||||||||||||||||||||||
| Drinking | 98 (17.1%) | 36 (18.5%) | 62 (16.5%) | 0.572 | |||||||||||||||||||||||||||||||||||||||||||||||||||||||||||||||||||||||||||||||||||||||||||||||
| Medication | |||||||||||||||||||||||||||||||||||||||||||||||||||||||||||||||||||||||||||||||||||||||||||||||||||
| Antihypertensive therapy | 285 (49.8%) | 88 (45.1%) | 197 (52.3%) | 0.089 | |||||||||||||||||||||||||||||||||||||||||||||||||||||||||||||||||||||||||||||||||||||||||||||||
| Antidiabetic therapy | 149 (26.0%) | 47 (24.1%) | 102 (27.1%) | 0.497 | |||||||||||||||||||||||||||||||||||||||||||||||||||||||||||||||||||||||||||||||||||||||||||||||
| Statins | 125 (21.9%) | 40 (20.5%) | 85 (22.5%) | 0.546 | |||||||||||||||||||||||||||||||||||||||||||||||||||||||||||||||||||||||||||||||||||||||||||||||
| Antithrombotic therapy | 145 (25.3%) | 38 (19.5%) | 107 (28.4%) | 0.018 | |||||||||||||||||||||||||||||||||||||||||||||||||||||||||||||||||||||||||||||||||||||||||||||||
| Mean HU of pericarotid fat | -77.32±13.03 | -79.64±12.83 | -76.11±12.99 | 0.002 | |||||||||||||||||||||||||||||||||||||||||||||||||||||||||||||||||||||||||||||||||||||||||||||||
| Maximum HU of pericarotid fat | -62.48±14.55 | -64.60±14.98 | -61.38±14.22 | 0.013 | |||||||||||||||||||||||||||||||||||||||||||||||||||||||||||||||||||||||||||||||||||||||||||||||
| The values are presented as the mean ± SD or median (interquartile range) for continuous variables and as a number (percentages) for categorical variables. | |||||||||||||||||||||||||||||||||||||||||||||||||||||||||||||||||||||||||||||||||||||||||||||||||||
| Abbreviations: AIS, Acute ischemic stroke; HU, Hounsfield Units. | |||||||||||||||||||||||||||||||||||||||||||||||||||||||||||||||||||||||||||||||||||||||||||||||||||
Pericarotid fat and MRI markers of CSVD
An increased pericarotid fat density was associated with the presence of lacunes (mean HU P=0.005 and maximum HU P=0.023, Tables 2, 3 and Figure 1A, 1B) and a higher WMH grade (both mean and maximum HU P<0.001, Tables 2, 3 and Figure 1C, 1D), and both remained significantly different after adjusting for the other clinical parameters, except for the maximum HU in WMHs (Grade 1). Although there was a difference in the maximum HU across different grades of PVSs, the difference disappeared after adjusting for the other clinical parameters (Table 3). There was no significant difference in the mean HU across the different grades of PVSs (Table 2).
Table 2. Association between the mean HU of perivascular fat density and neuroimaging markers of CSVD.
| Characteristics | N | Mean HU | |||||||||||||||||||||||||||||||||||||||||||||||||||||||||||||||||||||||||||||||||||||||||||||||||
| Value | P | AOR (95% CI) | P | ||||||||||||||||||||||||||||||||||||||||||||||||||||||||||||||||||||||||||||||||||||||||||||||||
| Lacunes | - | 363 | -78.35 (-89.13, -69.08)* | 0.005 | |||||||||||||||||||||||||||||||||||||||||||||||||||||||||||||||||||||||||||||||||||||||||||||||
| + | 209 | -74.39 (-86.33, -65.07)* | 1.218 (1.038, 1.430) | 0.016 | |||||||||||||||||||||||||||||||||||||||||||||||||||||||||||||||||||||||||||||||||||||||||||||||
| WMHs | Grade 0 | 143 | -82.36 (-91.33, -71.25)*# | <0.001 | |||||||||||||||||||||||||||||||||||||||||||||||||||||||||||||||||||||||||||||||||||||||||||||||
| Grade 1 | 236 | -78.02 (-89.13, -67.58)*@ | 1.366 (1.083, 1.725) | 0.009 | |||||||||||||||||||||||||||||||||||||||||||||||||||||||||||||||||||||||||||||||||||||||||||||||
| Grade 2-3 | 193 | -72.79 (-82.18, -63.45)#@ | 1.396 (1.146, 1.702) | 0.001 | |||||||||||||||||||||||||||||||||||||||||||||||||||||||||||||||||||||||||||||||||||||||||||||||
| PVS | Grade 0 | 141 | -78.83±12.35 | 0.067 | |||||||||||||||||||||||||||||||||||||||||||||||||||||||||||||||||||||||||||||||||||||||||||||||
| Grade 1 | 323 | -77.50±13.16 | 1.066 (0.870, 1.307) | 0.538 | |||||||||||||||||||||||||||||||||||||||||||||||||||||||||||||||||||||||||||||||||||||||||||||||
| Grade 2-4 | 108 | -74.79±13.24 | 1.189 (0.957, 1.476) | 0.118 | |||||||||||||||||||||||||||||||||||||||||||||||||||||||||||||||||||||||||||||||||||||||||||||||
| The results are adjusted for age, sex, hypertension, diabetes, dyslipidaemia, atrial fibrillation, coronary artery disease, smoking, and drinking. Quantitative data were divided into several layers by per standard deviation increase. | |||||||||||||||||||||||||||||||||||||||||||||||||||||||||||||||||||||||||||||||||||||||||||||||||||
| For WMHs, *Grade 0 vs Grade 1, <0.05; #Grade 0 vs Grade 2-3, <0.01; @Grade 1 vs Grade 2-3, <0.01. | |||||||||||||||||||||||||||||||||||||||||||||||||||||||||||||||||||||||||||||||||||||||||||||||||||
| Abbreviations: CSVD, cerebral small vessel disease; PVS, perivascular spaces; WMHs, white matter hyperintensities; HU, Hounsfield Units; AOR, adjusted odds ratio; CI, confidence interval. | |||||||||||||||||||||||||||||||||||||||||||||||||||||||||||||||||||||||||||||||||||||||||||||||||||
Table 3. Association between the maximum HU of perivascular fat density and neuroimaging markers of CSVD.
| Characteristics | N | Maximum HU | |||||||||||||||||||||||||||||||||||||||||||||||||||||||||||||||||||||||||||||||||||||||||||||||||
| Value | P | AOR (95% CI) | P | ||||||||||||||||||||||||||||||||||||||||||||||||||||||||||||||||||||||||||||||||||||||||||||||||
| Lacunes | - | 363 | -63.53±14.73# | 0.023 | |||||||||||||||||||||||||||||||||||||||||||||||||||||||||||||||||||||||||||||||||||||||||||||||
| + | 209 | -60.66±14.10# | 1.173 (1.020, 1.386) | 0.047 | |||||||||||||||||||||||||||||||||||||||||||||||||||||||||||||||||||||||||||||||||||||||||||||||
| WMHs | Grade 0 | 143 | -66.44±13.72* | <0.001 | |||||||||||||||||||||||||||||||||||||||||||||||||||||||||||||||||||||||||||||||||||||||||||||||
| Grade 1 | 236 | -63.43±15.10# | 1.126 (0.902, 1.405) | 0.294 | |||||||||||||||||||||||||||||||||||||||||||||||||||||||||||||||||||||||||||||||||||||||||||||||
| Grade 2-3 | 193 | -58.38±13.47*# | 1.356 (1.118, 1.645) | 0.002 | |||||||||||||||||||||||||||||||||||||||||||||||||||||||||||||||||||||||||||||||||||||||||||||||
| PVS | Grade 0 | 141 | -64.10±13.54* | 0.025 | |||||||||||||||||||||||||||||||||||||||||||||||||||||||||||||||||||||||||||||||||||||||||||||||
| Grade 1 | 323 | -62.86±14.85 | 1.033 (0.845, 1.263) | 0.753 | |||||||||||||||||||||||||||||||||||||||||||||||||||||||||||||||||||||||||||||||||||||||||||||||
| Grade 2-4 | 108 | -59.22±14.55* | 1.257 (1.012, 1.561) | 0.083 | |||||||||||||||||||||||||||||||||||||||||||||||||||||||||||||||||||||||||||||||||||||||||||||||
| The results are adjusted for age, sex, hypertension, diabetes, dyslipidaemia, atrial fibrillation, coronary artery disease, smoking, drinking, and drugs. Quantitative data were divided into several layers by per standard deviation increase. | |||||||||||||||||||||||||||||||||||||||||||||||||||||||||||||||||||||||||||||||||||||||||||||||||||
| For Lacunes, - vs +, #<0.01. | |||||||||||||||||||||||||||||||||||||||||||||||||||||||||||||||||||||||||||||||||||||||||||||||||||
| For WMHs, *Grade 0 vs Grade 2-3, <0.05; #Grade 1 vs Grade 2-3, <0.01. | |||||||||||||||||||||||||||||||||||||||||||||||||||||||||||||||||||||||||||||||||||||||||||||||||||
| For PVS, *Grade 0 vs Grade 2-4, <0.05. | |||||||||||||||||||||||||||||||||||||||||||||||||||||||||||||||||||||||||||||||||||||||||||||||||||
| Abbreviations: CSVD, cerebral small vessel disease; PVS, perivascular spaces; WMHs, white matter hyperintensities; HU, Hounsfield Units; AOR, adjusted odds ratio; CI, confidence interval. | |||||||||||||||||||||||||||||||||||||||||||||||||||||||||||||||||||||||||||||||||||||||||||||||||||
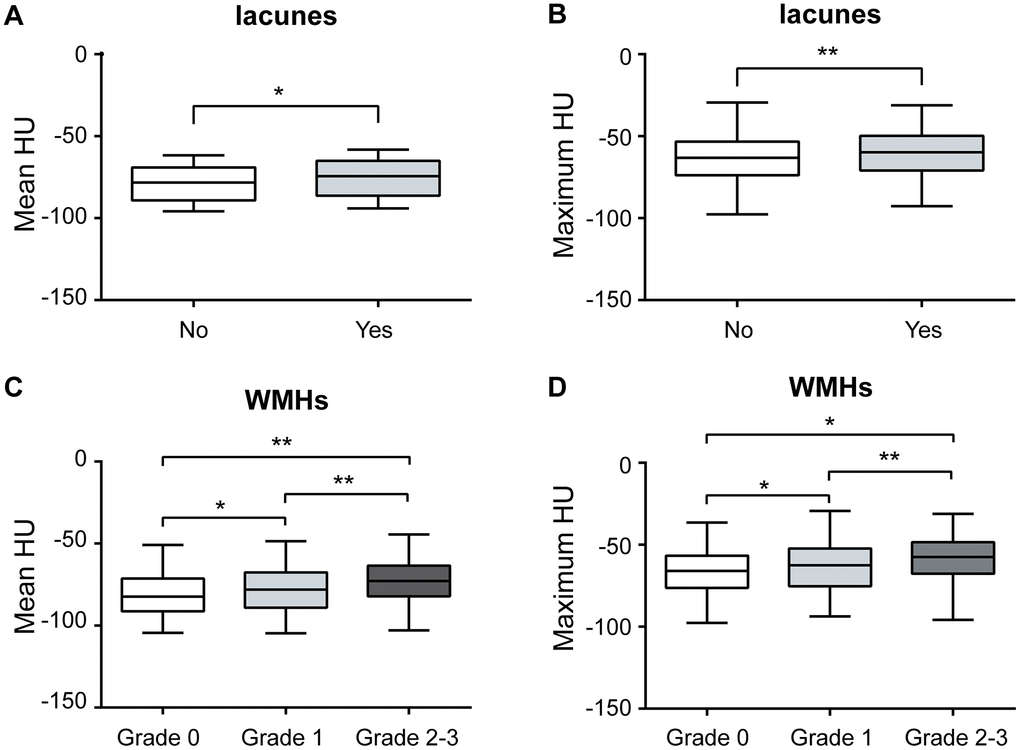
Figure 1. Association between pericarotid fat and MRI markers of CSVD. Pericarotid fat density was associated with the presence of lacunes, (A) for mean HU, and (B) for maximum HU. Pericarotid fat density was associated with the different grades of WMHs, (C) for mean HU, and (D) for maximum HU. In the box-and-whisker plots, the lower and upper ends of the box represent the 25th and 75th percentiles, and the peripheral lines extending to the outer fences represent the 10th and 90th percentiles, respectively. *<0.05; **<0.01. Abbreviation, WMHs, white matter hyperintensities, HU, hounsfield unit.
There were 377 (65.9%) patients with acute ischemic stroke (AIS). The patients with AIS had a significantly higher pericarotid fat density than those without AIS (mean HU P=0.002 and maximum HU P=0.013, Table 1). The difference in the mean HU remained after adjusting for the different clinical parameters between the groups, while the difference in the maximum HU disappeared (mean HU AOR (95% CI), 1.179 (1.003-1.387), P=0.040 and maximum HU P=0.097).
In the sensitivity analysis of the 192 patients without stroke, there was a significantly higher pericarotid fat density in the lacune group and the higher WMH grade group (Table 4). In 377 patients with stroke, the pericarotid fat density was higher in the high WMH grades, while there was no significant difference by lacunes and PVSs (Table 4).
Table 4. Association between the perivascular fat density and neuroimaging markers of CSVD in patients with or without stroke.
| Characteristics | Without AIS | With AIS | |||||||||||||||||||||||||||||||||||||||||||||||||||||||||||||||||||||||||||||||||||||||||||||||||
| Mean HU | Maximum HU | Mean HU | Maximum HU | ||||||||||||||||||||||||||||||||||||||||||||||||||||||||||||||||||||||||||||||||||||||||||||||||
| Lacunes | - | -81.50±12.22# | -66.44±14.68# | -76.70±13.15 | -61.77±14.51 | ||||||||||||||||||||||||||||||||||||||||||||||||||||||||||||||||||||||||||||||||||||||||||||||
| + | -75.31±13.29# | -75.31±14.91# | -75.23±12.73 | -60.79±13.81 | |||||||||||||||||||||||||||||||||||||||||||||||||||||||||||||||||||||||||||||||||||||||||||||||
| WMHs | Grade 0 | -83.19±12.05# | -69.14±13.55# | -80.81±11.69*# | -65.16±13.68* | ||||||||||||||||||||||||||||||||||||||||||||||||||||||||||||||||||||||||||||||||||||||||||||||
| Grade 1 | -80.62±12.69* | -65.36±15.34* | -76.04±13.27* | -62.00±14.83 | |||||||||||||||||||||||||||||||||||||||||||||||||||||||||||||||||||||||||||||||||||||||||||||||
| Grade 2-3 | -74.29±12.42#* | -58.79±13.92#* | -73.02±12.69# | -58.24±13.37* | |||||||||||||||||||||||||||||||||||||||||||||||||||||||||||||||||||||||||||||||||||||||||||||||
| PVS | Grade 0 | -80.63±12.00 | -66.32±13.37 | -77.65±12.50 | -62.64±13.54 | ||||||||||||||||||||||||||||||||||||||||||||||||||||||||||||||||||||||||||||||||||||||||||||||
| Grade 1 | -80.55±13.18 | -65.63±15.59 | -76.08±12.95 | -61.57±14.35 | |||||||||||||||||||||||||||||||||||||||||||||||||||||||||||||||||||||||||||||||||||||||||||||||
| Grade 2-4 | -75.58±12.62 | -59.14±14.69 | -74.38±13.63 | -59.27±14.59 | |||||||||||||||||||||||||||||||||||||||||||||||||||||||||||||||||||||||||||||||||||||||||||||||
| For Lacunes, #<0.01. For WMHs, *<0.05; #<0.01. | |||||||||||||||||||||||||||||||||||||||||||||||||||||||||||||||||||||||||||||||||||||||||||||||||||
| Abbreviations: AIS, Acute ischemic stroke; CSVD, cerebral small vessel disease; PVS, perivascular spaces; WMHs, white matter hyperintensities; HU, Hounsfield Units. | |||||||||||||||||||||||||||||||||||||||||||||||||||||||||||||||||||||||||||||||||||||||||||||||||||
Pericarotid fat density in patients with extracranial ICA stenosis
Forty-three subjects had extracranial ICA stenosis, and we recorded the value at the maximum stenosis slice. The pericarotid fat in the slice with maximum stenosis had a higher density than that near the origin of the ICA (mean HU -67.33±12.34 vs. -72.62±12.58, P=0.008 and maximum HU -52.39±11.48 vs. -56.89±13.05, P=0.008). In addition, the mean HU and maximum HU in these two places were strongly correlated (R=0.680, P<0.001 and R=0.626, P<0.001, Figure 2).
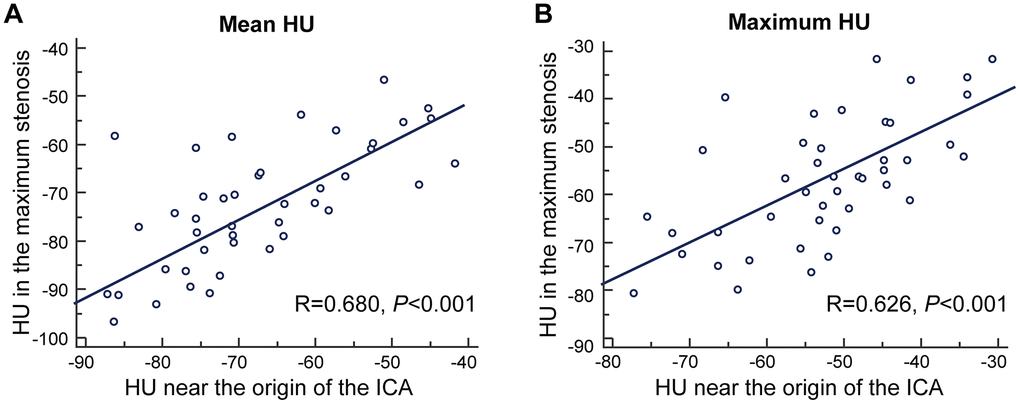
Figure 2. The correlation between density of pericarotid fat in the maximum stenosis slice and near the origin of the ICA. (A) for mean HU. (B) for maximum HU. Abbreviation, HU, hounsfield unit, ICA, internal carotid artery.
Because the number of patients with extracranial ICA stenosis was small, we could not perform a separate analysis of the association between the perivascular fat density and MRI markers of CSVD limited to these patients.
Discussion
This study provides an objective assessment of the association between the pericarotid fat density and imaging markers of CSVD. An increased pericarotid fat density was associated with the presence of lacunes and a higher WMH grade in all subjects. There was no significant difference in the pericarotid fat density across different grades of PVSs. The patients with AIS had a significantly higher pericarotid fat density. The pericarotid fat density in the maximum stenosis slice was higher than that near the origin of the ICA in patients with extracranial ICA stenosis.
Although some previous studies have suggested that visceral fat accumulation is related to the presence of various markers of CSVD, including WMHs and lacunes [10–12], it is more likely to be mediated by adiposity-related risk factors, such as hypertension, diabetes or dyslipidemia. It is generally known that visceral adipose tissue accumulation is positively associated with cardiovascular disease. In the present study, although we found that the pericarotid fat density was associated with CSVD risk factors, such as age, hypertension and hyperlipidemia, the association between the pericarotid fat density and CSVD remained significant after adjusting for these clinical parameters. Thus, pericarotid fat is an independent risk factor for CSVD.
We found that the pericarotid fat density was associated with the presence of lacunes and higher WMH grades. Although the relationship between carotid artery disease and CSVD has been gradually revealed [13–15], the pathophysiologic mechanisms underlying the relationship between pericarotid fat and CSVD have not been fully established. Increasing studies have identified that perivascular fat has endocrine and paracrine functions, and the pathophysiological characteristics seem to be distinct in different anatomical locations and metabolic statuses [7, 8, 16].
One possible explanation is that pericarotid fat is a vascular risk factor that predisposes individuals to developing CSVD. Previous studies have revealed that both asymptomatic and symptomatic carotid atherosclerosis and compliance are associated with imaging markers of CSVD [7, 17, 18], and this phenomenon is more obvious in the ipsilateral hemisphere with ICA stenosis than the contralateral hemisphere [18]. It is conventionally believed that perivascular fat has a detrimental effect on the vessel [8, 19]. For example, inflammatory changes in the fat surrounding the coronary artery are associated with high-risk plaque changes and coronary artery disease [2, 20]. In addition, an increased density of pericarotid fat was recently described in high-risk vulnerable carotid atherosclerotic plaque [2]. Thus, it can be inferred that the structural and functional changes in upstream large arteries affected by perivascular fat may alter the hemodynamics of small vessels downstream in the brain and might be linked to the pathogenesis of CSVD [21]. Notably, the relationship between the vascular wall and the surrounding adipose tissue is complex and likely bidirectional; for example, inflamed human vessels exert paracrine effects on the surrounding perivascular fat, preventing local intracellular lipid accumulation [22].
Another possible explanation is the direct communication between adipose tissue and the surrounding tissue. The perivascular fat of the ICA may have a profound influence on adjacent tissues through locally secreted biochemical factors, such as a paracrine fat organ in other parts [8, 9, 19]. Recent data support the role of perivascular fat density changes as a histopathologic marker of low-grade inflammation [23, 24]. Inflammation could impair endothelial function, leading to damaged regulation of vascular tone and the vasodilatory response, resulting in insufficient perfusion in the small perforating artery area and causing parenchymal changes, which are two potential mechanisms accounting for WMHs and lacunes.
We did not observe a significant correlation between pericarotid fat and the degree of PVSs. PVSs are extensions of the extracerebral fluid-filled spaces that follow the typical course of a vessel as it passes through gray or white matter, which is considered a passive anatomical structure secondary to transient vasoconstriction and vasodilation of the vessel it surrounds [25]. Our study suggested that pericarotid fat may not play a major role in the formation of dilated PVSs.
We found that the patients with AIS had a significantly higher mean pericarotid fat density than those without AIS. Our finding is similar to recent findings suggesting an increased density in the pericarotid fat surrounding the stenotic ICAs of patients with ischemic events compared with that of patients who were asymptomatic [18]. As mentioned above, pericarotid fat is directly wrapped around the carotid artery, and a higher density of pericarotid fat is a marker of carotid atherosclerotic plaque instability and vascular inflammation, which are risk factors for ischemic stroke. Recent studies have suggested that certain vulnerable plaques may present a risk factor for acute embolic infarction even though they do not cause any hemodynamically significant stenosis [26]. Our findings may have implications for identifying vulnerable plaques. Previous studies demonstrated that inflammatory signals secreted by the vascular wall of vulnerable plaques may prevent lipid accumulation by influencing the biological processes of adipocyte differentiation, proliferation and lipolysis [27, 28]. Thus, the density of perivascular fat could be increased due to decreased lipid accumulation under active vessel inflammation. Similarly, perivascular fat surrounding the proximal segments of the major coronary arteries had a striking value in the prognosis of cardiac death and nonfatal myocardial infarction and was associated with an increased risk of fatal heart attacks [29, 30]. The above results highlight the need for more tailored therapy for a subset of patients with a higher perivascular fat density to prevent recurrent stroke.
In the patients with extracranial ICA stenosis, we found that the pericarotid fat density in the maximum stenosis slice had a larger mean HU and maximum HU than those near the origin of the ICA. A previous study found a significantly increased pericarotid fat density around the stenotic ICA compared with that around the nonstenotic ICA on the same axial slice [18]. Combined with our research, these results further suggest that the presence of significant carotid artery stenosis is associated with increased perivascular fat inflammation. In addition, we found that the pericarotid fat density has correlations between the origin of the ICA and maximum stenosis. Because the origin of the ICA can easily and consistently be located in individuals, the density of fat in this place appears to be a marker of pericarotid fat.
Our study has some limitations. First, due to the cross-sectional nature of the study, causality cannot be determined. Future prospective studies could be helpful in confirming the cause-effect relationship. Second, we included a large proportion of stroke patients and limited the age to between 50 and 80 years. The prevalence of WMHs and lacunar infarcts might be overestimated, and these patients were older. Neck CTA is usually performed because of suspected cerebrovascular disease. In addition, the MR images were evaluated by a single observer, and such analyses could be more rigorous when performed by several observers. Third, because Asian populations have a higher proportion of intracranial atherosclerotic stenosis [31, 32], which is also related to the imaging markers of CSVD, intracranial atherosclerotic stenosis should be considered. Fourth, the measurement of fat density on CT can be affected by variability in the ROI placement. We chose to measure the average from bilateral ICAs from 3 discontinuous sections to reduce the degree of variation.
Nevertheless, to the best of our knowledge, this study was the first to investigate the association between pericarotid fat and CSVD and suggest that features that appear to extend beyond the vessel lumen of the ICA may be linked to CSVD. This information has implications for whether targeted medical intervention for perivascular fat can be effective in preventing diseases of the carotid artery and progression of CSVD.
In conclusion, our study provides evidence suggesting that an increased pericarotid fat density is associated with the presence and degree of WMHs and lacunes. It is necessary to identify potential biological pathways supporting the association between pericarotid fat changes and CSVD.
Materials and Methods
Patient recruitment
We screened patients consecutively at our department from January 1, 2016, to December 31, 2019, to identify subjects meeting the following inclusion criteria: 1) an interval between the screened neck CTA and cranial MRI no longer than 3 months and 2) an age between 50 and 80 years. The exclusion criteria were as follows: 1) severe malacia lesion, extensive or old infarction, hemorrhage, atrophy or tumor; 2) other diseases that may cause white matter lesions, such as multiple sclerosis, vasculitis, and connective tissue diseases; or 3) poor imaging quality or partially missing images.
This study was approved by the ethics committee of the Taizhou Central Hospital (approval number, 2020L-12-04). The study protocol conforms to the ethical guidelines of the 1975 Declaration of Helsinki. Informed patient consent was exempted because this was a retrospective study based on routine clinical data.
Data collection and determination
The demographics, clinical features, and vascular risk factors were extracted from the patients’ medical records. The risk factors were defined as follows: hypertension (systolic/diastolic blood pressure > 140/90 mmHg over repeated measurements or a medical history of hypertension), diabetes mellitus (fasting blood glucose > 7.0 mmol/L, hemoglobin A1c > 6.5%, self-reported diabetes mellitus, or the use of oral antidiabetic drugs or insulin), hyperlipidemia (serum triglycerides > 1.7 mmol/L, low-density lipoprotein > 3.4 mmol/L, high-density lipoprotein cholesterol < 0.8 mmol/L, or the use of statins), current smoking (currently smoking or quit smoking within 1 year of admission), and drinking (> 2 standard alcoholic beverages consumed per day).
Neuroimaging acquisition and processing
Computed tomography angiography (CTA) was performed using a 64-slice Discovery CT750 HD (GE, USA) with the following parameters: 100 kVp, 3 mAs, section thickness 0.625 mm, interval 0.625 mm, and display field of view (DFOV) 250 × 250 mm. Intravenous iodinated contrast (Ioversol Injection, 1.5-2 ml/kg; Hengrui Medicine Co., Ltd., China) was administered at a rate of 4.0 mL/s.
The MRI examinations were performed using a 1.5T MR-Signa HDx MRI system (GE, USA). The MRI images were obtained after axial scanning using the following parameters: time repetition (TR)/time echo (TE)=8200/109 ms, slice thickness (ST) = 5 mm, DFOV = 165 × 240 mm for T2-weighted images; TR/TE = 464/14 ms, ST = 4 mm, and DFOV = 225 × 240 mm for T1-weighted images; and TR/TE = 3400/94 ms, ST = 5 mm, and DFOV = 230 × 230 mm for diffusion-weighted imaging (DWI).
Pericarotid fat density analysis
The density of the pericarotid fat surrounding the extracranial ICA can be measured via Hounsfield units (HU) on routine CTA imaging. We referred to an established approach previously described in [2] using predefined image display settings (window width, 500 HU; window center, 100 HU). We placed 2 regions of interest (ROIs) (3 mm2 in diameter) in the perivascular fat on both sides of the ICAs (Figure 3). The ROIs were placed at least 1 mm from the outer margin of the carotid artery wall to exclude the carotid artery wall and surrounding soft-tissue structures. The HU values were recorded from 3 discontinuous slices near the origin of the ICA, and then, the mean and maximum HU values were measured. In addition, if North American Symptomatic Carotid Endarterectomy Trial (NASCET)-defined ICA stenosis was present, we recorded the value at the maximum stenosis slices [33].
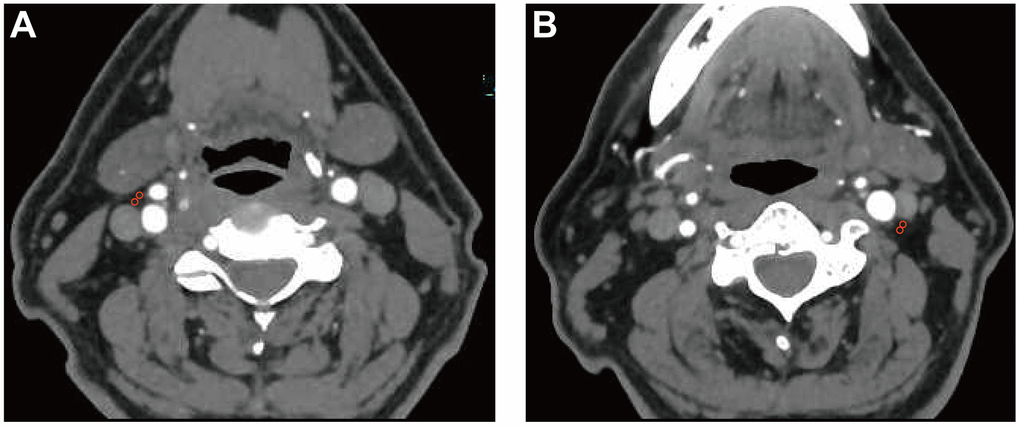
Figure 3. Pericarotid fat density analysis. Two regions of interest (3 mm2 in diameter) were placed in the pericarotid fat surrounding the origin of the internal carotid artery. (A) right internal carotid artery. (B) left internal carotid artery.
The evaluation of the density of the pericarotid fat was performed by a neuroradiologist blinded to the clinical data. To test the reliability of the measurements, a second neuroradiologist blinded to the clinical data and initial measurements re-evaluated a subset of patients with extracranial ICA stenosis. The average value of the two data points was calculated and used. The intraclass correlation coefficient (ICC) values of the mean and maximum HU from the two observers were 0.808 (0.67, 0.89) and 0.842 (0.73, 0.91), respectively. A Bland-Altman analysis was performed as shown in Supplementary Figure 1. Our measurements were simple and showed high reproducibility, suggesting that interreader differences are likely relatively modest using this technique.
Assessment of MRI markers of CSVD
All imaging markers of CSVD were defined according to the neuroimaging standards as usual [7, 34]. The presence of lacunes, WMHs, and PVSs was observed independently outside the acute infarct area (based on DWI). Briefly, lacunes were defined as round or ovoid, subcortical, fluid-filled cavities (signal similar to cerebrospinal fluid) of 3-15 mm in diameter situated in the subcortical white matter, basal ganglia, or brain stem. Cerebral WMH was defined as a focal ≥3 mm lesion without definite hypointensity on T1-weighted images and with hyperintensity on fluid-attenuated inversion recovery (FLAIR) and T2-weighted images and rated according to the Fazekas scale from 0 to 3 [35]. PVSs were defined as cerebrospinal fluid (CSF)-like signal lesions that were round, ovoid, or linear and 1-3 mm in diameter situated in the centrum semiovale and basal ganglia and rated on a validated semiquantitative scale from 0 to 4 [36]. In this study, we counted PVSs only in the basal ganglia because the PVSs in this region seemed to be specifically associated with CSVD [37]. One neuroradiology board-certified expert in our hospital who was blinded to the clinical data reviewed all brain MR images.
Statistical analysis
The normally distributed data are presented as the mean ± standard deviation (SD), and the nonnormally distributed data are presented as the median (interquartile range). The categorical data are presented as frequencies and percentages. The clinical and neuroimaging characteristics of the groups were compared using Student’s t-test, paired t-test, analysis of variance with Bonferroni correction, Mann–Whitney U test or Pearson's chi-square test as appropriate. The correlations were measured using a Spearman correlation analysis. We calculated the ICC and corresponding 95% CI to evaluate the degree of interreader reliability. In the multivariate analyses, the associations between the perivascular fat density (independent variable) and MRI markers of CSVD (dependent variables) were investigated using a binary logistic regression (for the presence of lacunes) and ordinal logistic regression (for WMHs and PVSs). The severity of WMHs and PVSs was trichotomized because of the small number of samples with a more severe degree (mild [degree 0], moderate [degree 1], and severe [degrees 2-3 for WMHs and degrees 2-4 for PVSs]). The quantitative data were divided into several layers per standard deviation increase. The results are expressed as the adjusted ORs (multivariate analysis) along with their 95% confidence intervals (CIs). All data were analyzed using SPSS 20.0 (IBM, Chicago, IL, USA). Two-sided P-values<0.05 were considered statistically significant if not otherwise specified.
Author Contributions
Xin-Wei He designed the study and conducted data analysis. Dan-Hong Zhang and Qiu-Yue Chen interpreted the data and wrote the manuscript. Jiao-Lei Jin and Cheng-Fei Zhu collected and interpreted the data. All authors drafted and revised the manuscript. The final manuscript was read and approved by all authors.
Conflicts of Interest
The authors declare that they have no conflicts of interest.
Funding
This work was supported by the Zhejiang Provincial Medicine and Health Research Foundation [grant number 2019KY789], the Taizhou Science and Technology Plan [grant number 20ywb50] and the key discipline construction funds from our hospital.
References
- 1. Antonopoulos AS, Sanna F, Sabharwal N, Thomas S, Oikonomou EK, Herdman L, Margaritis M, Shirodaria C, Kampoli AM, Akoumianakis I, Petrou M, Sayeed R, Krasopoulos G, et al. Detecting human coronary inflammation by imaging perivascular fat. Sci Transl Med. 2017; 9:eaal2658. https://doi.org/10.1126/scitranslmed.aal2658 [PubMed]
- 2. Baradaran H, Myneni PK, Patel P, Askin G, Gialdini G, Al-Dasuqi K, Kamel H, Gupta A. Association Between Carotid Artery Perivascular Fat Density and Cerebrovascular Ischemic Events. J Am Heart Assoc. 2018; 7:e010383. https://doi.org/10.1161/JAHA.118.010383 [PubMed]
- 3. Saba L, Zucca S, Gupta A, Micheletti G, Suri JS, Balestrieri A, Porcu M, Crivelli P, Lanzino G, Qi Y, Nardi V, Faa G, Montisci R. Perivascular Fat Density and Contrast Plaque Enhancement: Does a Correlation Exist? AJNR Am J Neuroradiol. 2020; 41:1460–65. https://doi.org/10.3174/ajnr.A6710 [PubMed]
- 4. Pantoni L. Cerebral small vessel disease: from pathogenesis and clinical characteristics to therapeutic challenges. Lancet Neurol. 2010; 9:689–701. https://doi.org/10.1016/S1474-4422(10)70104-6 [PubMed]
- 5. Wardlaw JM, Smith C, Dichgans M. Small vessel disease: mechanisms and clinical implications. Lancet Neurol. 2019; 18:684–96. https://doi.org/10.1016/S1474-4422(19)30079-1 [PubMed]
- 6. Xia Y, Shen Y, Wang Y, Yang L, Wang Y, Li Y, Liang X, Zhao Q, Wu J, Chu S, Liang Z, Wang X, Qiu B, et al. White matter hyperintensities associated with progression of cerebral small vessel disease: a 7-year Chinese urban community study. Aging (Albany NY). 2020; 12:8506–22. https://doi.org/10.18632/aging.103154 [PubMed]
- 7. Zhai FF, Yan S, Li ML, Han F, Wang Q, Zhou LX, Ni J, Yao M, Zhang SY, Cui LY, Jin ZY, Zhu YC. Intracranial Arterial Dolichoectasia and Stenosis: Risk Factors and Relation to Cerebral Small Vessel Disease. Stroke. 2018; 49:1135–40. https://doi.org/10.1161/STROKEAHA.117.020130 [PubMed]
- 8. Cassidy AE, Bielak LF, Zhou Y, Sheedy PF 2nd, Turner ST, Breen JF, Araoz PA, Kullo IJ, Lin X, Peyser PA. Progression of subclinical coronary atherosclerosis: does obesity make a difference? Circulation. 2005; 111:1877–82. https://doi.org/10.1161/01.CIR.0000161820.40494.5D [PubMed]
- 9. Rosito GA, Massaro JM, Hoffmann U, Ruberg FL, Mahabadi AA, Vasan RS, O’Donnell CJ, Fox CS. Pericardial fat, visceral abdominal fat, cardiovascular disease risk factors, and vascular calcification in a community-based sample: the Framingham Heart Study. Circulation. 2008; 117:605–13. https://doi.org/10.1161/CIRCULATIONAHA.107.743062 [PubMed]
- 10. Kwon HM, Park JH, Park JH, Jeong HY, Lim JS, Jeong HG, Shin DW, Yun JM, Lee H. Visceral Fat Is an Independent Predictor of Cerebral Microbleeds in Neurologically Healthy People. Cerebrovasc Dis. 2016; 42:90–96. https://doi.org/10.1159/000445300 [PubMed]
- 11. Karcher HS, Holzwarth R, Mueller HP, Ludolph AC, Huber R, Kassubek J, Pinkhardt EH. Body fat distribution as a risk factor for cerebrovascular disease: an MRI-based body fat quantification study. Cerebrovasc Dis. 2013; 35:341–48. https://doi.org/10.1159/000348703 [PubMed]
- 12. Kim KW, Seo H, Kwak MS, Kim D. Visceral obesity is associated with white matter hyperintensity and lacunar infarct. Int J Obes (Lond). 2017; 41:683–88. https://doi.org/10.1038/ijo.2017.13 [PubMed]
- 13. Chen YC, Wei XE, Lu J, Qiao RH, Shen XF, Li YH. Correlation Between Intracranial Arterial Calcification and Imaging of Cerebral Small Vessel Disease. Front Neurol. 2019; 10:426. https://doi.org/10.3389/fneur.2019.00426 [PubMed]
- 14. Viswanathan V, Jamthikar AD, Gupta D, Puvvula A, Khanna NN, Saba L, Viskovic K, Mavrogeni S, Laird JR, Pareek G, Miner M, Sfikakis PP, Protogerou A, et al. Does the Carotid Bulb Offer a Better 10-Year CVD/Stroke Risk Assessment Compared to the Common Carotid Artery? A 1516 Ultrasound Scan Study. Angiology. 2020; 71:920–33. https://doi.org/10.1177/0003319720941730 [PubMed]
- 15. Zijlstra LE, Trompet S, Jukema JW, Kroft LJ, de Bresser J, van Osch MJ, Hammer S, Witjes MN, van Buren M, Mooijaart SP. Association of cardiovascular structure and function with cerebrovascular changes and cognitive function in older patients with end-stage renal disease. Aging (Albany NY). 2020; 12:1496–511. https://doi.org/10.18632/aging.102696 [PubMed]
- 16. Liu Y, Sun Y, Hu C, Liu J, Gao A, Han H, Chai M, Zhang J, Zhou Y, Zhao Y. Perivascular Adipose Tissue as an Indication, Contributor to, and Therapeutic Target for Atherosclerosis. Front Physiol. 2020; 11:615503. https://doi.org/10.3389/fphys.2020.615503 [PubMed]
- 17. Della-Morte D, Dong C, Markert MS, Elkind MS, Sacco RL, Wright CB, Rundek T. Carotid Intima-Media Thickness Is Associated With White Matter Hyperintensities: The Northern Manhattan Study. Stroke. 2018; 49:304–11. https://doi.org/10.1161/STROKEAHA.117.018943 [PubMed]
- 18. Sahin N, Solak A, Genc B, Akpinar MB. Dilatation of the Virchow-Robin spaces as an indicator of unilateral carotid artery stenosis: correlation with white matter lesions. Acta Radiol. 2015; 56:852–59. https://doi.org/10.1177/0284185114544243 [PubMed]
- 19. Mahabadi AA, Massaro JM, Rosito GA, Levy D, Murabito JM, Wolf PA, O’Donnell CJ, Fox CS, Hoffmann U. Association of pericardial fat, intrathoracic fat, and visceral abdominal fat with cardiovascular disease burden: the Framingham Heart Study. Eur Heart J. 2009; 30:850–56. https://doi.org/10.1093/eurheartj/ehn573 [PubMed]
- 20. Lu MT, Park J, Ghemigian K, Mayrhofer T, Puchner SB, Liu T, Fleg JL, Udelson JE, Truong QA, Ferencik M, Hoffmann U. Epicardial and paracardial adipose tissue volume and attenuation - Association with high-risk coronary plaque on computed tomographic angiography in the ROMICAT II trial. Atherosclerosis. 2016; 251:47–54. https://doi.org/10.1016/j.atherosclerosis.2016.05.033 [PubMed]
- 21. Zhai FF, Yang M, Wei Y, Wang M, Gui Y, Han F, Zhou LX, Ni J, Yao M, Zhang SY, Jin ZY, Cui LY, Dai Q, Zhu YC. Carotid atherosclerosis, dilation, and stiffness relate to cerebral small vessel disease. Neurology. 2020; 94:e1811–19. https://doi.org/10.1212/WNL.0000000000009319 [PubMed]
- 22. Lin A, Dey D, Wong DT, Nerlekar N. Perivascular Adipose Tissue and Coronary Atherosclerosis: from Biology to Imaging Phenotyping. Curr Atheroscler Rep. 2019; 21:47. https://doi.org/10.1007/s11883-019-0817-3 [PubMed]
- 23. Oikonomou EK, West HW, Antoniades C. Cardiac Computed Tomography: Assessment of Coronary Inflammation and Other Plaque Features. Arterioscler Thromb Vasc Biol. 2019; 39:2207–19. https://doi.org/10.1161/ATVBAHA.119.312899 [PubMed]
- 24. Rittig K, Dolderer JH, Balletshofer B, Machann J, Schick F, Meile T, Küper M, Stock UA, Staiger H, Machicao F, Schaller HE, Königsrainer A, Häring HU, Siegel-Axel DI. The secretion pattern of perivascular fat cells is different from that of subcutaneous and visceral fat cells. Diabetologia. 2012; 55:1514–25. https://doi.org/10.1007/s00125-012-2481-9 [PubMed]
- 25. Rouhl RP, Damoiseaux JG, Lodder J, Theunissen RO, Knottnerus IL, Staals J, Henskens LH, Kroon AA, de Leeuw PW, Tervaert JW, van Oostenbrugge RJ. Vascular inflammation in cerebral small vessel disease. Neurobiol Aging. 2012; 33:1800–06. https://doi.org/10.1016/j.neurobiolaging.2011.04.008 [PubMed]
- 26. Knight-Greenfield A, Quitlong Nario JJ, Vora A, Baradaran H, Merkler A, Navi BB, Kamel H, Gupta A. Associations Between Features of Nonstenosing Carotid Plaque on Computed Tomographic Angiography and Ischemic Stroke Subtypes. J Am Heart Assoc. 2019; 8:e014818. https://doi.org/10.1161/JAHA.119.014818 [PubMed]
- 27. Dai X, Yu L, Lu Z, Shen C, Tao X, Zhang J. Serial change of perivascular fat attenuation index after statin treatment: Insights from a coronary CT angiography follow-up study. Int J Cardiol. 2020; 319:144–49. https://doi.org/10.1016/j.ijcard.2020.06.008 [PubMed]
- 28. Grant RW, Stephens JM. Fat in flames: influence of cytokines and pattern recognition receptors on adipocyte lipolysis. Am J Physiol Endocrinol Metab. 2015; 309:E205–13. https://doi.org/10.1152/ajpendo.00053.2015 [PubMed]
- 29. Oikonomou EK, Marwan M, Desai MY, Mancio J, Alashi A, Hutt Centeno E, Thomas S, Herdman L, Kotanidis CP, Thomas KE, Griffin BP, Flamm SD, Antonopoulos AS, et al. Non-invasive detection of coronary inflammation using computed tomography and prediction of residual cardiovascular risk (the CRISP CT study): a post-hoc analysis of prospective outcome data. Lancet. 2018; 392:929–39. https://doi.org/10.1016/S0140-6736(18)31114-0 [PubMed]
- 30. Antoniades C, Shirodaria C. Detecting Coronary Inflammation With Perivascular Fat Attenuation Imaging: Making Sense From Perivascular Attenuation Maps. JACC Cardiovasc Imaging. 2019; 12:2011–14. https://doi.org/10.1016/j.jcmg.2018.12.024 [PubMed]
- 31. Wityk RJ, Lehman D, Klag M, Coresh J, Ahn H, Litt B. Race and sex differences in the distribution of cerebral atherosclerosis. Stroke. 1996; 27:1974–80. https://doi.org/10.1161/01.str.27.11.1974 [PubMed]
- 32. Wong LK. Global burden of intracranial atherosclerosis. Int J Stroke. 2006; 1:158–59. https://doi.org/10.1111/j.1747-4949.2006.00045.x [PubMed]
- 33. Henderson RD, Eliasziw M, Fox AJ, Rothwell PM, Barnett HJ. Angiographically defined collateral circulation and risk of stroke in patients with severe carotid artery stenosis. North American Symptomatic Carotid Endarterectomy Trial (NASCET) Group. Stroke. 2000; 31:128–32. https://doi.org/10.1161/01.str.31.1.128 [PubMed]
- 34. Wardlaw JM, Smith EE, Biessels GJ, Cordonnier C, Fazekas F, Frayne R, Lindley RI, O’Brien JT, Barkhof F, Benavente OR, Black SE, Brayne C, Breteler M, et al, and STandards for ReportIng Vascular changes on nEuroimaging (STRIVE v1). Neuroimaging standards for research into small vessel disease and its contribution to ageing and neurodegeneration. Lancet Neurol. 2013; 12:822–38. https://doi.org/10.1016/S1474-4422(13)70124-8 [PubMed]
- 35. Fazekas F, Chawluk JB, Alavi A, Hurtig HI, Zimmerman RA. MR signal abnormalities at 1.5 T in Alzheimer’s dementia and normal aging. AJR Am J Roentgenol. 1987; 149:351–56. https://doi.org/10.2214/ajr.149.2.351 [PubMed]
- 36. Maclullich AM, Wardlaw JM, Ferguson KJ, Starr JM, Seckl JR, Deary IJ. Enlarged perivascular spaces are associated with cognitive function in healthy elderly men. J Neurol Neurosurg Psychiatry. 2004; 75:1519–23. https://doi.org/10.1136/jnnp.2003.030858 [PubMed]
- 37. Bos D, Wolters FJ, Darweesh SK, Vernooij MW, de Wolf F, Ikram MA, Hofman A. Cerebral small vessel disease and the risk of dementia: A systematic review and meta-analysis of population-based evidence. Alzheimers Dement. 2018; 14:1482–92. https://doi.org/10.1016/j.jalz.2018.04.007 [PubMed]