


Introduction
The growing number of allergic diseases in recent decades worldwide has become a public health concern, for which the World Health Organization has prioritized prevention and treatment activities [1]. In 2016, 8.4% of the United States population had asthma compared to 4.3% globally [2]. A survey from 2010 covering eight provinces and cities in China found asthma prevalence of 1.24% among people older than 14 years [3]. The questionnaire-based self-reported prevalence of allergic rhinitis in 11 cities in China ranged between 8.5–24.1% in 2009 [4]. An epidemiological survey in Shanghai in 2012 showed that the prevalence of atopic dermatitis in children aged 3–6 years was 8.3% [5]. With changes in the environment and rapid economic development [6, 7], people in China pay more attention to allergies, but there is still no multicenter, large-scale study focusing on allergies in the Chinese population.
It is well known that allergic diseases are caused by the body immune-mediated overreaction to foreign proteins. The allergenicity of proteins is likely determined by additional factors, such as the amount and duration of exposure, environmental conditions, including microbial exposure, immune-modulating components of allergenic sources facilitating the Th2 immune response, and the intrinsic effects of proteins on the innate and adaptive immune systems [8]. Boulet et al. [9] used allergy skin prick tests for common airborne indoor and outdoor allergens in 3,371 consecutive patients and found that sensitization for indoor allergens was more prevalent than outdoor allergens in all age and diagnostic groups. The prevalence and degree of sensitization peaked in young adults, regardless of the allergen, and diminished with age. There is now compelling evidence that rising air temperatures and carbon dioxide concentrations result in increased pollen production, allergenicity, advancement, and lengthening of the pollen season in some plant species. Changes in extreme weather events, such as thunderstorms and tropical cyclones, could also impact allergic diseases. For example, flooding associated with tropical cyclones could lead to mold proliferation in damp homes [10]. Shah and Newcomb [11] found that asthma prevalence in boys was higher than in girls, while in adults, asthma was more prevalent in females than in males. Many factors, including genetic, environmental, immunological responses, and sex hormones, affect the sex disparity associated with the development and control of asthma and other allergic diseases. Fluctuations in hormones during puberty, menstruation, pregnancy, and menopause alter asthma symptoms and severity. Overall, the distribution of allergens differs by climate, geographic region, and lifestyle. Different age or sex groups have different sensitivities to allergens. However, understanding allergic diseases requires knowledge of the sources, distributions, and properties of individual allergens. An epidemiological survey of the distribution of common allergens in China is lacking.
Skin puncture tests, spot tests, and specific immunoglobulin E (IgE) tests are usually used to detect allergens. The specific IgE test is based on a combination of the antigen and the patient antigen-specific IgE. This test is advantageous as it does not lead to skin lesions and avoids other risks associated with allergic induction tests.
This multicenter study used antigen-specific IgE tests to investigate the distribution of common allergens in the southern China cities of Chengdu, Chongqing, Liuzhou, and Shenzhen.
Results
The distinguishing feature of allergen distribution in Chengdu
Specific IgE tests were performed in 14,030 participants, 8,031 (57.24%) males and 5,999 (42.76%) females, aged 41.93 ± 14.49 years. Of these, 3,455 (24.63%) were sensitive to at least one allergen. The three most common allergens were mite mix (1,876, 13.37%), crab (876, 6.24%), and fish mix (865, 6.17%; Figure 1A).
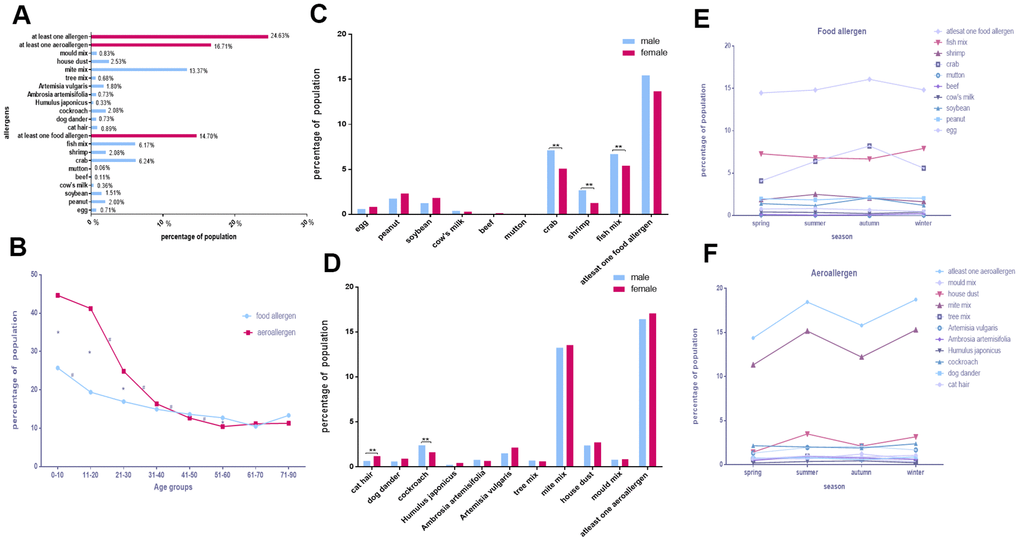
Figure 1. The distinguishing feature of allergen distribution in Chengdu. (A) The positive rates of various allergens. (B) Food allergen and aeroallergen positive rates in different age groups. (C, D) Comparison of allergen positive rates in sex. (E, F) Discrepancies of allergens with seasons.
As shown in Figure 1B, the incidence of allergies to food allergens and aeroallergens decreased with age, with significant differences in aeroallergens between the 11–20, 21–30, 31–40, 41–50, and 51–60 age groups. Only age groups 0–10 and 11–20 differed in food allergens. Furthermore, some age groups (0–10, 11–20, 21–30, and 51–60) differed in their sensitivity to food allergens and aeroallergens (p < 0.05). The positive rates of each allergen in all age groups in Chengdu are showed in Supplementary Figure 1A–1F. Significantly higher positive rates in males than females were observed for single allergen such as crab (odds ratio [OR], 1.429; 95% confidence interval [CI], 1.238–1.649; p < 0.0025), shrimp (OR, 2.116; 95% CI, 1.627–2.751; p < 0.0025), fish mix (OR, 1.252; 95% CI, 1.086–1.443; p < 0.0025), and cockroach (OR, 1.491; 95% CI, 1.166–1.905; p < 0.0025), while the situation was precisely the opposite in cat hair (OR, 0.547; 95% CI, 0.383–0.781; p < 0.0025; Figure 1C, 1D and Table 1).
Table 1. Difference of distribution of allergens between male and female participants in Chengdu.
| Allergens | Male | Female | P | OR | 95%CI | ||||||||||||||||||||||||||||||||||||||||||||||||||||||||||||||||||||||||||||||||||||||||||||||
| egg | 0.61% | 0.85% | 0.095 | 0.716 | 0.483-1.061 | ||||||||||||||||||||||||||||||||||||||||||||||||||||||||||||||||||||||||||||||||||||||||||||||
| peanut | 1.76% | 2.32% | 0.019 | 0.753 | 0.595-0.955 | ||||||||||||||||||||||||||||||||||||||||||||||||||||||||||||||||||||||||||||||||||||||||||||||
| soybean | 1.27% | 1.83% | 0.007 | 0.689 | 0.525-0.904 | ||||||||||||||||||||||||||||||||||||||||||||||||||||||||||||||||||||||||||||||||||||||||||||||
| cow's milk | 0.39% | 0.32% | 0.496 | 1.220 | 0.688-2.161 | ||||||||||||||||||||||||||||||||||||||||||||||||||||||||||||||||||||||||||||||||||||||||||||||
| beef | 0.09% | 0.15% | 0.275 | 0.581 | 0.216-1.560 | ||||||||||||||||||||||||||||||||||||||||||||||||||||||||||||||||||||||||||||||||||||||||||||||
| mutton | 0.06% | 0.05% | 0.764 | 1.245 | 0.297-5.212 | ||||||||||||||||||||||||||||||||||||||||||||||||||||||||||||||||||||||||||||||||||||||||||||||
| crab** | 7.11% | 5.08% | 9.28E-07 | 1.429 | 1.238-1.649 | ||||||||||||||||||||||||||||||||||||||||||||||||||||||||||||||||||||||||||||||||||||||||||||||
| shrimp** | 2.68% | 1.28% | 1.06E-08 | 2.116 | 1.627-2.751 | ||||||||||||||||||||||||||||||||||||||||||||||||||||||||||||||||||||||||||||||||||||||||||||||
| fish mix** | 6.71% | 5.43% | 0.001859 | 1.252 | 1.086-1.443 | ||||||||||||||||||||||||||||||||||||||||||||||||||||||||||||||||||||||||||||||||||||||||||||||
| at least one food allergen | 15.45% | 13.69% | 0.003 | 1.153 | 1.048-1.268 | ||||||||||||||||||||||||||||||||||||||||||||||||||||||||||||||||||||||||||||||||||||||||||||||
| cat hair** | 0.66% | 1.20% | 0.000754 | 0.547 | 0.383-0.781 | ||||||||||||||||||||||||||||||||||||||||||||||||||||||||||||||||||||||||||||||||||||||||||||||
| dog dander | 0.60% | 0.92% | 0.028474 | 0.650 | 0.441-0.958 | ||||||||||||||||||||||||||||||||||||||||||||||||||||||||||||||||||||||||||||||||||||||||||||||
| cockroach** | 2.42% | 1.63% | 0.001327 | 1.491 | 1.166-1.905 | ||||||||||||||||||||||||||||||||||||||||||||||||||||||||||||||||||||||||||||||||||||||||||||||
| H. japonicus | 0.24% | 0.45% | 0.028636 | 0.525 | 0.291-0.944 | ||||||||||||||||||||||||||||||||||||||||||||||||||||||||||||||||||||||||||||||||||||||||||||||
| A. artemisifolia | 0.78% | 0.67% | 0.419191 | 1.178 | 0.791-1.753 | ||||||||||||||||||||||||||||||||||||||||||||||||||||||||||||||||||||||||||||||||||||||||||||||
| A. vulgaris | 1.53% | 2.15% | 0.006328 | 0.708 | 0.552-0.908 | ||||||||||||||||||||||||||||||||||||||||||||||||||||||||||||||||||||||||||||||||||||||||||||||
| tree mix | 0.72% | 0.62% | 0.451226 | 1.172 | 0.775-1.773 | ||||||||||||||||||||||||||||||||||||||||||||||||||||||||||||||||||||||||||||||||||||||||||||||
| mite mix | 13.24% | 13.55% | 0.586327 | 0.973 | 0.882-1.073 | ||||||||||||||||||||||||||||||||||||||||||||||||||||||||||||||||||||||||||||||||||||||||||||||
| house dust | 2.38% | 2.73% | 0.184661 | 0.867 | 0.702-1.071 | ||||||||||||||||||||||||||||||||||||||||||||||||||||||||||||||||||||||||||||||||||||||||||||||
| mold mix | 0.81% | 0.87% | 0.711244 | 0.933 | 0.647-1.346 | ||||||||||||||||||||||||||||||||||||||||||||||||||||||||||||||||||||||||||||||||||||||||||||||
| at least one aeroallergen | 16.44% | 17.07% | 0.319891 | 0.956 | 0.874-1.045 | ||||||||||||||||||||||||||||||||||||||||||||||||||||||||||||||||||||||||||||||||||||||||||||||
| **p < 0.0025 was considered statically significant. | |||||||||||||||||||||||||||||||||||||||||||||||||||||||||||||||||||||||||||||||||||||||||||||||||||
| OR: odds ratio. | |||||||||||||||||||||||||||||||||||||||||||||||||||||||||||||||||||||||||||||||||||||||||||||||||||
The three allergens with the most positive rates in every season in Chengdu were mite mix, fish mix, and crab. Furthermore, the positive rates of soybean, crab, cat hair, tree mix, mite mix, house dust and mold mix vary with the season. (p < 0.05; Figure 1E, 1F and Tables 2, 3).
Table 2. Discrepancies of food allergens in these cities between seasons.
| Egg | Peanut | Soybean | Cow's milk | Beef | Mutton | Crab | Shrimp | Fish mix | At least one food allergen | ||||||||||||||||||||||||||||||||||||||||||||||||||||||||||||||||||||||||||||||||||||||||||
| p (Chengdu) | 0.371 | 0.85049 | 0.002819 | 0.512493 | 0.17479 | 0.153624 | 3.6E-12 | 0.08327 | 0.256785 | 0.207483 | |||||||||||||||||||||||||||||||||||||||||||||||||||||||||||||||||||||||||||||||||||||||||
| spring | 0.78% | 1.99% | 1.41% | 0.43% | 0.14% | 0.12% | 4.09% | 1.87% | 7.29% | 14.47% | |||||||||||||||||||||||||||||||||||||||||||||||||||||||||||||||||||||||||||||||||||||||||
| summer | 0.83% | 1.85% | 1.18% | 0.37% | 0.05% | 0.07% | 6.40% | 2.50% | 6.82% | 14.82% | |||||||||||||||||||||||||||||||||||||||||||||||||||||||||||||||||||||||||||||||||||||||||
| autumn | 0.66% | 2.12% | 2.10% | 0.24% | 0.10% | 0.00% | 8.21% | 2.05% | 6.68% | 16.08% | |||||||||||||||||||||||||||||||||||||||||||||||||||||||||||||||||||||||||||||||||||||||||
| winter | 0.47% | 2.05% | 1.21% | 0.42% | 0.23% | 0.05% | 5.59% | 1.63% | 7.93% | 14.83% | |||||||||||||||||||||||||||||||||||||||||||||||||||||||||||||||||||||||||||||||||||||||||
| p (Chongqing) | 0.441374 | 0.4532 | 0.386068 | 0.674922 | 0.652987 | 0.58443 | 0.26103 | 0.36971 | 0.308746 | 0.266285 | |||||||||||||||||||||||||||||||||||||||||||||||||||||||||||||||||||||||||||||||||||||||||
| spring | 1.10% | 3.63% | 4.95% | 0.58% | 0.50% | 0.10% | 5.66% | 2.45% | 6.96% | 22.32% | |||||||||||||||||||||||||||||||||||||||||||||||||||||||||||||||||||||||||||||||||||||||||
| summer | 1.03% | 3.76% | 4.18% | 0.57% | 0.55% | 0.05% | 5.94% | 2.50% | 6.17% | 20.56% | |||||||||||||||||||||||||||||||||||||||||||||||||||||||||||||||||||||||||||||||||||||||||
| autumn | 1.22% | 3.09% | 4.58% | 0.39% | 0.61% | 0.03% | 6.77% | 3.06% | 5.93% | 21.14% | |||||||||||||||||||||||||||||||||||||||||||||||||||||||||||||||||||||||||||||||||||||||||
| winter | 1.44% | 3.43% | 4.41% | 0.53% | 0.39% | 0.11% | 6.16% | 2.77% | 6.41% | 21.40% | |||||||||||||||||||||||||||||||||||||||||||||||||||||||||||||||||||||||||||||||||||||||||
| p (Liuzhou) | 0.174388 | 0.07486 | 3.91E-18 | 0.001172 | 3.34E-12 | 0.072527 | 0.00001 | 0.14546 | 1.12E-07 | 3.22E-07 | |||||||||||||||||||||||||||||||||||||||||||||||||||||||||||||||||||||||||||||||||||||||||
| spring | 9.81% | 3.19% | 7.97% | 11.34% | 6.11% | 2.29% | 11.26% | 3.55% | 7.80% | 34.71% | |||||||||||||||||||||||||||||||||||||||||||||||||||||||||||||||||||||||||||||||||||||||||
| summer | 10.28% | 3.41% | 7.61% | 9.01% | 4.56% | 1.60% | 14.07% | 3.79% | 8.35% | 35.28% | |||||||||||||||||||||||||||||||||||||||||||||||||||||||||||||||||||||||||||||||||||||||||
| autumn | 9.96% | 3.92% | 11.33% | 10.14% | 6.71% | 1.92% | 12.40% | 3.54% | 9.96% | 39.01% | |||||||||||||||||||||||||||||||||||||||||||||||||||||||||||||||||||||||||||||||||||||||||
| winter | 8.81% | 4.17% | 12.53% | 10.24% | 8.52% | 2.07% | 11.01% | 2.84% | 11.27% | 39.65% | |||||||||||||||||||||||||||||||||||||||||||||||||||||||||||||||||||||||||||||||||||||||||
| p (Shenzhen) | 0.000505 | 0.03433 | 0.461637 | 0.000066 | 0.089658 | 0.300757 | 0.29713 | 0.31027 | 0.002999 | 0.032486 | |||||||||||||||||||||||||||||||||||||||||||||||||||||||||||||||||||||||||||||||||||||||||
| spring | 5.56% | 1.64% | 4.37% | 5.19% | 2.41% | 1.00% | 9.66% | 3.19% | 7.29% | 24.83% | |||||||||||||||||||||||||||||||||||||||||||||||||||||||||||||||||||||||||||||||||||||||||
| summer | 6.22% | 2.51% | 4.06% | 4.75% | 2.72% | 1.25% | 10.54% | 3.07% | 7.04% | 25.23% | |||||||||||||||||||||||||||||||||||||||||||||||||||||||||||||||||||||||||||||||||||||||||
| autumn | 5.92% | 1.99% | 4.94% | 5.49% | 3.31% | 1.36% | 11.05% | 3.11% | 5.14% | 25.26% | |||||||||||||||||||||||||||||||||||||||||||||||||||||||||||||||||||||||||||||||||||||||||
| winter | 3.76% | 1.41% | 4.24% | 2.95% | 2.22% | 0.85% | 9.69% | 2.38% | 5.57% | 22.17% | |||||||||||||||||||||||||||||||||||||||||||||||||||||||||||||||||||||||||||||||||||||||||
| p (Four cities) | 0.001762 | 0.75168 | 4.16E-08 | 0.000002 | 5.23E-07 | 0.074117 | 3.09E-08 | 0.06498 | 0.051316 | 0.393311 | |||||||||||||||||||||||||||||||||||||||||||||||||||||||||||||||||||||||||||||||||||||||||
| spring | 4.70% | 2.80% | 5.08% | 4.95% | 2.64% | 1.00% | 7.82% | 2.80% | 7.38% | 25.13% | |||||||||||||||||||||||||||||||||||||||||||||||||||||||||||||||||||||||||||||||||||||||||
| summer | 4.82% | 2.97% | 4.54% | 3.94% | 2.07% | 0.74% | 9.44% | 3.01% | 7.19% | 24.67% | |||||||||||||||||||||||||||||||||||||||||||||||||||||||||||||||||||||||||||||||||||||||||
| autumn | 4.24% | 2.79% | 5.64% | 3.87% | 2.56% | 0.77% | 9.52% | 2.88% | 7.06% | 25.02% | |||||||||||||||||||||||||||||||||||||||||||||||||||||||||||||||||||||||||||||||||||||||||
| winter | 3.94% | 2.89% | 6.10% | 3.92% | 3.17% | 0.84% | 8.29% | 2.47% | 7.94% | 25.59% | |||||||||||||||||||||||||||||||||||||||||||||||||||||||||||||||||||||||||||||||||||||||||
| p < 0.05 was considered statically significant. | |||||||||||||||||||||||||||||||||||||||||||||||||||||||||||||||||||||||||||||||||||||||||||||||||||
Table 3. Discrepancies of aeroallergens in these cities between seasons.
| Cat hair | Dog dander | Cockroach | H. japonicus | A. artemisifolia | A. vulgaris | Tree mix | Mite mix | House dust | Mold mix | At least one aeroallergen | |||||||||||||||||||||||||||||||||||||||||||||||||||||||||||||||||||||||||||||||||||||||||
| p (Chengdu) | 1.7E-07 | 0.433172 | 0.618812 | 0.265157 | 0.10184 | 0.066911 | 0.03867 | 7.2E-08 | 1.417E-08 | 0.014231 | 6.248E-07 | ||||||||||||||||||||||||||||||||||||||||||||||||||||||||||||||||||||||||||||||||||||||||
| spring | 0.66% | 0.75% | 2.16% | 0.20% | 0.49% | 1.33% | 0.58% | 11.33% | 1.44% | 0.72% | 14.38% | ||||||||||||||||||||||||||||||||||||||||||||||||||||||||||||||||||||||||||||||||||||||||
| summer | 1.00% | 0.81% | 2.02% | 0.37% | 0.95% | 1.95% | 0.95% | 15.16% | 3.50% | 0.67% | 18.46% | ||||||||||||||||||||||||||||||||||||||||||||||||||||||||||||||||||||||||||||||||||||||||
| autumn | 0.88% | 0.56% | 1.90% | 0.44% | 0.78% | 2.10% | 0.63% | 12.21% | 2.12% | 1.22% | 15.81% | ||||||||||||||||||||||||||||||||||||||||||||||||||||||||||||||||||||||||||||||||||||||||
| winter | 1.07% | 0.89% | 2.38% | 0.23% | 0.61% | 1.68% | 0.37% | 15.29% | 3.17% | 0.61% | 18.74% | ||||||||||||||||||||||||||||||||||||||||||||||||||||||||||||||||||||||||||||||||||||||||
| p (Chongqing) | 0.09286 | 0.297607 | 0.277379 | 0.623658 | 0.930804 | 0.610658 | 0.27042 | 0.60867 | 0.393543 | 0.844836 | 0.153423 | ||||||||||||||||||||||||||||||||||||||||||||||||||||||||||||||||||||||||||||||||||||||||
| spring | 3.15% | 3.55% | 6.06% | 0.35% | 1.55% | 1.83% | 1.48% | 13.61% | 9.01% | 1.35% | 31.71% | ||||||||||||||||||||||||||||||||||||||||||||||||||||||||||||||||||||||||||||||||||||||||
| summer | 2.98% | 3.88% | 7.11% | 0.50% | 1.70% | 2.20% | 1.93% | 14.62% | 8.51% | 1.49% | 33.75% | ||||||||||||||||||||||||||||||||||||||||||||||||||||||||||||||||||||||||||||||||||||||||
| autumn | 2.48% | 3.74% | 6.48% | 0.55% | 1.71% | 1.97% | 1.42% | 13.92% | 8.12% | 1.51% | 32.13% | ||||||||||||||||||||||||||||||||||||||||||||||||||||||||||||||||||||||||||||||||||||||||
| winter | 2.28% | 3.05% | 6.58% | 0.46% | 1.58% | 2.17% | 1.72% | 14.15% | 7.95% | 1.61% | 31.70% | ||||||||||||||||||||||||||||||||||||||||||||||||||||||||||||||||||||||||||||||||||||||||
| p (Liuzhou) | 0.00042 | 0.000002 | 1.48E-28 | 0.000181 | 0.000025 | 1.62E-07 | 0.23479 | 0.08925 | 1.62E-09 | 3.60E-10 | 0.011715 | ||||||||||||||||||||||||||||||||||||||||||||||||||||||||||||||||||||||||||||||||||||||||
| spring | 4.13% | 2.15% | 15.77% | 1.55% | 3.68% | 5.41% | 3.64% | 37.08% | 6.35% | 2.37% | 49.62% | ||||||||||||||||||||||||||||||||||||||||||||||||||||||||||||||||||||||||||||||||||||||||
| summer | 3.03% | 0.97% | 14.47% | 1.27% | 2.80% | 3.68% | 3.70% | 38.59% | 9.73% | 1.87% | 49.73% | ||||||||||||||||||||||||||||||||||||||||||||||||||||||||||||||||||||||||||||||||||||||||
| autumn | 2.73% | 1.45% | 21.46% | 2.29% | 4.18% | 3.95% | 4.33% | 38.66% | 8.89% | 3.57% | 52.60% | ||||||||||||||||||||||||||||||||||||||||||||||||||||||||||||||||||||||||||||||||||||||||
| winter | 4.00% | 1.10% | 22.34% | 2.29% | 4.71% | 5.97% | 4.26% | 36.33% | 7.68% | 4.04% | 51.82% | ||||||||||||||||||||||||||||||||||||||||||||||||||||||||||||||||||||||||||||||||||||||||
| p (Shenzhen) | 0.03275 | 0.553275 | 0.021847 | 0.023533 | 0.354019 | 0.206748 | 0.05855 | 1.6E-05 | 0.001344 | 0.010409 | 0.000003 | ||||||||||||||||||||||||||||||||||||||||||||||||||||||||||||||||||||||||||||||||||||||||
| spring | 3.78% | 1.91% | 8.56% | 1.14% | 3.23% | 4.10% | 3.83% | 31.71% | 5.56% | 1.32% | 40.68% | ||||||||||||||||||||||||||||||||||||||||||||||||||||||||||||||||||||||||||||||||||||||||
| summer | 5.53% | 1.90% | 10.89% | 1.08% | 3.20% | 3.97% | 4.62% | 36.98% | 6.87% | 2.68% | 46.05% | ||||||||||||||||||||||||||||||||||||||||||||||||||||||||||||||||||||||||||||||||||||||||
| autumn | 4.36% | 2.37% | 10.67% | 1.44% | 4.01% | 4.44% | 4.20% | 37.84% | 8.45% | 2.45% | 48.15% | ||||||||||||||||||||||||||||||||||||||||||||||||||||||||||||||||||||||||||||||||||||||||
| winter | 4.28% | 1.90% | 9.29% | 0.57% | 3.72% | 5.13% | 3.15% | 33.80% | 6.74% | 2.14% | 44.10% | ||||||||||||||||||||||||||||||||||||||||||||||||||||||||||||||||||||||||||||||||||||||||
| p (Four cities) | 0.01103 | 0.073662 | 1.05E-09 | 0.015348 | 0.001252 | 0.00004 | 0.45562 | 0.0001 | 4.90E-07 | 0.000002 | 0.000013 | ||||||||||||||||||||||||||||||||||||||||||||||||||||||||||||||||||||||||||||||||||||||||
| spring | 3.00% | 2.17% | 8.87% | 0.85% | 2.29% | 3.28% | 2.36% | 23.88% | 5.80% | 1.55% | 35.16% | ||||||||||||||||||||||||||||||||||||||||||||||||||||||||||||||||||||||||||||||||||||||||
| summer | 2.84% | 1.82% | 8.79% | 0.81% | 2.08% | 2.88% | 2.65% | 25.95% | 7.39% | 1.57% | 36.86% | ||||||||||||||||||||||||||||||||||||||||||||||||||||||||||||||||||||||||||||||||||||||||
| autumn | 2.41% | 1.89% | 9.77% | 1.14% | 2.51% | 3.00% | 2.47% | 24.48% | 6.52% | 2.14% | 35.51% | ||||||||||||||||||||||||||||||||||||||||||||||||||||||||||||||||||||||||||||||||||||||||
| winter | 3.01% | 1.77% | 10.98% | 0.97% | 2.80% | 3.88% | 2.53% | 25.48% | 6.62% | 2.24% | 37.87% | ||||||||||||||||||||||||||||||||||||||||||||||||||||||||||||||||||||||||||||||||||||||||
| p < 0.05 was considered statically significant. | |||||||||||||||||||||||||||||||||||||||||||||||||||||||||||||||||||||||||||||||||||||||||||||||||||
The property of allergen distribution in Chongqing
Of the 14,612 participants in Chongqing (46.41% male, 53.59% female), 31.56% were sensitive to at least one allergen. The single allergens with the top five sensitivities were mite mix (14.19%), house dust (8.29%), cockroach (6.54%), fish mix (6.25%), and crab (6.08%; Figure 2A).
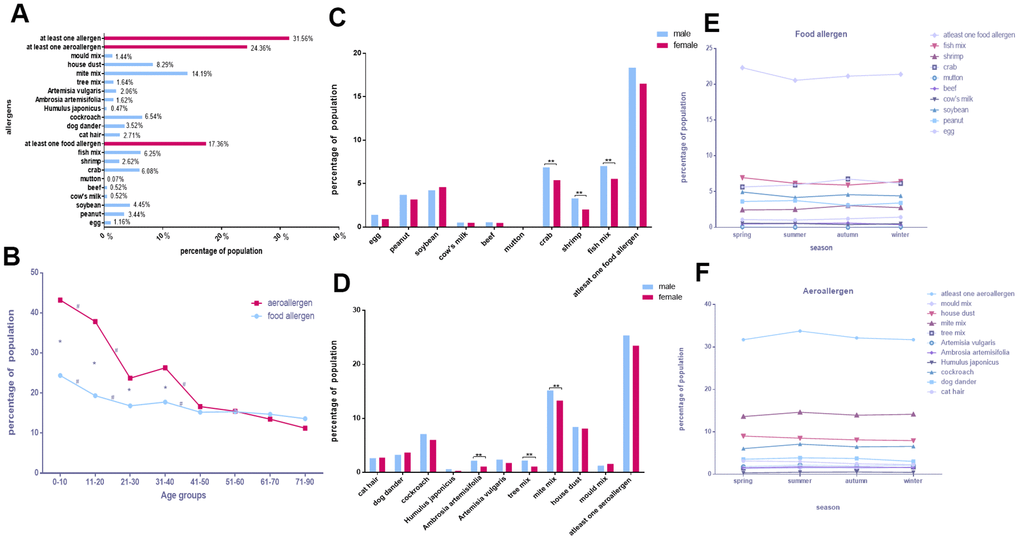
Figure 2. The property of allergen distribution in Chongqing. (A) The positive rates of various allergens. (B) Food allergen and aeroallergen positive rates in different age groups. (C, D) Comparison of allergen positive rates in sex. (E, F) Discrepancies of allergens with seasons.
The proportion of participants positive for aeroallergens was higher than for food allergens in the 0–10, 11–20, 21–30, and 31–40 age groups. As shown in Figure 2B, the prevalence of aeroallergens and food allergens decreased with age, with a decrease in both in the 0–10, 11–20, and 21–30 age groups (p < 0.05). However, the positive rates for single allergens such as mite mix and crab increased from 0–10 to 11–20 (p < 0.05) and then decreased with age (Supplementary Figure 2C, 2F). And the other allergens situation in all age groups in Chongqing is showed in Supplementary Figure 2A, 2B, 2D, 2E.
Some single allergens showed remarkably higher levels in males than in females. These included crab (OR, 1.292; 95% CI, 1.128–1.480), fish mix (OR, 1.283; 95% CI, 1.122–1.467), shrimp (OR, 1.648; 95% CI, 1.341–2.025), mite mix (OR, 1.165; 95% CI, 1.062–1.279), tree mix (OR, 2.041; 95% CI, 1.565–2.661), and Ambrosia artemisifolia (OR, 2.037; 95% CI, 1.559–2.661; p < 0.0025 for all; Figure 2C, 2D and Table 4).
Table 4. Difference of distribution of allergens between male and female participants in Chongqing.
| Allergens | Male | Female | P | OR | 95%CI | ||||||||||||||||||||||||||||||||||||||||||||||||||||||||||||||||||||||||||||||||||||||||||||||
| egg | 1.42% | 0.93% | 0.006423 | 1.526 | 1.124-2.072 | ||||||||||||||||||||||||||||||||||||||||||||||||||||||||||||||||||||||||||||||||||||||||||||||
| peanut | 3.72% | 3.19% | 0.083 | 1.170 | 0.979-1.398 | ||||||||||||||||||||||||||||||||||||||||||||||||||||||||||||||||||||||||||||||||||||||||||||||
| soybean | 4.26% | 4.61% | 0.308 | 0.921 | 0.786-1.079 | ||||||||||||||||||||||||||||||||||||||||||||||||||||||||||||||||||||||||||||||||||||||||||||||
| cow's milk | 0.53% | 0.51% | 0.867 | 1.039 | 0.662-1.633 | ||||||||||||||||||||||||||||||||||||||||||||||||||||||||||||||||||||||||||||||||||||||||||||||
| beef | 0.56% | 0.49% | 0.529 | 1.156 | 0.736-1.814 | ||||||||||||||||||||||||||||||||||||||||||||||||||||||||||||||||||||||||||||||||||||||||||||||
| mutton | 0.06% | 0.08% | 0.76 | 0.770 | 0.217-2.729 | ||||||||||||||||||||||||||||||||||||||||||||||||||||||||||||||||||||||||||||||||||||||||||||||
| crab** | 6.87% | 5.40% | 0.00021 | 1.292 | 1.1281.480 | ||||||||||||||||||||||||||||||||||||||||||||||||||||||||||||||||||||||||||||||||||||||||||||||
| shrimp** | 3.30% | 2.03% | 0.000002 | 1.648 | 1.341-2.025 | ||||||||||||||||||||||||||||||||||||||||||||||||||||||||||||||||||||||||||||||||||||||||||||||
| fish mix** | 7.03% | 5.57% | 0.000261 | 1.283 | 1.122-1.467 | ||||||||||||||||||||||||||||||||||||||||||||||||||||||||||||||||||||||||||||||||||||||||||||||
| at least one food allergen | 18.36% | 16.50% | 0.003 | 1.138 | 1.045-1.240 | ||||||||||||||||||||||||||||||||||||||||||||||||||||||||||||||||||||||||||||||||||||||||||||||
| cat hair | 2.67% | 2.75% | 0.776056 | 0.971 | 0.795-1.187 | ||||||||||||||||||||||||||||||||||||||||||||||||||||||||||||||||||||||||||||||||||||||||||||||
| dog dander | 3.29% | 3.73% | 0.149733 | 0.878 | 0.735-1.048 | ||||||||||||||||||||||||||||||||||||||||||||||||||||||||||||||||||||||||||||||||||||||||||||||
| cockroach | 7.12% | 6.03% | 0.007584 | 1.196 | 1.048-1.363 | ||||||||||||||||||||||||||||||||||||||||||||||||||||||||||||||||||||||||||||||||||||||||||||||
| H. japonicus | 0.63% | 0.32% | 0.005295 | 1.992 | 1.216-3.265 | ||||||||||||||||||||||||||||||||||||||||||||||||||||||||||||||||||||||||||||||||||||||||||||||
| A. artemisifolia** | 2.21% | 1.10% | 1.01E-07 | 2.037 | 1.559-2.661 | ||||||||||||||||||||||||||||||||||||||||||||||||||||||||||||||||||||||||||||||||||||||||||||||
| A. vulgaris | 2.39% | 1.78% | 0.009189 | 1.354 | 1.077-1.703 | ||||||||||||||||||||||||||||||||||||||||||||||||||||||||||||||||||||||||||||||||||||||||||||||
| tree mix** | 2.24% | 1.11% | 7.77E-08 | 2.041 | 1.565-2.661 | ||||||||||||||||||||||||||||||||||||||||||||||||||||||||||||||||||||||||||||||||||||||||||||||
| mite mix ** | 15.19% | 13.32% | 0.001243 | 1.165 | 1.062-1.279 | ||||||||||||||||||||||||||||||||||||||||||||||||||||||||||||||||||||||||||||||||||||||||||||||
| house dust | 8.46% | 8.14% | 4.71E-01 | 1.044 | 0.928-1.175 | ||||||||||||||||||||||||||||||||||||||||||||||||||||||||||||||||||||||||||||||||||||||||||||||
| mold mix | 1.27% | 1.60% | 0.097 | 0.792 | 0.600-1.044 | ||||||||||||||||||||||||||||||||||||||||||||||||||||||||||||||||||||||||||||||||||||||||||||||
| at least one aeroallergen | 25.39% | 23.47% | 0.006995 | 1.110 | 1.029-1.197 | ||||||||||||||||||||||||||||||||||||||||||||||||||||||||||||||||||||||||||||||||||||||||||||||
| **p < 0.0025 was considered statically significant. | |||||||||||||||||||||||||||||||||||||||||||||||||||||||||||||||||||||||||||||||||||||||||||||||||||
| OR: odds ratio. | |||||||||||||||||||||||||||||||||||||||||||||||||||||||||||||||||||||||||||||||||||||||||||||||||||
It is worth mentioning that the allergen included in our study did not differ between seasons in Chongqing (p > 0.05; Figure 2E, 2F and Tables 2, 3).
General characteristics of allergen distribution Liuzhou
Surprisingly, we found that over half (62.21%) of the 17,217 participants in Liuzhou (48.98% male, 51.02% female) tested positive for allergen-specific antibodies. The percentages of allergies were as follows: mite mix, 37.75%; cockroaches, 17.67%; crab, 12.35%; cow’s milk, 10.14%; egg, 9.82%; soybean, 9.35%; fish mix, 9.02%; house dust, 8.19% (Figure 3A).
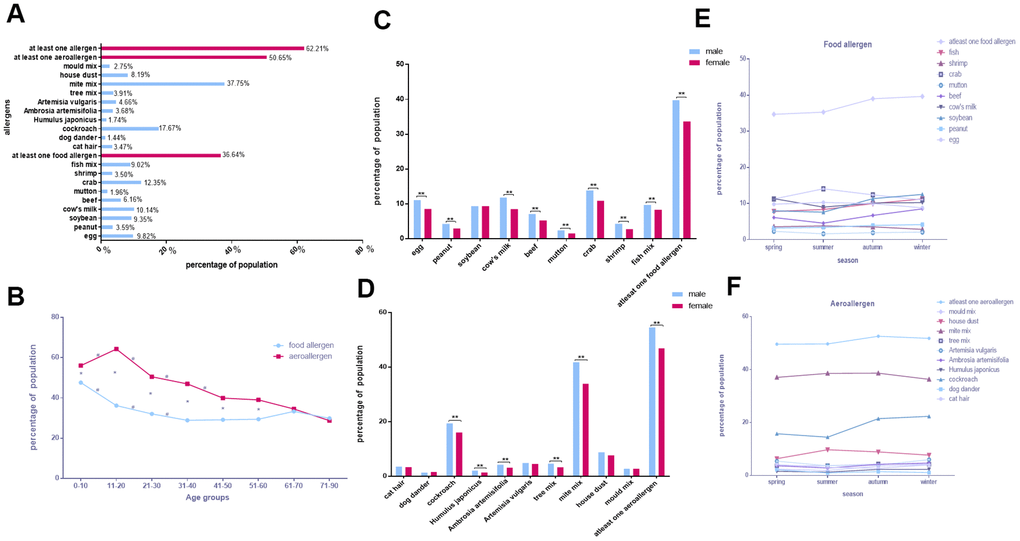
Figure 3. General characteristics of allergen distribution Liuzhou. (A) The positive rates of various allergens. (B) Food allergen and aeroallergen positive rates in different age groups. (C, D) Comparison of allergen positive rates in sex. (E, F) Discrepancies of allergens with seasons.
As shown in Figure 3B, the proportions of participants positive for aeroallergens and food allergen tended to decrease with age; however, an increasing trend was found from 0–10 to 11–20 for aeroallergens (p < 0.05). The aeroallergen positivity rate was higher than for food allergens in the first six age groups (p < 0.05). The positive rates of each allergen in all age groups in Liuzhou are showed in Supplementary Figure 3A–3F.
Some single allergens, including soybean, cat hair, dog dander, house dust, mold mix, and Artemisia vulgaris, had similar positivity rates in both sexes, while others always tested higher in males (p < 0.0025; Figure 3C, 3D and Table 5).
Table 5. Difference of distribution of allergens between male and female participants in Liuzhou.
| Allergens | Male | Female | P | OR | 95%CI | ||||||||||||||||||||||||||||||||||||||||||||||||||||||||||||||||||||||||||||||||||||||||||||||
| Egg** | 11.12% | 8.56% | 1.62E-08 | 1.337 | 1.208-1.479 | ||||||||||||||||||||||||||||||||||||||||||||||||||||||||||||||||||||||||||||||||||||||||||||||
| peanut** | 4.23% | 2.97% | 0.000009 | 1.444 | 1.227-1.698 | ||||||||||||||||||||||||||||||||||||||||||||||||||||||||||||||||||||||||||||||||||||||||||||||
| soybean | 9.34% | 9.35% | 0.995871 | 1.000 | 0.902-1.108 | ||||||||||||||||||||||||||||||||||||||||||||||||||||||||||||||||||||||||||||||||||||||||||||||
| cow's milk** | 11.81% | 8.54% | 1.15E-12 | 1.435 | 1.298-1.585 | ||||||||||||||||||||||||||||||||||||||||||||||||||||||||||||||||||||||||||||||||||||||||||||||
| beef** | 7.09% | 5.27% | 6.87E-07 | 1.372 | 1.210-1.555 | ||||||||||||||||||||||||||||||||||||||||||||||||||||||||||||||||||||||||||||||||||||||||||||||
| mutton** | 2.40% | 1.54% | 0.000048 | 1.572 | 1.262-1.959 | ||||||||||||||||||||||||||||||||||||||||||||||||||||||||||||||||||||||||||||||||||||||||||||||
| crab** | 13.89% | 10.88% | 0.000 | 1.320 | 1.205-1.446 | ||||||||||||||||||||||||||||||||||||||||||||||||||||||||||||||||||||||||||||||||||||||||||||||
| shrimp** | 4.29% | 2.74% | 3.26E-08 | 1.590 | 1.347-1.877 | ||||||||||||||||||||||||||||||||||||||||||||||||||||||||||||||||||||||||||||||||||||||||||||||
| fish mix** | 9.74% | 8.33% | 0.001324 | 1.186 | 1.069-1.317 | ||||||||||||||||||||||||||||||||||||||||||||||||||||||||||||||||||||||||||||||||||||||||||||||
| at least one food allergen** | 39.75% | 33.65% | 1.04E-16 | 1.301 | 1.222-1.384 | ||||||||||||||||||||||||||||||||||||||||||||||||||||||||||||||||||||||||||||||||||||||||||||||
| cat hair | 3.58% | 3.37% | 0.449 | 1.065 | 0.905-1.254 | ||||||||||||||||||||||||||||||||||||||||||||||||||||||||||||||||||||||||||||||||||||||||||||||
| dog dander | 1.32% | 1.56% | 0.18 | 0.842 | 0.654-1.083 | ||||||||||||||||||||||||||||||||||||||||||||||||||||||||||||||||||||||||||||||||||||||||||||||
| cockroach** | 19.36% | 16.04% | 1.09E-08 | 1.257 | 1.162-1.360 | ||||||||||||||||||||||||||||||||||||||||||||||||||||||||||||||||||||||||||||||||||||||||||||||
| H. japonicus** | 2.06% | 1.43% | 0.001618 | 1.448 | 1.149-1.824 | ||||||||||||||||||||||||||||||||||||||||||||||||||||||||||||||||||||||||||||||||||||||||||||||
| A. artemisifolia** | 4.21% | 3.18% | 0.000319 | 1.340 | 1.142-1.572 | ||||||||||||||||||||||||||||||||||||||||||||||||||||||||||||||||||||||||||||||||||||||||||||||
| A. vulgaris | 4.84% | 4.50% | 0.288 | 1.080 | 0.937-1.244 | ||||||||||||||||||||||||||||||||||||||||||||||||||||||||||||||||||||||||||||||||||||||||||||||
| tree mix** | 4.59% | 3.26% | 0.000006 | 1.429 | 1.223-1.670 | ||||||||||||||||||||||||||||||||||||||||||||||||||||||||||||||||||||||||||||||||||||||||||||||
| mite mix** | 41.78% | 33.88% | 1.20E-26 | 1.400 | 1.316-1.490 | ||||||||||||||||||||||||||||||||||||||||||||||||||||||||||||||||||||||||||||||||||||||||||||||
| house dust | 8.78% | 7.63% | 0.00605 | 1.165 | 1.045-1.299 | ||||||||||||||||||||||||||||||||||||||||||||||||||||||||||||||||||||||||||||||||||||||||||||||
| mold mix | 2.72% | 2.78% | 0.803 | 0.977 | 0.814-1.173 | ||||||||||||||||||||||||||||||||||||||||||||||||||||||||||||||||||||||||||||||||||||||||||||||
| at least one aeroallergen** | 54.54% | 46.91% | 1.55E-23 | 1.357 | 1.278-1.441 | ||||||||||||||||||||||||||||||||||||||||||||||||||||||||||||||||||||||||||||||||||||||||||||||
| **p < 0.0025 was considered statically significant. | |||||||||||||||||||||||||||||||||||||||||||||||||||||||||||||||||||||||||||||||||||||||||||||||||||
| OR: odds ratio. | |||||||||||||||||||||||||||||||||||||||||||||||||||||||||||||||||||||||||||||||||||||||||||||||||||
The positive rates of soybean, cow's milk, beef, crab and fish mix vary with the season. (Figure 3E, Table 2). Except for tree mix and mite mix, all aeroallergens differed significantly between seasons (Figure 3F and Table 3). The positive rates for aeroallergens such as cockroach, Humulus japonicus, A. artemisifolia, A. vulgaris, and mold mix were the highest in winter, cat hair and dog dander were the highest in spring, and house dust was the highest in the summer (p < 0.05).
The feature of the distribution of allergens in Shenzhen
We enrolled 9,573 participants in Shenzhen. Around one-third of them had IgE specific for food allergens (35.56%) or aeroallergens (37.27%). Intriguingly, almost all types of single allergens showed a similar positive rate (5.33–6.18%; Figure 4A).
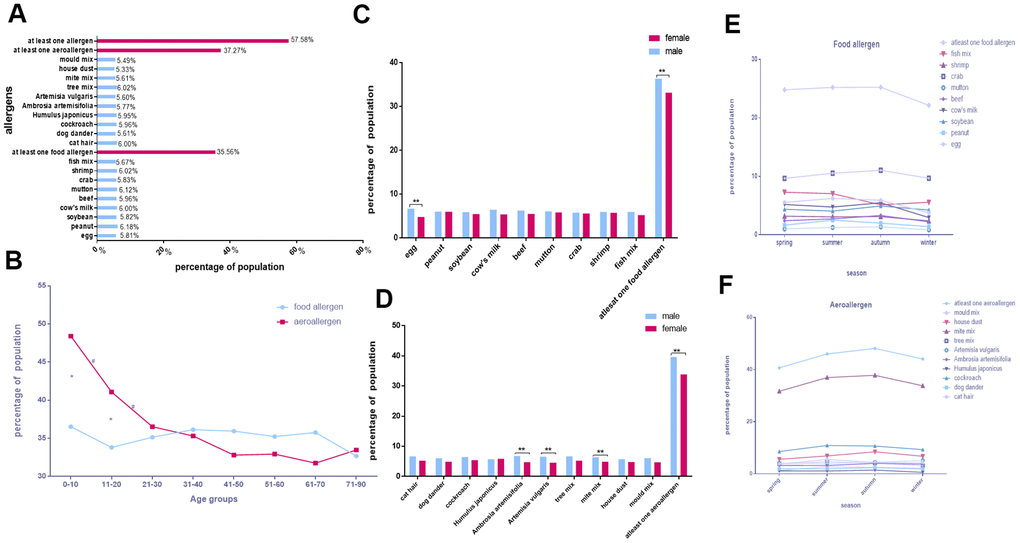
Figure 4. The feature of the distribution of allergens in Shenzhen. (A) The positive rates of various allergens. (B) Food allergen and aeroallergen positive rates in different age groups. (C, D) Comparison of allergen positive rates in sex. (E, F) Discrepancies of allergens with seasons.
All age groups showed a similar proportion of sensitivity to food allergens (p > 0.05). Only the 0–10, 11–20, and 21–30 age groups showed a downward trend in aeroallergens (p < 0.05). Additionally, the positive percentage of aeroallergens was higher than food allergens in the 0–10 and 11–20 age groups (p < 0.05; Figure 4B). The positive rates of each allergen in all age groups in Shenzhen are showed in Supplementary Figure 4A–4F.
The prevalence of sensitization to egg (OR, 1.407; 95% CI, 1.182–1.674; p < 0.0025), mite mix (OR, 1.326; 95% CI, 1.113–1.580; p < 0.0025), A. vulgaris (OR, 1.461; 95% CI, 1.225–1.742; p < 0.0025), and A. artemisifolia (OR, 1.451; 95% CI, 1.220–1.726; p < 0.0025) was remarkably higher in males than females (Figure 4C, 4D and Table 6).
Table 6. Difference of distribution of allergens between male and female participants in Shenzhen.
| Allergens | Male | Female | P | OR | 95%CI | ||||||||||||||||||||||||||||||||||||||||||||||||||||||||||||||||||||||||||||||||||||||||||||||
| egg** | 6.68% | 4.84% | 0.000112 | 1.407 | 1.182-1.674 | ||||||||||||||||||||||||||||||||||||||||||||||||||||||||||||||||||||||||||||||||||||||||||||||
| peanut | 6.05% | 5.97% | 0.86 | 1.015 | 0.857-1.203 | ||||||||||||||||||||||||||||||||||||||||||||||||||||||||||||||||||||||||||||||||||||||||||||||
| soybean | 5.89% | 5.47% | 0.38 | 1.081 | 0.908-1.287 | ||||||||||||||||||||||||||||||||||||||||||||||||||||||||||||||||||||||||||||||||||||||||||||||
| cow's milk | 6.44% | 5.38% | 0.03 | 1.211 | 1.020-1.437 | ||||||||||||||||||||||||||||||||||||||||||||||||||||||||||||||||||||||||||||||||||||||||||||||
| beef | 6.30% | 5.49% | 0.1 | 1.157 | 0.975-1.373 | ||||||||||||||||||||||||||||||||||||||||||||||||||||||||||||||||||||||||||||||||||||||||||||||
| mutton | 6.08% | 5.84% | 0.62 | 1.044 | 0.880-1.238 | ||||||||||||||||||||||||||||||||||||||||||||||||||||||||||||||||||||||||||||||||||||||||||||||
| crab | 5.79% | 5.58% | 0.67 | 1.04 | 0.873-1.238 | ||||||||||||||||||||||||||||||||||||||||||||||||||||||||||||||||||||||||||||||||||||||||||||||
| shrimp | 5.96% | 5.73% | 0.64 | 1.043 | 0.878-1.238 | ||||||||||||||||||||||||||||||||||||||||||||||||||||||||||||||||||||||||||||||||||||||||||||||
| fish mix | 5.96% | 5.23% | 0.12 | 1.148 | 0.963-1.368 | ||||||||||||||||||||||||||||||||||||||||||||||||||||||||||||||||||||||||||||||||||||||||||||||
| at least one food allergen** | 36.38% | 33.15% | 0.001 | 1.153 | 1.059-1.255 | ||||||||||||||||||||||||||||||||||||||||||||||||||||||||||||||||||||||||||||||||||||||||||||||
| cat hair | 6.66% | 5.30% | 0.005 | 1.273 | 1.074-1.509 | ||||||||||||||||||||||||||||||||||||||||||||||||||||||||||||||||||||||||||||||||||||||||||||||
| dog dander | 6.05% | 4.95% | 0.02 | 1.237 | 1.036-1.476 | ||||||||||||||||||||||||||||||||||||||||||||||||||||||||||||||||||||||||||||||||||||||||||||||
| cockroach | 6.46% | 5.41% | 0.03 | 1.207 | 1.018-1.432 | ||||||||||||||||||||||||||||||||||||||||||||||||||||||||||||||||||||||||||||||||||||||||||||||
| H. japonicus | 5.74% | 5.86% | 0.81 | 0.979 | 0.823-1.164 | ||||||||||||||||||||||||||||||||||||||||||||||||||||||||||||||||||||||||||||||||||||||||||||||
| A. artemisifolia** | 6.80% | 4.79% | 0.000024 | 1.451 | 1.220-1.726 | ||||||||||||||||||||||||||||||||||||||||||||||||||||||||||||||||||||||||||||||||||||||||||||||
| A. vulgaris** | 6.61% | 4.62% | 2.30122E-05 | 1.461 | 1.225-1.742 | ||||||||||||||||||||||||||||||||||||||||||||||||||||||||||||||||||||||||||||||||||||||||||||||
| tree mix | 6.66% | 5.25% | 0.004 | 1.287 | 1.085-1.527 | ||||||||||||||||||||||||||||||||||||||||||||||||||||||||||||||||||||||||||||||||||||||||||||||
| mite mix** | 6.39% | 4.90% | 0.002 | 1.326 | 1.113-1.580 | ||||||||||||||||||||||||||||||||||||||||||||||||||||||||||||||||||||||||||||||||||||||||||||||
| house dust | 5.74% | 4.82% | 0.045 | 1.202 | 1.004-1.440 | ||||||||||||||||||||||||||||||||||||||||||||||||||||||||||||||||||||||||||||||||||||||||||||||
| mold mix | 6.10% | 4.77% | 0.004 | 1.298 | 1.086-1.551 | ||||||||||||||||||||||||||||||||||||||||||||||||||||||||||||||||||||||||||||||||||||||||||||||
| at least one aeroallergen** | 39.64% | 33.89% | 6.7497E-09 | 1.281 | 1.178-1.393 | ||||||||||||||||||||||||||||||||||||||||||||||||||||||||||||||||||||||||||||||||||||||||||||||
| **p < 0.0025 was considered statically significant. | |||||||||||||||||||||||||||||||||||||||||||||||||||||||||||||||||||||||||||||||||||||||||||||||||||
| OR: odds ratio. | |||||||||||||||||||||||||||||||||||||||||||||||||||||||||||||||||||||||||||||||||||||||||||||||||||
The positive rates of egg, peanut, cow's milk, fish mix and cat hair, cockroach, mold mix, H. japonicus, mite mix, house dust vary with the season. (P<0.05; Figure 4E, 4F and Tables 2, 3).
Overall allergen distribution characteristics in the four cities
Of the 55,432 participants, 24,289 (48.32%) were sensitive to at least one of the tested allergens. The most prevalent allergens were mite mix (10,985, 19.82%), followed by cockroach (4,860, 8.77%), crab (4,450, 8.03%), fish mix (3,874, 6.99%), house dust (3,486, 6.29%), and soybean (3,028, 5.46%; Figure 5A).
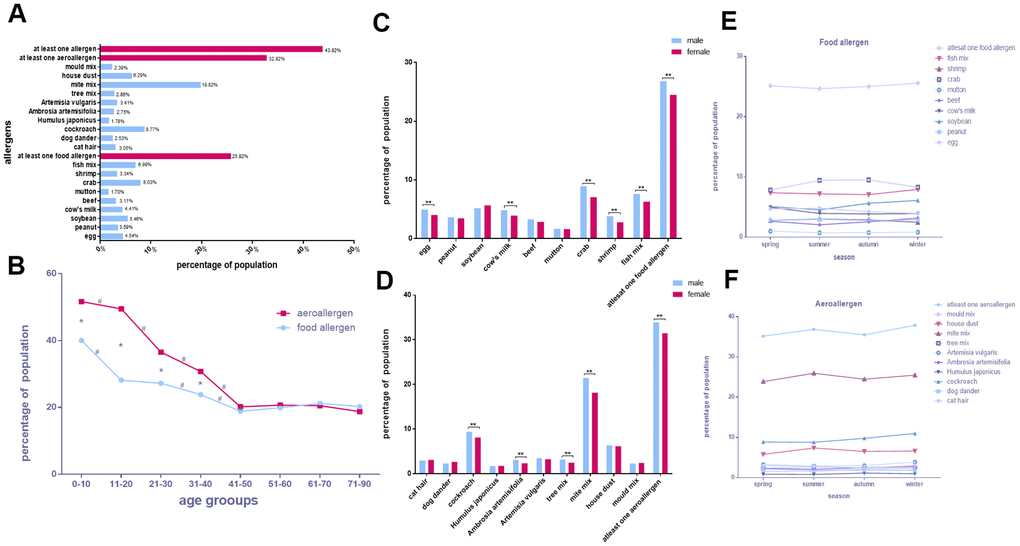
Figure 5. Overall allergen distribution characteristics in the four cities. (A) The positive rates of various allergens. (B) Food allergen and aeroallergen positive rates in different age groups. (C, D) Comparison of allergen positive rates in sex. (E, F) Discrepancies of allergens with seasons.
General decreasing trends with age were noted in the sensitivity to food allergens and aeroallergens. Significant differences were noted between the 0–10, 11–20, 21–30, 31–40, and 41–50 age groups in aeroallergens (p < 0.05; Figure 5B). Furthermore, we found that the positive rate of sensitivity to aeroallergens was higher than for food allergens in the low and middle age groups (0–10, 11–20, 21–30, 31–40, and 41–50). The positive rates of each allergen in all age groups in all the participants are showed in Supplementary Figure 5A–5F.
The distributions of five food allergens [egg (OR, 1.235; 95% CI, 1.139–1.338), cow’s milk (OR, 1.249; 95% CI, 1.151–1.356), crab (OR, 1.286; 95% CI, 1.210–1.368), shrimp (OR, 1.377; 95% CI, 1.254–1.513), and fish mix (OR, 1.216; 95% CI, 1.139–1.299); p < 0.0025 for all] and four aeroallergens [cockroach (OR, 1.177; 95% CI, 1.110–1.249), A. artemisifolia (OR, 1.320; 95% CI, 1.191–1.464), tree mix (OR, 1.297; 95% CI, 1.172–1.435), and mite mix (OR, 1.229; 95% CI, 1.179–1.282); p < 0.0025 for all] were significantly higher in males than females. Other allergens had similar rates in both sexes (p > 0.0025 for all; (Figure 5C, 5D and Table 7).
Table 7. Difference of distribution of allergens between male and female participants overall these four cities.
| Allergens | Male | Female | P | OR | 95%CI | ||||||||||||||||||||||||||||||||||||||||||||||||||||||||||||||||||||||||||||||||||||||||||||||
| Egg** | 4.97% | 4.06% | 2.83E-07 | 1.235 | 1.139-1.338 | ||||||||||||||||||||||||||||||||||||||||||||||||||||||||||||||||||||||||||||||||||||||||||||||
| peanut | 3.66% | 3.47% | 0.243 | 1.055 | 0.964-1.154 | ||||||||||||||||||||||||||||||||||||||||||||||||||||||||||||||||||||||||||||||||||||||||||||||
| soybean | 5.20% | 5.67% | 0.014 | 0.912 | 0.848-0.982 | ||||||||||||||||||||||||||||||||||||||||||||||||||||||||||||||||||||||||||||||||||||||||||||||
| cow's milk** | 4.86% | 3.93% | 8.65E-08 | 1.249 | 1.151-1.356 | ||||||||||||||||||||||||||||||||||||||||||||||||||||||||||||||||||||||||||||||||||||||||||||||
| beef | 3.30% | 2.88% | 0.004054 | 1.152 | 1.046-1.268 | ||||||||||||||||||||||||||||||||||||||||||||||||||||||||||||||||||||||||||||||||||||||||||||||
| mutton | 1.69% | 1.64% | 0.636 | 1.032 | 0.906-1.175 | ||||||||||||||||||||||||||||||||||||||||||||||||||||||||||||||||||||||||||||||||||||||||||||||
| Crab** | 8.94% | 7.09% | 1.04E-15 | 1.286 | 1.210-1.368 | ||||||||||||||||||||||||||||||||||||||||||||||||||||||||||||||||||||||||||||||||||||||||||||||
| Shrimp** | 3.83% | 2.81% | 2.03E-11 | 1.377 | 1.254-1.513 | ||||||||||||||||||||||||||||||||||||||||||||||||||||||||||||||||||||||||||||||||||||||||||||||
| fish mix** | 7.61% | 6.34% | 4.74E-09 | 1.216 | 1.139-1.299 | ||||||||||||||||||||||||||||||||||||||||||||||||||||||||||||||||||||||||||||||||||||||||||||||
| at least one food allergen** | 26.83% | 24.49% | 3.0575E-10 | 1.130 | 1.088-1.174 | ||||||||||||||||||||||||||||||||||||||||||||||||||||||||||||||||||||||||||||||||||||||||||||||
| cat hair | 2.97% | 3.10% | 0.343 | 0.954 | 0.866-1.051 | ||||||||||||||||||||||||||||||||||||||||||||||||||||||||||||||||||||||||||||||||||||||||||||||
| dog dander | 2.31% | 2.68% | 0.005 | 0.859 | 0.772-0.956 | ||||||||||||||||||||||||||||||||||||||||||||||||||||||||||||||||||||||||||||||||||||||||||||||
| Cockroach** | 9.41% | 8.11% | 5.75E-08 | 1.177 | 1.110-1.249 | ||||||||||||||||||||||||||||||||||||||||||||||||||||||||||||||||||||||||||||||||||||||||||||||
| H. japonicus | 1.73% | 1.77% | 0.766 | 0.981 | 0.864-1.114 | ||||||||||||||||||||||||||||||||||||||||||||||||||||||||||||||||||||||||||||||||||||||||||||||
| A. artemisifolia** | 3.11% | 2.37% | 1.09E-07 | 1.320 | 1.191-1.464 | ||||||||||||||||||||||||||||||||||||||||||||||||||||||||||||||||||||||||||||||||||||||||||||||
| A. vulgaris | 3.53% | 3.26% | 0.075 | 1.087 | 0.992-1.192 | ||||||||||||||||||||||||||||||||||||||||||||||||||||||||||||||||||||||||||||||||||||||||||||||
| tree mix** | 3.19% | 2.48% | 4.2185E-07 | 1.297 | 1.172-1.435 | ||||||||||||||||||||||||||||||||||||||||||||||||||||||||||||||||||||||||||||||||||||||||||||||
| mite mix** | 21.46% | 18.19% | 4.08E-22 | 1.229 | 1.179-1.282 | ||||||||||||||||||||||||||||||||||||||||||||||||||||||||||||||||||||||||||||||||||||||||||||||
| house dust | 6.36% | 6.18% | 0.374 | 1.032 | 0.963-1.105 | ||||||||||||||||||||||||||||||||||||||||||||||||||||||||||||||||||||||||||||||||||||||||||||||
| mold mix | 2.31% | 2.42% | 0.396 | 0.954 | 0.855-1.064 | ||||||||||||||||||||||||||||||||||||||||||||||||||||||||||||||||||||||||||||||||||||||||||||||
| at least one aeroallergen** | 33.90% | 31.46% | 9.45E-10 | 1.117 | 1.078-1.158 | ||||||||||||||||||||||||||||||||||||||||||||||||||||||||||||||||||||||||||||||||||||||||||||||
| **p < 0.0025 was considered statically significant. | |||||||||||||||||||||||||||||||||||||||||||||||||||||||||||||||||||||||||||||||||||||||||||||||||||
| OR: odds ratio. | |||||||||||||||||||||||||||||||||||||||||||||||||||||||||||||||||||||||||||||||||||||||||||||||||||
Regardless of the season, the top five allergens among all study participants were mite mix, cockroach, crab, fish mix, and house dust. The single allergens cow's milk kept the highest positive rate in spring. Egg, mite mix and house dust maintained the highest positive rates in the summer, while soybean, beef, cat hair, A. artemisifolia, A. vulgaris, cockroach and mold mix showed the highest positive rates in the winter. Moreover, sensitivity to crabs and H. japonicus surged in the autumn (p < 0.05; Figure 5E, 5F and Tables 2, 3).
Comparison of allergen positive rates between the four cities
Our extensive data confirmed that the proportion of allergies to all allergen types differed significantly between the four cities. The positive rate for egg and soybean allergens were highest in Liuzhou, followed by Shenzhen, Chongqing, and Chengdu (p < 0.0083), based on χ2 tests with Bonferroni correction for multiple comparisons. The positive rates of crab and fish mix were the highest in Liuzhou and similar among the other three cities (p > 0.0083; Figure 6A and Table 8).
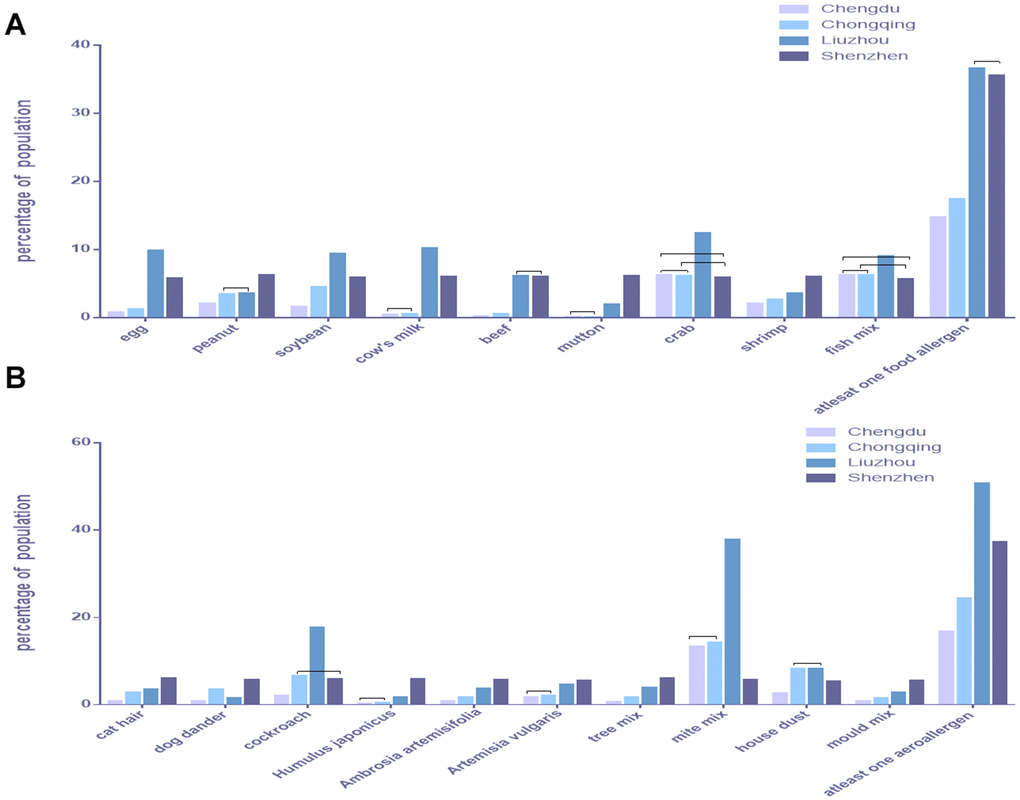
Figure 6. Comparison of allergen positive rates between the four cities. (A) Food allergens. (B) Aeroallergens.
Table 8. Differences of distribution of allergens between these four southern cities in China.
| Allergens | Overall P | Chengdu V Chongqing | Chengdu V Liuzhou | Chongqing V Liuzhou | Chengdu V Shenzhen | Chongqing V Shenzhen | Liuzhou V Shenzhen | ||||||||||||||||||||||||||||||||||||||||||||||||||||||||||||||||||||||||||||||||||||||||||||
| egg | 0.00E+00 | 0.000099 | 6.05E-260 | 2.35E-236 | 6.48E-121 | 1.37E-95 | 8.04E-30 | ||||||||||||||||||||||||||||||||||||||||||||||||||||||||||||||||||||||||||||||||||||||||||||
| peanut | 1.54E-62 | 7.74E-14 | 4.97E-17 | 0.458 | 5.68E-63 | 8.45E-24 | 1.13E-22 | ||||||||||||||||||||||||||||||||||||||||||||||||||||||||||||||||||||||||||||||||||||||||||||
| soybean | 1.99E-207 | 6.26E-48 | 4.99E-190 | 1.77E-64 | 7.98E-75 | 0.000002 | 3.38E-24 | ||||||||||||||||||||||||||||||||||||||||||||||||||||||||||||||||||||||||||||||||||||||||||||
| cow's milk | 0.00E+00 | 0.036 | 4.63E-299 | 8.92E-297 | 6.11E-155 | 3.14E-146 | 6.56E-31 | ||||||||||||||||||||||||||||||||||||||||||||||||||||||||||||||||||||||||||||||||||||||||||||
| beef | 0.00E+00 | 1.27E-09 | 7.98E-187 | 6.91E-161 | 1.10E-176 | 3.16E-145 | 0.517 | ||||||||||||||||||||||||||||||||||||||||||||||||||||||||||||||||||||||||||||||||||||||||||||
| mutton | 0.00E+00 | 0.7 | 1.51E-57 | 7.94E-59 | 1.60E-187 | 9.71E-194 | 1.04E-71 | ||||||||||||||||||||||||||||||||||||||||||||||||||||||||||||||||||||||||||||||||||||||||||||
| crab | 3.54E-137 | 0.574 | 3.11E-74 | 9.11E-81 | 0.19 | 0.413 | 3.91E-65 | ||||||||||||||||||||||||||||||||||||||||||||||||||||||||||||||||||||||||||||||||||||||||||||
| shrimp | 5.75E-66 | 0.002604 | 6.84E-14 | 0.000006 | 4.68E-56 | 5.57E-40 | 6.86E-22 | ||||||||||||||||||||||||||||||||||||||||||||||||||||||||||||||||||||||||||||||||||||||||||||
| fish mix | 7.56E-35 | 0.771 | 5.78E-21 | 3.04E-20 | 0.116 | 0.065 | 1.39E-22 | ||||||||||||||||||||||||||||||||||||||||||||||||||||||||||||||||||||||||||||||||||||||||||||
| at least one food allergen | 0.00E+00 | 8.14E-10 | 0.00E+00 | 0.00E+00 | 1.39E-304 | 9.84E-227 | 0.078 | ||||||||||||||||||||||||||||||||||||||||||||||||||||||||||||||||||||||||||||||||||||||||||||
| cat hair | 7.30E-112 | 1.09E-30 | 1.57E-51 | 0.000096 | 3.06E-114 | 3.72E-37 | 3.88E-22 | ||||||||||||||||||||||||||||||||||||||||||||||||||||||||||||||||||||||||||||||||||||||||||||
| dog dander | 7.45E-150 | 2.33E-59 | 3.81E-09 | 9.02E-34 | 1.62E-113 | 7.61E-15 | 9.46E-84 | ||||||||||||||||||||||||||||||||||||||||||||||||||||||||||||||||||||||||||||||||||||||||||||
| cockroach | 0.00E+00 | 3.76E-76 | 0.00E+00 | 5.06E-196 | 6.40E-55 | 0.074 | 4.25E-159 | ||||||||||||||||||||||||||||||||||||||||||||||||||||||||||||||||||||||||||||||||||||||||||||
| H. japonicus | 2.52E-275 | 0.065 | 1.41E-32 | 2.39E-26 | 3.82E-156 | 1.46E-149 | 1.61E-77 | ||||||||||||||||||||||||||||||||||||||||||||||||||||||||||||||||||||||||||||||||||||||||||||
| A. artemisifolia | 8.52E-144 | 5.51E-12 | 2.04E-65 | 1.81E-29 | 3.72E-118 | 9.80E-71 | 1.93E-15 | ||||||||||||||||||||||||||||||||||||||||||||||||||||||||||||||||||||||||||||||||||||||||||||
| A. vulgaris | 3.55E-89 | 0.105 | 2.72E-44 | 1.09E-36 | 2.10E-57 | 4.44E-49 | 0.000763 | ||||||||||||||||||||||||||||||||||||||||||||||||||||||||||||||||||||||||||||||||||||||||||||
| tree mix | 2.27E-158 | 4.23E-14 | 3.20E-75 | 8.86E-34 | 9.06E-130 | 3.96E-76 | 4.41E-15 | ||||||||||||||||||||||||||||||||||||||||||||||||||||||||||||||||||||||||||||||||||||||||||||
| mite mix | 0.00E+00 | 0.045 | 0.00E+00 | 0.00E+00 | 3.21E-83 | 3.96E-98 | 0.00E+00 | ||||||||||||||||||||||||||||||||||||||||||||||||||||||||||||||||||||||||||||||||||||||||||||
| house dust | 3.60E-120 | 7.78E-102 | 4.88E-103 | 0.751 | 2.91E-29 | 2.01E-18 | 3.22E-18 | ||||||||||||||||||||||||||||||||||||||||||||||||||||||||||||||||||||||||||||||||||||||||||||
| mold mix | 6.02E-131 | 0.000001 | 4.30E-35 | 1.35E-15 | 1.91E-103 | 7.95E-72 | 5.68E-30 | ||||||||||||||||||||||||||||||||||||||||||||||||||||||||||||||||||||||||||||||||||||||||||||
| at least one aeroallergen | 0.00E+00 | 1.04E-57 | 0.00E+00 | 0.00E+00 | 1.02E-280 | 7.89E-103 | 2.04E-98 | ||||||||||||||||||||||||||||||||||||||||||||||||||||||||||||||||||||||||||||||||||||||||||||
| p<0.0083 (0.05/6) was considered statically significant. | |||||||||||||||||||||||||||||||||||||||||||||||||||||||||||||||||||||||||||||||||||||||||||||||||||
| We used Bonferroni method to correct the significant levels in a pairwise comparison of multiple samples. | |||||||||||||||||||||||||||||||||||||||||||||||||||||||||||||||||||||||||||||||||||||||||||||||||||
The positive rates of cat hair, A. artemisifolia, tree mix, and mold mix were the highest in Shenzhen, followed by Liuzhou, Chongqing, and Chengdu (p < 0.0083). The positive rate of mite mix was the highest in Liuzhou, the lowest in Shenzhen, and similar in Chongqing and Chengdu (p > 0.0083). The positive rate of house dust was the highest in Liuzhou and Chongqing with no difference between them (p > 0.0083), followed by Shenzhen and Chengdu (Figure 6B and Table 8).
Discussion
We found the top five allergens in our study were mite mix, cockroach, crab, fish mix and house dust, these findings agree with an epidemiological survey in southern China that found house dust mite (28.1%) and cockroach (24.3%) to be the most important inhalant allergens, while the most important food allergen was crab (15.8%) [12]. We found a low rate of allergy to cat hair and dog dander in our cohort, possibly due to the low pet ownership rate in our country. A recent multicenter study in north China reported that the highest positive rates were of A. vulgaris and A. artemisifolia [13]. Allergy to peanuts and eggs seems to be common in Northern Europe, the United States, Canada, and Australia [14]. These discrepancies could be due to differences in geographic location, climate, living environment, ethnicity and eating habits.
Almost all the general sensitization trends decreased with age, especially from infants to middle age. This could be explained by the immature development of the digestive and respiratory systems and the more active immune system at a young age. When children grow older, their gastrointestinal and respiratory tracts develop, eventually leading to lower allergy rates. Recent studies revealed that intestinal microbiology is not yet established in children aged 0–5 years and that the intestinal bacteria could affect the immune function of the gut and, in turn, affect the allergy to food [15, 16]. The digestive enzymes of infants ingesting food allergens are not well-formed or secreted, resulting in allergic symptoms. Similarly, the respiratory tract mucosa in infants is not well developed, possibly leading to the high positivity rate to aeroallergens. This phenomenon prompted people to read the food ingredient list carefully when feeding babies [17]. The recent Enquiring About Tolerance (EAT) study showed that an early food intervention was effective for allergic diseases [18]. However, the positive rate of the single allergens crabs and cockroaches was much lower in the 0–10 age group than in the 11–20 one. This difference might be due to the differences in ingested volume and contact frequency, as parents in China tend to control what and how much their children eat or contact. A smaller ingestion volume and lower contact frequency might lead to a lower allergic impact on children. Moreover, the rate of allergy to aeroallergens was always higher than to food allergens in the 0–10, 11–20, 21–30, and 31–40 age groups. We suggest that the widespread aeroallergen distribution is unavoidable, unlike food allergens.
Many inhaled or food allergens in this study showed significant sex differences, with males consistently showing higher positive rates (OR > 1, p < 0.0025). However, several studies have suggested that male children and adults have higher total and allergen-specific IgE levels than female [19, 20]. Although not all studies on IgE levels in children have observed male predominance [21, 22], the data suggest that very young males are more prone to develop IgE sensitization following allergen exposure than females [23]. The mechanism for these differences is not clear but could be attributed to genetic differences or differential sex hormone exposure in utero or postnatally [24]. Clinical studies showed a sexual dimorphism in asthma along different hormonal points of life, Shah R et al. [11] found that before puberty, asthma symptoms were higher in boys than in girls. Interestingly, although males still displayed higher IgE levels than females after puberty [25], females were either at an equal or higher risk of developing allergic diseases [26–28]. Indeed, a UK study that surveyed the presentations to medical clinics after puberty reported that females presented more often with asthma-, rhinitis-, and eczema-associated symptoms than males [29]. Together, these results suggest that IgE sensitization should be distinguished from clinical allergic diseases.
We found that the detectable rate of allergen-specific IgE differed between seasons, possibly due to the allergen exposure rate. The allergen-specific IgE for cat hair and dog dander was the highest in the spring, possibly because it is the depilation season. Mite mix, house dust had the highest positive rates in the summer due to the warm and wet climate in southern China. We attributed the surging numbers of allergies to crabs in the autumn to the Chinese mitten crab consumption during this season. The positive rate of H. japonicus-specific IgE in the autumn was higher than in the other seasons, which was consistent with the natural law of pollen propagation.
Because of their similar diet and living habits, we found no difference between Chengdu and Chongqing in the rate of IgE for single allergens such as cow’s milk, mutton, crab, fish mix, mite mix, A. vulgaris, and H. japonicus (p > 0.0083), and the top three allergens in both were mite mix, crab, and fish mix. However, the serum house dust allergen-specific IgE positive rate in Chongqing was higher than in Chengdu, possibly because Chongqing is close to the mountains.
The most common allergens in Chengdu, Chongqing, and Liuzhou were consistent with those in the entire study population (mite mix, cockroach, house dust, crab, and fish mix), but the positive rates to allergens such as egg, cow’s milk, and soybean in Liuzhou was consistently higher than the other cities (9.35–10.14%). We suggest that the cause of this is the fact that the mean age (25.55 ± 19.28 years) of the participants in Liuzhou was the lowest of the four cities, and cow’s milk and egg white sensitization prevalence in children could be as high as 41–67% [30]. Comparing all 19 allergens between the four southern cities, the proportion of positive IgE to food allergens and aeroallergens in Liuzhou was the highest, especially for cockroach and mite mix (p < 0.0083), possibly due to the hot and wet climate there. The prevalence of sensitization to mites was higher in subtropical and tropical areas where house dust mites were abundant due to the higher humidity and ambient temperature in these environments [31]. Sensitization to fish mix in Liuzhou rose again in the 61–70 and 71–90 age groups (p < 0.05), which we attribute to the chaotic inner environment in older people [32].
The similar rate in all allergens in Shenzhen (5.33–6.18%), and the lowest of the four cities, was an astonishing result. This could be explained by the fact that Shenzhen is a coastal city in southeast China. Furthermore, Shenzhen has a dry climate throughout the year but in the summer. The temperature there remains around 22.4° C throughout the year, which is not conducive to the growth of mites. Besides, Shenzhen residents are accustomed to consuming aquatic products such as crabs, shrimps, and fish, so they are less sensitive to them.
However, being positive to allergen-specific IgE does not necessarily mean being allergic to it. The cross-reactive carbohydrate determinants (CCDs), which are widespread in nature, lead to antigenic cross-reactions that could cause false positives results in the allergen test. Yang et al. [33] showed that shrimp is a common allergic food in southern China, and the higher proportion of shrimp sensitization in rural subjects could be due to cross-reactivity to cockroaches. While this is possible, we did not exclude the interference of CCDs in our study.
In summary, we found that almost all allergens peaked in young participants, the positive rates of aeroallergens were always higher than of food allergens in the young and middle age groups, and several allergens (mite mix, tree mix, cockroach, crab, shrimp, and fish mix) showed significant sex differences, with males being at a higher risk. Moreover, the prevalence of allergen variety changed with seasons and between regions, possibly due to differences in lifestyle, climate, and geomorphological features. Our research reminds us to take various factors (age, sex, season, region, ethnicity and diet habit) into account when diagnosing allergic diseases and determining the allergen type that caused them or actively preventing the impact of these allergens on susceptible populations. The study results are significant for clinical practice and public health. Although further validation and interpretation are needed, the number of samples in our multicenter study was larger than other epidemiologic surveys in China. Our findings contribute to data for evidence-based management of local allergies in China and worldwide.
Materials and Methods
Participants
We recruited 55,432 participants who underwent specific IgE tests between January 2007 and December 2019 from Chongqing (14,612, 26.36%), Chengdu (14,030, 25.31%), Liuzhou (17,217, 31.06%), and Shenzhen (9,573, 17.27%). These participants included 27,408 males (49.45%) and 28,024 females (50.55%); the mean participant age was 33.78 ± 19.10 (range, 2–90) years. The participants were divided into eight age groups to explore differences associated with age: 0–10 years (9,456, 17.06%), 11–20 years (5,450, 9.83%), 21–30 years (8,229, 14.85%), 31–40 years (10,011, 18.06%), 41–50 years (11,785, 21.26%), 51–60 years (6,058, 10.93%), 61–70 years (3,085, 5.57%), 71–90 years (1,358, 2.45%). The institutional review board and ethics committee of Sichuan University approved this study. All participants or their guardians provided written informed consent.
Blood sampling
We collected blood samples (3 mL) from all participants into BD Vacutainer blood collection tubes containing sodium heparin. All blood samples were stored at 2–8° C for a maximum of 14 days pending testing. All samples were incubated at room temperature (18–25° C) for 30 min before testing.
Allergen-specific IgE analysis
Allergen-specific IgE was tested using the EUROBlotMaster (EUROIMMUN, Luebeck, Germany) with the Euro11 Allerg EL60 and EUROLINE Atopy China (IgE) kit. We tested serum IgE specific to nine food allergens [egg, peanut, soybean, cow's milk, beef, mutton, crab, shrimp, fish mix (cod, scallop, salmon, and carp)] and ten aeroallergens [cat hair, dog dander, cockroach, H. japonicus, A. artemisifolia, A. vulgaris, tree mix (willow, poplar, and elm), mite mix (Dermatophagoides farinae and Dermatophagoides pteronyssinus), house dust, and mold mix (Penicillium notatum, Cladosporium herbarum, Aspergillus fumigatus, and Alternaria alternate)]. At least two skilled technicians in each city evaluated the test results by comparing the signal position on the incubated test strips with the printed evaluation strips. Positive bands indicated the presence of IgE for a specific antigen.
Statistical analysis
Descriptive analysis, χ2 tests, and OR assessment was performed by IBM SPSS Statistics for Windows, Version 25.0 (IBM Corp., Armonk, NY, USA). The χ2 tests analyzed differences in the distributions of allergens between groups. Differences with p < 0.05 were considered statistically significant. However, differences between male and female participants were considered statistically significant at p < 0.0025 (the p-value was reduced due to the large sample size after dividing the participants into the two sex groups). We used the Bonferroni method to correct the significance levels for multiple comparisons (p = 0.05/n). All figures were generated using GraphPad, Version 6.0(GraphPad Software Inc., San Diego, CA, USA.).
Data availability
The data and materials analyzed in this study are available from the corresponding author upon reasonable request.
Supplementary Materials
Author Contributions
Xue’an Wang was responsible for designing experiments, analyzing data and writing. Long Zhou, Guixi Wei and Hui Zhang were committed to instrument operation and data collection. Bin Yang was responsible for furnishing overall ideas.
Conflicts of Interest
The authors declare that they have no conflicts of interest.
Funding
This work was supported by the National Natural Science Foundation of China (No. 81772258) and the Science and Technology Agency of Sichuan Province (Nos. 2019YFS0310 and 2018FZ0106).
References
- 1. Sun BQ, Zheng PY, Zhang XW, Huang HM, Chen DH, Zeng GQ. Prevalence of allergen sensitization among patients with allergic diseases in Guangzhou, Southern China: a four-year observational study. Multidiscip Respir Med. 2014; 9:2. https://doi.org/10.1186/2049-6958-9-2 [PubMed]
- 2. Loftus PA, Wise SK. Epidemiology of asthma. Curr Opin Otolaryngol Head Neck Surg. 2016; 24:245–9. https://doi.org/10.1097/MOO.0000000000000262 [PubMed]
- 3. Su N, Lin J, Liu G, Chen P, Zhou X, Wan H, Yin K, Ma L, Wu C, Li J, Liu C, Xie H, Tang W, et al. [An epidemiological survey on management and insights of asthma in China in 2009 to 2010]. Zhonghua Nei Ke Za Zhi. 2015; 54:680–83. [PubMed]
- 4. Zhang L, Han D, Huang D, Wu Y, Dong Z, Xu G, Kong W, Bachert C. Prevalence of self-reported allergic rhinitis in eleven major cities in China. Int Arch Allergy Immunol. 2009; 149:47–57. https://doi.org/10.1159/000176306 [PubMed]
- 5. Xu F, Yan S, Li F, Cai M, Chai W, Wu M, Fu C, Zhao Z, Kan H, Kang K, Xu J. Prevalence of childhood atopic dermatitis: an urban and rural community-based study in Shanghai, China. PLoS One. 2012; 7:e36174. https://doi.org/10.1371/journal.pone.0036174 [PubMed]
- 6. de Marco R, Cappa V, Accordini S, Rava M, Antonicelli L, Bortolami O, Braggion M, Bugiani M, Casali L, Cazzoletti L, Cerveri I, Fois AG, Girardi P, et al, and GEIRD Study Group. Trends in the prevalence of asthma and allergic rhinitis in Italy between 1991 and 2010. Eur Respir J. 2012; 39:883–92. https://doi.org/10.1183/09031936.00061611 [PubMed]
- 7. Hansen TE, Evjenth B, Holt J. Increasing prevalence of asthma, allergic rhinoconjunctivitis and eczema among schoolchildren: three surveys during the period 1985-2008. Acta Paediatr. 2013; 102:47–52. https://doi.org/10.1111/apa.12030 [PubMed]
- 8. Scheurer S, Toda M, Vieths S. What makes an allergen? Clin Exp Allergy. 2015; 45:1150–61. https://doi.org/10.1111/cea.12571 [PubMed]
- 9. Boulet LP, Turcotte H, Laprise C, Lavertu C, Bédard PM, Lavoie A, Hébert J. Comparative degree and type of sensitization to common indoor and outdoor allergens in subjects with allergic rhinitis and/or asthma. Clin Exp Allergy. 1997; 27:52–59. [PubMed]
- 10. Katelaris CH, Beggs PJ. Climate change: allergens and allergic diseases. Intern Med J. 2018; 48:129–34. https://doi.org/10.1111/imj.13699 [PubMed]
- 11. Shah R, Newcomb DC. Sex Bias in Asthma Prevalence and Pathogenesis. Front Immunol. 2018; 9:2997. https://doi.org/10.3389/fimmu.2018.02997 [PubMed]
- 12. Luo W, Hu H, Tang W, Zou X, Huang H, Huang Z, Liu Y, Sun B. Allergen sensitization pattern of allergic adults and children in southern China: a survey based on real life data. Allergy Asthma Clin Immunol. 2019; 15:42. https://doi.org/10.1186/s13223-019-0357-y [PubMed]
- 13. Li J, Sun B, Huang Y, Lin X, Zhao D, Tan G, Wu J, Zhao H, Cao L, Zhong N, and China Alliance of Research on Respiratory Allergic Disease. A multicentre study assessing the prevalence of sensitizations in patients with asthma and/or rhinitis in China. Allergy. 2009; 64:1083–92. https://doi.org/10.1111/j.1398-9995.2009.01967.x [PubMed]
- 14. Dunlop JH, Keet CA. Epidemiology of Food Allergy. Immunol Allergy Clin North Am. 2018; 38:13–25. https://doi.org/10.1016/j.iac.2017.09.002 [PubMed]
- 15. Russell SL, Finlay BB. The impact of gut microbes in allergic diseases. Curr Opin Gastroenterol. 2012; 28:563–69. https://doi.org/10.1097/MOG.0b013e3283573017 [PubMed]
- 16. Wopereis H, Oozeer R, Knipping K, Belzer C, Knol J. The first thousand days - intestinal microbiology of early life: establishing a symbiosis. Pediatr Allergy Immunol. 2014; 25:428–38. https://doi.org/10.1111/pai.12232 [PubMed]
- 17. Leoni C, Volpicella M, Dileo M, Gattulli BA, Ceci LR. Chitinases as Food Allergens. Molecules. 2019; 24:2087. https://doi.org/10.3390/molecules24112087 [PubMed]
- 18. Perkin MR, Logan K, Bahnson HT, Marrs T, Radulovic S, Craven J, Flohr C, Mills EN, Versteeg SA, van Ree R, Lack G, and Enquiring About Tolerance (EAT) study team. Efficacy of the Enquiring About Tolerance (EAT) study among infants at high risk of developing food allergy. J Allergy Clin Immunol. 2019; 144:1606–14.e2. https://doi.org/10.1016/j.jaci.2019.06.045 [PubMed]
- 19. Salo PM, Arbes SJ
Jr , Jaramillo R, Calatroni A, Weir CH, Sever ML, Hoppin JA, Rose KM, Liu AH, Gergen PJ, Mitchell HE, Zeldin DC. Prevalence of allergic sensitization in the United States: results from the National Health and Nutrition Examination Survey (NHANES) 2005-2006. J Allergy Clin Immunol. 2014; 134:350–59. https://doi.org/10.1016/j.jaci.2013.12.1071 [PubMed] - 20. Park HJ, Kim EJ, Yoon D, Lee JK, Chang WS, Lim YM, Park JW, Lee JS. Prevalence of Self-reported Allergic Diseases and IgE Levels: A 2010 KNHANES Analysis. Allergy Asthma Immunol Res. 2017; 9:329–39. https://doi.org/10.4168/aair.2017.9.4.329 [PubMed]
- 21. Sears MR, Burrows B, Flannery EM, Herbison GP, Hewitt CJ, Holdaway MD. Relation between airway responsiveness and serum IgE in children with asthma and in apparently normal children. N Engl J Med. 1991; 325:1067–71. https://doi.org/10.1056/NEJM199110103251504 [PubMed]
- 22. Daniluk U, Alifier M, Kaczmarski M, Stasiak-Barmuta A, Lebensztejn D. Longitudinal observation of children with enhanced total serum IgE. Ann Allergy Asthma Immunol. 2015; 114:404–10.e4. https://doi.org/10.1016/j.anai.2015.02.004 [PubMed]
- 23. Uekert SJ, Akan G, Evans MD, Li Z, Roberg K, Tisler C, Dasilva D, Anderson E, Gangnon R, Allen DB, Gern JE, Lemanske RF
Jr . Sex-related differences in immune development and the expression of atopy in early childhood. J Allergy Clin Immunol. 2006; 118:1375–81. https://doi.org/10.1016/j.jaci.2006.09.008 [PubMed] - 24. Leffler J, Stumbles PA, Strickland DH. Immunological Processes Driving IgE Sensitisation and Disease Development in Males and Females. Int J Mol Sci. 2018; 19:1554. https://doi.org/10.3390/ijms19061554 [PubMed]
- 25. Paula Couto TA, Falsarella N, Mattos Cde C, Mattos LC. Total IgE plasma levels vary according to gender and age in Brazilian patients with allergic rhinitis. Clinics (Sao Paulo). 2014; 69:740–44. https://doi.org/10.6061/clinics/2014(11)06 [PubMed]
- 26. Salo PM, Calatroni A, Gergen PJ, Hoppin JA, Sever ML, Jaramillo R, Arbes SJ
Jr , Zeldin DC. Allergy-related outcomes in relation to serum IgE: results from the National Health and Nutrition Examination Survey 2005-2006. J Allergy Clin Immunol. 2011; 127:1226–35.e7. https://doi.org/10.1016/j.jaci.2010.12.1106 [PubMed] - 27. Von Linstow ML, Porsbjerg C, Ulrik CS, Nepper-Christensen S, Backer V. Prevalence and predictors of atopy among young Danish adults. Clin Exp Allergy. 2002; 32:520–25. https://doi.org/10.1046/j.0954-7894.2002.01326.x [PubMed]
- 28. Fröhlich M, Pinart M, Keller T, Reich A, Cabieses B, Hohmann C, Postma DS, Bousquet J, Antó JM, Keil T, Roll S. Is there a sex-shift in prevalence of allergic rhinitis and comorbid asthma from childhood to adulthood? A meta-analysis. Clin Transl Allergy. 2017; 7:44. https://doi.org/10.1186/s13601-017-0176-5 [PubMed]
- 29. Osman M, Hansell AL, Simpson CR, Hollowell J, Helms PJ. Gender-specific presentations for asthma, allergic rhinitis and eczema in primary care. Prim Care Respir J. 2007; 16:28–35. https://doi.org/10.3132/pcrj.2007.00006 [PubMed]
- 30. Hill DJ, Bannister DG, Hosking CS, Kemp AS. Cow milk allergy within the spectrum of atopic disorders. Clin Exp Allergy. 1994; 24:1137–43. https://doi.org/10.1111/j.1365-2222.1994.tb03319.x [PubMed]
- 31. Arlian LG, Platts-Mills TA. The biology of dust mites and the remediation of mite allergens in allergic disease. J Allergy Clin Immunol. 2001; 107:S406–13. https://doi.org/10.1067/mai.2001.113670 [PubMed]
- 32. Huang Z, Feng W, Wei W, Yang B, Wang L. Prevalence of food-allergen and aeroallergen sensitization among people in Sichuan, Western China: An 8-year observational study. J Clin Lab Anal. 2019; 33:e22723. https://doi.org/10.1002/jcla.22723 [PubMed]
- 33. Yang Z, Zhao J, Wei N, Feng M, Xian M, Shi X, Zheng Z, Su Q, Wong GW, Li J. Cockroach is a major cross-reactive allergen source in shrimp-sensitized rural children in southern China. Allergy. 2018; 73:585–92. https://doi.org/10.1111/all.13341 [PubMed]