


Introduction
Much of our efforts in primary care are to identify health risks and to reduce their health impact. Thus, understanding, quantifying, and managing health risks have become one of the most important activities in clinical settings, particularly effective communication of these risks to the lay person. Currently, “relative risk” has been the most commonly used expression. The size of relative risks reported in different studies was perceived as the degree of harmfulness. Relative risk, a ratio-based measure, is not only difficult for the public to understand, but also cannot be directly compared with other relative risks, or with different reference groups. In contrast, life expectancy, derived from collapsing age-specific mortality, is an absolute risk with implications well understood to most people. Life expectancy is the average number of years a cohort of people is expected to live, which has intuitive meaning and can be compared [1, 2]. Prolonging one’s life is an overarching goal of the public health community [3] Overcoming the loss of life expectancy, on the other hand, is a clinical goal shared by everyone. Loss of life expectancy in years can be a universal yardstick across different disciplines in clinical practice, reflecting the severity of a given risk. Nevertheless, life expectancy has not been extensively used in cohort studies, and its potential has not been fully recognized, mainly because its calculation requires a large cohort with an extended follow-up time yielding stable results with a sufficient number of deaths in each age group [4–8].
In contrast to methods adopted by the Global Burden of Disease Study [9], or the study of potential years of life loss (PYLL) at a population level [10], results possibly are relevant for individuals in their daily life have been limited. Priorities based on global or societal issues are important but different, and not perceived by individuals as motivating behavioral changes. The literature seldom applies PYLL to quantify the impact of risk factors at a personal level. In addition, identified morbidities in the population are not necessarily the same as causes of death, as registered. As the reduction of health risks to extend life expectancy is among the most important clinical and public health goals, the loss of life expectancy is easy to understand and intuitively memorable. More importantly, direct comparison between risks is commonly done using life expectancy.
In this study, 30 health risks were identified from a standard medical screening program on half a million participants consecutively recruited between 1994 and 2008 in Taiwan. These risks represented common behavioral risk factors and medically screened risks. The objective of this study is to quantify the negative impact of each of these health risks on life expectancy. Loss of life expectancy was the difference in life expectancy between those with the risk and those without the risk. Years of life lost for individuals with two or three risks were also assessed against those without either one of the risks.
Results
The study population consisted of 543,410 adults, including 48% men and 52% women, with an average follow-up of 8.1 years. A total of 18,747 deaths were identified. Approximately a third of the study population was middle-aged (40-59 years) at the beginning of follow-up. The elderly (60 years and older) accounted for 13% of the cohort but over 60% of the deaths (Table 1). The magnitude and pattern of hazard ratios between univariate and multivariate were largely similar for each of the 30 risks. (Supplementary Table 1).
Table 1. Distribution of cohort by age, gender, and age of deaths.
| Age (years) | Men | Women | Total | |||||
| N | % | N | % | N | % | |||
| Participants | ||||||||
| 20-39 | 142,867 | 55.2% | 153,168 | 53.8% | 296,035 | 54.5% | ||
| 40-59 | 80,565 | 31.1% | 95,830 | 33.7% | 176,395 | 32.5% | ||
| ≥ 60 | 35,351 | 13.7% | 35,629 | 12.5% | 70,980 | 13.1% | ||
| Total | 258,783 | 100.0% | 284,627 | 100.0% | 543,410 | 100.0% | ||
| Follow-up person-year | 2,048,262 | 2,326,632 | 4,374,895 | |||||
| Deaths | ||||||||
| 20-39 | 987 | 8.7% | 599 | 8.0% | 1,586 | 8.5% | ||
| 40-59 | 3,134 | 27.8% | 2,270 | 30.5% | 5,404 | 28.8% | ||
| ≥ 60 | 7,171 | 63.5% | 4,586 | 61.5% | 11,757 | 62.7% | ||
| Total | 11,292 | 100.0% | 7,455 | 100.0% | 18,747 | 100.0% | ||
The top 20 of 30 risks were associated with a loss of 4 or more years of life expectancy (Table 2 and Figure 1). Six of the top 10 risks were identical between men and women with at least 6 years of life lost, and three were found to have 9 years of life shortened: high heart rate, proteinuria, and diabetes. Ninety-one percent of the cohort had at least one risk that shortened life by 4 or more years, 68% had two, and 41% had three or more (Supplementary Table 2).
Table 2. Prevalence and years of life lost by risk factors in men (left panel) and in women (right panel).
| Risk factor | Prevalence | HR1 | Years of life lost2 | Risk factor | Prevalence | HR1 | Years of life lost2 | ||||||||||||||||||||||||||||||||||||||||||||||||||||||||||||||||||||||||||||||||||||||||||||
| Year | 95% CI | Year | 95% CI | ||||||||||||||||||||||||||||||||||||||||||||||||||||||||||||||||||||||||||||||||||||||||||||||||
| High heart rate (≥ 90 beats/min) | 6.4% | 2.16 | 9.94 | 9.58 | - | 10.3 | Proteinuria (Trace or Positive) | 7.1% | 2.44 | 10.14 | 9.93 | - | 10.35 | ||||||||||||||||||||||||||||||||||||||||||||||||||||||||||||||||||||||||||||||||||||||
| Proteinuria (Trace or Positive) | 7.9% | 2.11 | 9.07 | 8.87 | - | 9.27 | Diabetes (≥ 126 mg/dL) | 4.8% | 2.4 | 8.91 | 8.65 | - | 9.17 | ||||||||||||||||||||||||||||||||||||||||||||||||||||||||||||||||||||||||||||||||||||||
| Diabetes (≥ 126 mg/dL) | 5.7% | 2.02 | 8.92 | 8.71 | - | 9.13 | High heart rate (≥ 90 beats/min) | 8.1% | 2 | 8.89 | 8.49 | - | 9.29 | ||||||||||||||||||||||||||||||||||||||||||||||||||||||||||||||||||||||||||||||||||||||
| Elevated WBC (≥ 9,000/mm3) | 9.0% | 1.82 | 7.49 | 7.11 | - | 7.87 | Low GFR (< 60 ml/min/1.73 m2) | 4.3% | 1.78 | 7.32 | 7.1 | - | 7.54 | ||||||||||||||||||||||||||||||||||||||||||||||||||||||||||||||||||||||||||||||||||||||
| Mild anemia (Hemoglobin 10 - 13.4 g/dL) | 5.3% | 1.56 | 7.47 | 7.24 | - | 7.7 | Current smoker | 6.7% | 1.79 | 7.02 | 6.69 | - | 7.35 | ||||||||||||||||||||||||||||||||||||||||||||||||||||||||||||||||||||||||||||||||||||||
| C-reactive protein (≥ 3 mg/L) | 11.1% | 1.84 | 7.37 | 7.11 | - | 7.63 | Elevated WBC (≥ 9,000/mm3) | 5.7% | 1.9 | 6.63 | 6.32 | - | 6.94 | ||||||||||||||||||||||||||||||||||||||||||||||||||||||||||||||||||||||||||||||||||||||
| Underweight (BMI <19 kg/m2) | 6.3% | 1.57 | 7.04 | 6.58 | - | 7.5 | Regular drinker | 2.4% | 1.77 | 6.35 | 6.05 | - | 6.65 | ||||||||||||||||||||||||||||||||||||||||||||||||||||||||||||||||||||||||||||||||||||||
| Regular drinker | 12.1% | 1.79 | 6.86 | 6.58 | - | 7.14 | COPD | 6.3% | 1.45 | 6.01 | 5.76 | - | 6.26 | ||||||||||||||||||||||||||||||||||||||||||||||||||||||||||||||||||||||||||||||||||||||
| COPD | 7.3% | 1.59 | 6.04 | 5.75 | - | 6.33 | Long-duration sleep (> 8 h/day) | 10.9% | 1.44 | 5.34 | 5.02 | - | 5.66 | ||||||||||||||||||||||||||||||||||||||||||||||||||||||||||||||||||||||||||||||||||||||
| Betel quid chewer | 18.8% | 1.82 | 6.00 | 5.66 | - | 6.34 | Hypertension (DBP ≥ 90 mmHg) | 17.6% | 1.48 | 5.21 | 4.89 | - | 5.53 | ||||||||||||||||||||||||||||||||||||||||||||||||||||||||||||||||||||||||||||||||||||||
| Current smoker | 40.6% | 1.69 | 5.66 | 5.35 | - | 5.97 | Hypertension (SBP ≥ 140 mmHg) | 16.4% | 1.45 | 5.18 | 4.55 | - | 5.81 | ||||||||||||||||||||||||||||||||||||||||||||||||||||||||||||||||||||||||||||||||||||||
| Restrictive lung disease | 14.6% | 1.55 | 5.47 | 5.19 | - | 5.75 | Physical inactivity (<3.75 MET-h/wk) | 59.9% | 1.36 | 5.07 | 4.8 | - | 5.34 | ||||||||||||||||||||||||||||||||||||||||||||||||||||||||||||||||||||||||||||||||||||||
| Long-duration sleep (> 8 h/day) | 8.9% | 1.43 | 5.04 | 4.75 | - | 5.33 | Mild anemia (hemoglobin 10 - 12 g/dL) | 10.2% | 1.52 | 4.89 | 4.67 | - | 5.11 | ||||||||||||||||||||||||||||||||||||||||||||||||||||||||||||||||||||||||||||||||||||||
| Physical inactivity (<3.75 MET-h/wk) | 48.4% | 1.55 | 4.74 | 4.45 | - | 5.03 | C-reactive protein (≥ 3 mg/L) | 10.5% | 1.59 | 4.86 | 4.6 | - | 5.12 | ||||||||||||||||||||||||||||||||||||||||||||||||||||||||||||||||||||||||||||||||||||||
| Hepatitis B carrier | 17.4% | 1.55 | 4.4 | 4.1 | - | 4.7 | Restrictive lung disease | 18.1% | 1.45 | 4.79 | 4.54 | - | 5.04 | ||||||||||||||||||||||||||||||||||||||||||||||||||||||||||||||||||||||||||||||||||||||
| Hypertension (SBP ≥ 140 mmHg) | 19.1% | 1.48 | 4.39 | 4.06 | - | 4.72 | Low cholesterol (<160 mg/dL) | 20.0% | 1.6 | 4.66 | 4.21 | - | 5.11 | ||||||||||||||||||||||||||||||||||||||||||||||||||||||||||||||||||||||||||||||||||||||
| Hypertension (DBP ≥ 90 mmHg) | 22.0% | 1.4 | 4.29 | 4.03 | - | 4.55 | Underweight (BMI <18.5 kg/m2) | 12.0% | 1.46 | 4.25 | 3.53 | - | 4.97 | ||||||||||||||||||||||||||||||||||||||||||||||||||||||||||||||||||||||||||||||||||||||
| Low cholesterol (<160 mg/dL) | 17.0% | 1.39 | 4.06 | 3.68 | - | 4.44 | Low HDL-C (<35 mg/dL) | 5.4% | 1.4 | 4.25 | 4 | - | 4.5 | ||||||||||||||||||||||||||||||||||||||||||||||||||||||||||||||||||||||||||||||||||||||
| Obesity (BMI ≥ 30 kg/m2) | 4.3% | 1.53 | 3.77 | 3.3 | - | 4.24 | High uric acid (≥ 7 mg/dL) | 8.5% | 1.39 | 4.11 | 3.8 | - | 4.42 | ||||||||||||||||||||||||||||||||||||||||||||||||||||||||||||||||||||||||||||||||||||||
| Low GFR (< 60 ml/min/1.73 m2) | 6.0% | 1.36 | 3.67 | 3.47 | - | 3.87 | Elevated AST (≥ 25 U/L) | 17.8% | 1.48 | 3.71 | 3.5 | - | 3.92 | ||||||||||||||||||||||||||||||||||||||||||||||||||||||||||||||||||||||||||||||||||||||
| Elevated AST (≥ 25 U/L) | 35.9% | 1.48 | 3.38 | 3.16 | - | 3.6 | High triglyceride (≥ 200 mg/dL) | 6.4% | 1.43 | 3.43 | 3.15 | - | 3.71 | ||||||||||||||||||||||||||||||||||||||||||||||||||||||||||||||||||||||||||||||||||||||
| Low blood glucose (< 90 mg/dL) | 17.5% | 1.31 | 3.32 | 3.06 | - | 3.58 | Metabolic Syndrome (ATP III) | 10.2% | 1.43 | 3.16 | 2.98 | - | 3.34 | ||||||||||||||||||||||||||||||||||||||||||||||||||||||||||||||||||||||||||||||||||||||
| High uric acid (≥ 8 mg/dL) | 21.1% | 1.23 | 2.64 | 2.3 | - | 2.98 | Prolonged sitting (>8 hours/day) | 61.9% | 1.21 | 2.92 | 2.60 | - | 3.25 | ||||||||||||||||||||||||||||||||||||||||||||||||||||||||||||||||||||||||||||||||||||||
| Low HDL-C (<35 mg/dL) | 16.5% | 1.25 | 2.52 | 2.26 | - | 2.78 | Obesity (BMI ≥ 30 kg/m2) | 3.6% | 1.41 | 2.61 | 2.21 | - | 3.01 | ||||||||||||||||||||||||||||||||||||||||||||||||||||||||||||||||||||||||||||||||||||||
| High triglyceride (≥ 200 mg/dL) | 15.7% | 1.21 | 2.51 | 2.24 | - | 2.78 | Hepatitis B carrier | 12.4% | 1.35 | 2.17 | 1.86 | - | 2.48 | ||||||||||||||||||||||||||||||||||||||||||||||||||||||||||||||||||||||||||||||||||||||
| Prolonged sitting (>8 hours/day) | 55.8% | 1.23 | 2.37 | 2.06 | - | 2.68 | Pre-diabetes (110 - 125 mg/dL) | 4.5% | 1.13 | 1.11 | 0.85 | - | 1.37 | ||||||||||||||||||||||||||||||||||||||||||||||||||||||||||||||||||||||||||||||||||||||
| Metabolic Syndrome (ATP III) | 13.7% | 1.26 | 2.36 | 2.16 | - | 2.56 | Pre-Hypertension (SBP 120 - 139 mmHg) | 21.7% | 1.05 | 1.09 | 0.49 | - | 1.69 | ||||||||||||||||||||||||||||||||||||||||||||||||||||||||||||||||||||||||||||||||||||||
| Pre-diabetes (110 - 125 mg/dL) | 6.9% | 1.15 | 1.62 | 1.4 | - | 1.84 | High cholesterol (≥ 240 mg/dL) | 10.2% | 1.1 | 1.03 | 0.67 | - | 1.39 | ||||||||||||||||||||||||||||||||||||||||||||||||||||||||||||||||||||||||||||||||||||||
| High cholesterol (≥ 240 mg/dL) | 10.9% | 1.13 | 0.91 | 0.55 | - | 1.27 | Low blood glucose (< 90 mg/dL) | 30.8% | 1.13 | 0.82 | 0.48 | - | 1.16 | ||||||||||||||||||||||||||||||||||||||||||||||||||||||||||||||||||||||||||||||||||||||
| Pre-Hypertension (SBP 120 - 139 mmHg) | 36.7% | 1.12 | 0.60 | 0.28 | - | 0.92 | |||||||||||||||||||||||||||||||||||||||||||||||||||||||||||||||||||||||||||||||||||||||||||||
| 1HR: Age-adjusted hazard ratio. | |||||||||||||||||||||||||||||||||||||||||||||||||||||||||||||||||||||||||||||||||||||||||||||||||||
| 2Life years lost: those with the risk – those without the risk. | |||||||||||||||||||||||||||||||||||||||||||||||||||||||||||||||||||||||||||||||||||||||||||||||||||
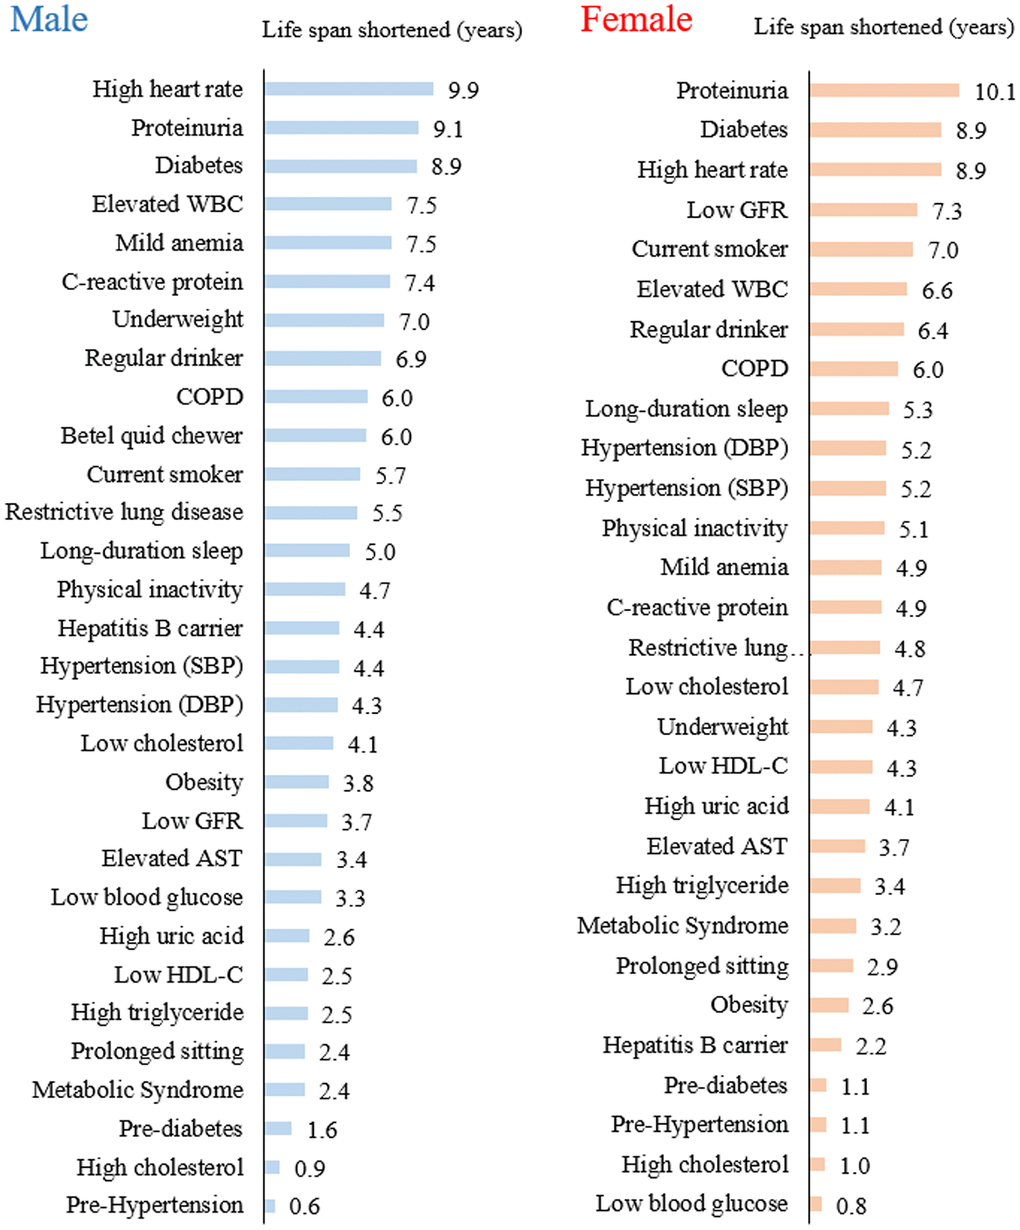
Figure 1. Years of life lost from each of the 30 health risks in men and women.
Individuals with a heart rate greater than 90 beats/minute had a substantial loss of life expectancy, 10 years for men and 9 years for women. Individuals with an elevated WBC count (>9,000/mm3) lost 7 years, and those with an elevated CRP (>3 mg/L) lost 5-7 years. Proteinuria, determined by dipstick, had 9-10 years loss as a whole, but a 7-year loss for those with trace proteinuria (data not shown).
In the middle range of life years lost, long-duration sleep (5 years), physical inactivity (5 years), hypertension (4-5 years), obesity (3-4 years), and prolonged sitting (2-3 years) were identified. Among the risks with minimal loss of years were high cholesterol (1 year), pre-hypertension, and pre-diabetes (1-2 years). In contrast, those with low cholesterol lost 4-5 years, while being underweight showed a loss of nearly 8 years in men and 4 years in women.
The loss of life expectancy for individuals with two co-existing risks is shown in Figure 2 for selected risks. Those having diabetes (8.9 years) and proteinuria (9.1 years) present at the same time showed a loss of 16.2 years, a number close to the sum of each risk. Similarly, inactive individuals (4.7 years) with hypertension (4.4 years) had a loss of 9.2 years, or with proteinuria (9.1 years) had a loss of 13.8 years.
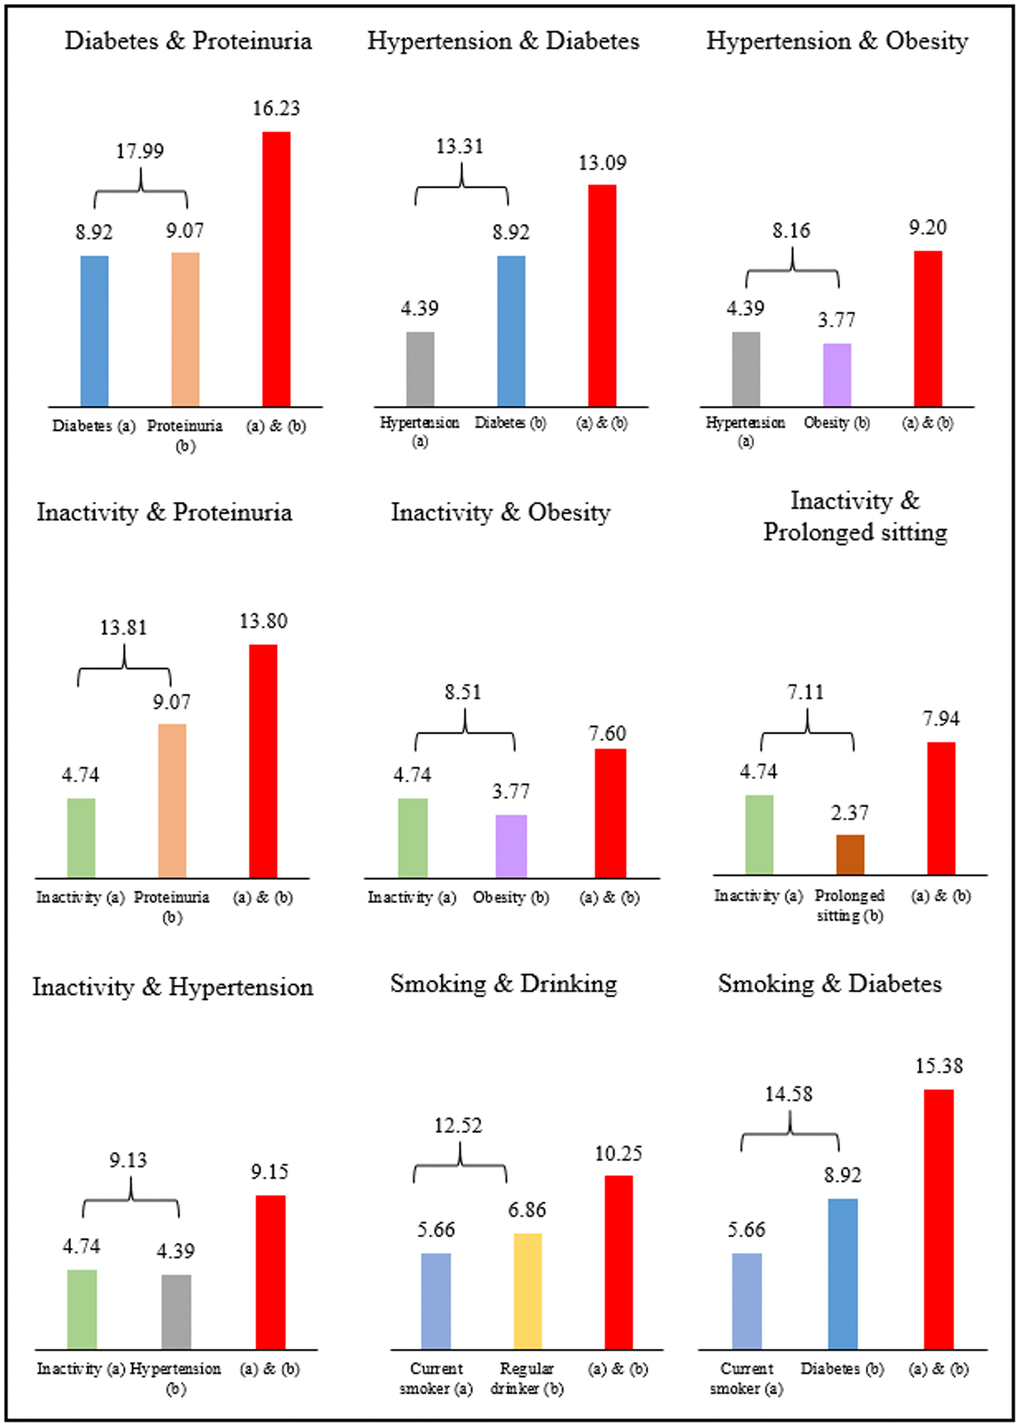
Figure 2. Years of life lost from two co-existing risk factors in men.
Discussion
We identified 30 risks from data collected in routine medical screening. By converting these health risks into life expectancy loss, patients can then easily understand the magnitude of each of their risks. If interpreted by clinicians, risk communication can be greatly facilitated. Given the reality of multiple risks in life, one is usually at a loss as to their relative importance. For example, three commonly encountered risks in men: hypertension, diabetes, and high cholesterol, are often interpreted as having a 48%, 102% and 13% increase in all-cause mortality based on their hazard ratios of 1.48, 2.02 and 1.13, respectively. In contrast, the life expectancy loss of 4.4 years, 8.9 years, and 0.9 years, respectively, can make the implications obvious. Expressing the risk as years of lost life expectancy serves several purposes: simplifying the size of the risks, setting priorities for proactive action among competing interests, and motivating behavioral changes. The benefits of risk reduction will be in the number of years gained, which is an understandable term. It is a potential paradigm shift in risk communication that can facilitate preventive action during teachable moments.
The seemly additive feature of life years lost was intriguing, as these results were not expected [4]. Whether additive or not, in theory, should depend on the interdependencies or interactions between the two risks. Positive synergistic effects of certain coexisting risks, e.g., smoking and diabetes, have a greater impact on life expectancy loss than the sum of the individual conditions. On the other hand, overlapping risks, e.g., smoking and drinking have a smaller joint effect than the sum of the individual risks. Since the exact relationship between risks is not fully understood, their joint impact on life expectancy requires further studies. This finding highlights the seriousness of the combined impact of multiple risks and underscores the utility of life years lost, with some risks more life-threatening than others.
For the top 20 risks, an overwhelming majority of the study subjects, 9 out of 10, had at least one risk, losing 4-10 years of life, and over two-thirds had two or more, losing 8-16 years, and one-third had three risks, losing 12-25 years. At least in theory, two-thirds of the cohort could gain up to 16 years if their coexisting two risks were substantially modified. Armed with this information, health educators or clinicians can better motivate patients to set priorities and make behavioral changes.
The magnitude of life expectancy loss observed in this study was generally consistent with the literature. For example, among the top 10 risks, the loss from diabetes, at 9 years, proteinuria, at 9-10 years, or COPD, at 6 years, are in line with those reported [11–18]. Much of the literature on life expectancy loss was limited to cardiovascular risk factors [5, 7, 8, 11–13, 16–18]. With regard to some non-traditional risks like high heart rate, elevated CRP, or high white count, only increased hazard ratios [19–22], not losses of life expectancy, were available.
While each of the 30 health risks is important, we focused on the top ten risk factors for males and females. In addition, a few particular risks that may have general interests are also selected for discussion.
High heart rate
The independent relationship between resting heart rate and mortality has been reported [23, 24]. Heart rate reflects the known relationship between cardiorespiratory fitness and mortality since low heart rates are characteristic of fit individuals. For those with a normal heart rate on the high side, 80-99 beats/min, a large loss of 5-8 years was found. Rapid heartbeat overloads the heart, with an extra 300 million beats in a span of 20 years for those with 90 beats/min compared to those with 60 beats/min. Indeed, heart rate has been inversely associated with longevity across mammal species, from rats, with 500 beats/min for 2 years, to whales, with 10 beats/min for 80 years. [23, 24].
Proteinuria and low GFR
Proteinuria and low GFR were components of chronic kidney disease. With proteinuria prevalence at 7-8%, its large life-shortening effect of 9-10 years has often been overlooked [25, 26].. Most with proteinuria are unaware of such a risk, a risk easily detected by urine dipstick [26, 27]. The only report on the risk of proteinuria in the form of life-shortening came from Canadian insurance data, with results similar to our study [28]. The prevalence of low GFR increased with age. The life shortening is about 4 to 7 years. Low eGFR and proteinuria, when found in diabetics, is known as diabetic kidney disease (DKD). DKD has been reported to shorten life expectancy by up to 16 years, as the presence of proteinuria made diabetes behave like a different disease [29].
Diabetes
The 9 years of life lost from diabetes is much higher than hypertension or elevated cholesterol. The differences in life loss observed between diabetic and nondiabetic participants were similar to those found in previous studies [30–32]. In the Framingham Heart Study, diabetic men and women 50 years and older lived on average 7.5 and 8.2 years less than their nondiabetic equivalents [31].
Inflammatory markers: CRP and WBC
Both CRP and WBC count are well-known inflammatory markers, with increased mortality for all causes and for CVD [19–22]. In clinical settings, each of these two risks are routinely measured, but the large loss of life expectancy, 5-7 years for CRP (≥ 3.0 mg/L) and 6-7 years for WBC (≥ 9000 / mm3) was surprising and has not previously been reported.
Anemia
The prevalence of mild anemia (hemoglobin 10 - 13.4 g/dL) is 5.3% for males and 10.2% for females. Anemia was primarily caused by iron deficiency; low oxygen-carrying capacity may result from other chronic cardiovascular diseases. Though the prevalence for females is higher than for males, the loss of life expectancy for males has higher impact at 7.5 years than for females at 4.9 years.
Obesity or underweight
The 3-4 years of life lost from obese individuals in this cohort is slightly smaller than those reported for Western populations [33]. In contrast, men who are underweight had a loss of 7 years, much larger than obese men. Such a paradoxical observation with underweight worse than obesity has been reported from Japan [34]. Underweight, quite common in Asian women (12%), had a loss of 4.3 years, larger than their obese counterparts of 2.6 years.
Smoking, regular drinking, and betel quid chewing
Smoking, drinking, and betel quid chewing were three major lifestyle risk factors for males. These were all high-risk factors for several cancer sites. The life loss of a regular drinker is slightly larger than betel quid chewing or smokers and may be due to accidents from drunk driving. Most betel quid chewers were also smokers and they got similar loss of life of 5 to 6 years.
COPD
COPD is not only a risk factor for lung diseases but also a systemic factor for several causes of death [35, 36]. COPD has 6 years of life loss but when concurrent with smoking, the years of life lost may increase to ten or more years.
Hypertension
In a recent publication of Global Burden of Disease Study (2020), high systolic blood pressure (SBP) was, among 87 risk factors analyzed, the leading risk factor for attributable deaths globally [37]. A similar conclusion a decade ago was that high BP was the biggest single contributor to all-cause mortality [38, 39]. However, the life-shortening effect ranked it about the tenth risk factor in this cohort with 5 to 6 years of life loss.
Sleep duration
Longer than 8 hours of sleep duration has been reported as an independent risk for mortality [40, 41]. It was equivalent to a 5-year loss of life in this study. The mechanism, however, is not well known but may reflect some underlying health conditions. Hazard ratios of sleep shorter than 4 hours were comparable to those of longer than 8 hours (Supplementary Table 1), suggesting that 6 to 7 hours of sleep a day is the goal to achieve.
Low and high total cholesterol
The minimal loss of life years (1 year) for high cholesterol (≥ 240 mg/dL) and a larger loss (4-5 years) for low cholesterol (<160 mg/dL) may seem puzzling but has been repeatedly reported among Asians [42, 43]. High cholesterol is known to be a major risk for heart disease. However, the relative proportion of heart disease among Asians was small, with heart disease mortality in Taiwan (11.7%) half that in the United States (23.1%). Low cholesterol was known to have increased mortality from hemorrhagic stroke and from liver cancer, which has been reported in other Asian populations [42, 43].
Prolonged sitting
Prolonged sitting has received increasing attention and was reported as a mortality risk independent of physical activity. [44, 45] Prolonged sitting could shorten one’s life by nearly 8 years when coupled with physical inactivity. Prolonged sitting and inactivity were the two common health risks, and their personal and public health implication cannot be overemphasized.
There are some limitations to this study. First, the loss of life expectancy was calculated without adjusting for confounding factors. However, adjusting life expectancy for comorbidities is not commonly done and is more of an academic exercise. Second, the life-shortening effect was calculated from differences in life expectancy, and technically speaking, different health risks based on different reference groups cannot be directly compared. Third, the life expectancy from this study is cohort-specific and may not be applicable to other populations, such as non-Asians. However, our study, by focusing on the life expectancy differences, should have minimized cohort-specific concerns [5]. Fourth, risk factors were determined from initial entry to the cohort and may have changed during the study. However, with such a large set of data, its impact would be very limited [25, 46].
In conclusion, behavioral modification to reduce health risks is of prime importance in daily clinical practice, and yet, effective counseling has been difficult. Life-year loss, when used to represent the size of each risk, would offer a different perspective and should be readily understandable to patients to prioritize treatment strategy. This new mode of practice can be a paradigm shift in conducting effective clinical management. For the top 20 risks, 9 out of 10 individuals had at least one risk, losing 4-10 years, and over two-thirds had two, losing 8-16 years, and one-third had three risks, losing 12-25 years. The message of loss of life expectancy is more intuitive and could be a powerful motivator for behavior changes.
Materials and Methods
Study population
The study cohort consisted of 543,410 adults, age 20 or older, who participated in a comprehensive health screening program run by a private firm, MJ Health Management Institution, Taipei, Taiwan. MJ attracted self-paying participants from all over Taiwan. All participants paid to become members and to have health examinations and may appear to be of higher socioeconomic status than the average population. However, many members paid for their parents and relatives, who could have been in different or lower socioeconomic classes. MJ also accepted individuals paid for by different companies, constituting occupational cohorts. A detailed description of this cohort has been reported elsewhere [47]. This cohort is an open (dynamic) cohort, and study subjects have been successively recruited from all walks of life since 1994. Every individual’s identification number was matched with the National Death file between 1994 and 2008.
A self-administered questionnaire gathered demographic, lifestyle, and medical history information, including levels of physical activity, developed from frequency, duration, and intensity information [25, 46]. Physical activity in this study referred to leisure-time physical activity only [46].
All clinics in the program used a centralized laboratory for consistency. Overnight fasting blood was collected and analyzed by a Hitachi 7150 auto-analyzer for a standard panel of blood tests. EKG recording for heart rate, dipstick for proteinuria, and spirometry for lung function were carried out, with details published elsewhere [25, 46].
Health risks
Selected health risks included behavioral risks and cardio-metabolic medically screened risks. The definitions, cut-points, and reference group for each risk are listed in Table 3. Selection of the risks for this study was based on: (1) finding a statistically significant hazard ratio (HR) for mortality; and (2) meeting a minimum requirement of a prevalence of 5% in either men or women in the cohort. The latter was set up to assure that the risk was commonly encountered, with at least one found in 20 individuals.
Table 3. Definition and cut-points of the 30 risk factors.
| Risk factor* | Risk group | Reference group | |||||||||||||||||||||||||||||||||||||||||||||||||||||||||||||||||||||||||||||||||||||||||||||||||
| High heart rate | ≥ 90 beats/minute | 60 - 69 beats/minute | |||||||||||||||||||||||||||||||||||||||||||||||||||||||||||||||||||||||||||||||||||||||||||||||||
| Proteinuria | Trace or positive (≥ 1+) (by dipstick) | Negative | |||||||||||||||||||||||||||||||||||||||||||||||||||||||||||||||||||||||||||||||||||||||||||||||||
| Diabetes | Fasting blood glucose ≥ 126 mg/dL or on medication | Fasting blood glucose 90 - 109 mg/dL | |||||||||||||||||||||||||||||||||||||||||||||||||||||||||||||||||||||||||||||||||||||||||||||||||
| Elevated white blood cell (WBC) | ≥ 9,000 / mm3 | 4000 - 5999/mm3 | |||||||||||||||||||||||||||||||||||||||||||||||||||||||||||||||||||||||||||||||||||||||||||||||||
| Mild anemia | Hemoglobin 10 - 13.4 g/dL in men; 10 - 11 g/dL in women | Hemoglobin 13.5 -15 g/dL in men; 12 - 14 g/dL in women | |||||||||||||||||||||||||||||||||||||||||||||||||||||||||||||||||||||||||||||||||||||||||||||||||
| C-reactive protein | ≥ 3.0 mg/L | < 1 mg/L | |||||||||||||||||||||||||||||||||||||||||||||||||||||||||||||||||||||||||||||||||||||||||||||||||
| Underweight | Men: BMI < 19 kg/m2; Women: BMI < 18.5 kg/m2 | BMI 23 - 24 kg/m2 | |||||||||||||||||||||||||||||||||||||||||||||||||||||||||||||||||||||||||||||||||||||||||||||||||
| Regular drinker | Alcohol drinking: ≥ 2 drinks, ≥ 3 times a week | Non-drinker | |||||||||||||||||||||||||||||||||||||||||||||||||||||||||||||||||||||||||||||||||||||||||||||||||
| Chronic Obstructive Pulmonary Disease (COPD) | GOLD definition: FEV1/FVC < 0.7 | FEV1/FVC ≥ 0.7 and FVC ≥ 80% | |||||||||||||||||||||||||||||||||||||||||||||||||||||||||||||||||||||||||||||||||||||||||||||||||
| Betel quid chewing | Chewer | Never chewer | |||||||||||||||||||||||||||||||||||||||||||||||||||||||||||||||||||||||||||||||||||||||||||||||||
| Current smoker | Current smoker | Never smoker | |||||||||||||||||||||||||||||||||||||||||||||||||||||||||||||||||||||||||||||||||||||||||||||||||
| Restrictive lung disease | GOLD definition: FEV1/FVC ≥ 0.7, but FVC < 80% | FEV1/FVC ≥ 0.7 and FVC ≥ 80% | |||||||||||||||||||||||||||||||||||||||||||||||||||||||||||||||||||||||||||||||||||||||||||||||||
| Long-duration sleep | Sleep duration > 8 hours/day | Sleep duration 6 - 7 hours/day | |||||||||||||||||||||||||||||||||||||||||||||||||||||||||||||||||||||||||||||||||||||||||||||||||
| Physical inactivity | < 3.75 MET-h/wk (inactive) | ≥ 7.5 MET-h/wk | |||||||||||||||||||||||||||||||||||||||||||||||||||||||||||||||||||||||||||||||||||||||||||||||||
| Hepatitis B carrier (HBsAg) | Hepatitis B surface antigen positive (HBsAg) | Surface antigen negative | |||||||||||||||||||||||||||||||||||||||||||||||||||||||||||||||||||||||||||||||||||||||||||||||||
| Hypertension (SBP) | Systolic blood pressure ≥ 140 mmHg or on hypertension medication | Systolic blood pressure 90 - 119 mmHg | |||||||||||||||||||||||||||||||||||||||||||||||||||||||||||||||||||||||||||||||||||||||||||||||||
| Hypertension (DBP) | Diastolic blood pressure ≥ 90 mmHg or on hypertension medication | Diastolic blood pressure 60 - 79 mmHg | |||||||||||||||||||||||||||||||||||||||||||||||||||||||||||||||||||||||||||||||||||||||||||||||||
| Low cholesterol | Total cholesterol < 160 mg/dL | Total cholesterol 180 - 199 mg/dL | |||||||||||||||||||||||||||||||||||||||||||||||||||||||||||||||||||||||||||||||||||||||||||||||||
| Obesity | BMI ≥ 30 kg/m2 | BMI 23 - 24 kg/m2 | |||||||||||||||||||||||||||||||||||||||||||||||||||||||||||||||||||||||||||||||||||||||||||||||||
| Low glomerular filtration rate | < 60 ml/min/1.73m2 (by CKD-EPI definition) | 60 - 89 ml/min/1.73m2 (by CKD-EPI definition) | |||||||||||||||||||||||||||||||||||||||||||||||||||||||||||||||||||||||||||||||||||||||||||||||||
| Elevated aspartate aminotransferase (AST) | ≥ 25 U/L | < 25 U/L | |||||||||||||||||||||||||||||||||||||||||||||||||||||||||||||||||||||||||||||||||||||||||||||||||
| Low blood glucose | Fasting blood glucose < 90 mg/dL | Fasting blood glucose 90 - 109 mg/dL | |||||||||||||||||||||||||||||||||||||||||||||||||||||||||||||||||||||||||||||||||||||||||||||||||
| High uric acid | ≥ 7 mg/dL | 5.0 – 5.9 mg/dL | |||||||||||||||||||||||||||||||||||||||||||||||||||||||||||||||||||||||||||||||||||||||||||||||||
| Low HDL-C | HDL-C < 35 mg/dL | HDL-C 35 - 69 mg/dL | |||||||||||||||||||||||||||||||||||||||||||||||||||||||||||||||||||||||||||||||||||||||||||||||||
| High triglyceride | Triglyceride ≥ 200 mg/dL | Triglyceride < 100 mg/dL | |||||||||||||||||||||||||||||||||||||||||||||||||||||||||||||||||||||||||||||||||||||||||||||||||
| Prolonged sitting | Yes (≥ 8 hours/day) | No (< 8 hours/day) | |||||||||||||||||||||||||||||||||||||||||||||||||||||||||||||||||||||||||||||||||||||||||||||||||
| Metabolic Syndrome (ATP III definition) | When 3 or more of the following characteristics present: Waistline ≥ 90 cm for men, or ≥ 80 cm for women Triglyceride ≥ 150 mg/dL. HDL-C <40 mg/dL for male, or <50 mg/dL for female. Blood pressure ≥ 130 (SBP) / ≥ 85 (DBP) mm Hg. Fasting blood glucose ≥ 110 mg/dL. | No metabolic syndrome | |||||||||||||||||||||||||||||||||||||||||||||||||||||||||||||||||||||||||||||||||||||||||||||||||
| Pre-diabetes | Fasting blood glucose 110 - 125 mg/dL | Fasting blood glucose 90 - 109 mg/dL | |||||||||||||||||||||||||||||||||||||||||||||||||||||||||||||||||||||||||||||||||||||||||||||||||
| High cholesterol | Total cholesterol ≥ 240 mg/dL | Total cholesterol 180 - 199 mg/dL | |||||||||||||||||||||||||||||||||||||||||||||||||||||||||||||||||||||||||||||||||||||||||||||||||
| Pre-hypertension | Systolic blood pressure 120 - 139 mmHg | Systolic blood pressure 90 - 119 mmHg | |||||||||||||||||||||||||||||||||||||||||||||||||||||||||||||||||||||||||||||||||||||||||||||||||
| *Listed in the order according to Table 2. | |||||||||||||||||||||||||||||||||||||||||||||||||||||||||||||||||||||||||||||||||||||||||||||||||||
Statistical analysis
Life expectancy is one of the most widely used demographic measures, which summarize age-specific mortality rates into one number. The calculation of life expectancy and its confidence interval were carried out using the life table method developed by Chiang [48]. Confidence intervals for the year of life loss was calculated based on a comparison of two population means, i.e., life expectancies, using the standard independent t-test.
The life expectancy calculated in this study referred to the average remaining years a 30-year-old person would be expected to live. Those with two coexisting risks, for selected risk factors, were compared against those with neither risk. The above analysis was limited to men, due to low-risk prevalence and smaller numbers of deaths in women.
The hazard ratio for each risk factor for men and for women was also calculated using Cox regression for both univariate (adjusted for age only) and multivariate (adjusted for age, smoking, BMI, systolic blood pressure, fasting blood glucose, and total cholesterol) analysis. All statistical analyses were performed with SAS, version 9.4 (SAS Institute, Cary, NC, USA).
Author Contributions
SPT and CPW designed the study and conceived the idea. MKT and PJL analyzed and interpreted the data. SPT, CPW, JPMW, CW, WG, TDC, CHC, and XW provided administrative, technical, or logistical support. SPT and CPW had final approval of the article. MKT and PJL were responsible for the collection and assembly of data.
Acknowledgments
All or part of the data used in this research were authorized by and received from MJ Health Research Foundation (Authorization Code: MJHRFB2014001C). Any interpretation or conclusion described in this paper does not represent the views of MJ Health Research Foundation. MJ Health Survey Database and MJ BioData were available from MJ Health Research Foundation website: http://www.mjhrf.org.
Conflicts of Interest
The authors declare that they have no conflicts of interest.
Funding
This study is supported in part by Taiwan Ministry of Health and Welfare Clinical Trial Center (MOHW109-TDU-B-212-114004), MOST Clinical Trial Consortium for Stroke (MOST 109-2321-B-039-002), China Medical University Hospital (DMR-109-231), Tseng-Lien Lin Foundation, Taichung, Taiwan. The funding source had no role in study design, data collection, data analysis, data interpretation, writing of the report, or in the decision to submit the paper for publication.
References
- 1. Silcocks PB, Jenner DA, Reza R. Life expectancy as a summary of mortality in a population: statistical considerations and suitability for use by health authorities. J Epidemiol Community Health. 2001; 55:38–43. https://doi.org/10.1136/jech.55.1.38 [PubMed]
- 2. Wen CP, Tsai SP, Chung WS. A 10-year experience with universal health insurance in Taiwan: measuring changes in health and health disparity. Ann Intern Med. 2008; 148:258–67. https://doi.org/10.7326/0003-4819-148-4-200802190-00004 [PubMed]
- 3. Winslow CE. THE UNTILLED FIELDS OF PUBLIC HEALTH. Science. 1920; 51:23–33. https://doi.org/10.1126/science.51.1306.23 [PubMed]
- 4. Bjerkedal T, Kristensen P, Selmer R. Life expectancy and cause of death in men examined at medical check-ups in 1964. Tidsskr Nor Laegeforen. 2012; 132:30–35. https://doi.org/10.4045/tidsskr.11.0506 [PubMed]
- 5. Clarke R, Emberson J, Fletcher A, Breeze E, Marmot M, Shipley MJ. Life expectancy in relation to cardiovascular risk factors: 38 year follow-up of 19,000 men in the Whitehall study. BMJ. 2009; 339:b3513. https://doi.org/10.1136/bmj.b3513 [PubMed]
- 6. Danaei G, Rimm EB, Oza S, Kulkarni SC, Murray CJ, Ezzati M. The promise of prevention: the effects of four preventable risk factors on national life expectancy and life expectancy disparities by race and county in the United States. PLoS Med. 2010; 7:e1000248. https://doi.org/10.1371/journal.pmed.1000248 [PubMed]
- 7. Di Angelantonio E, Kaptoge S, Wormser D, Willeit P, Butterworth AS, Bansal N, O’Keeffe LM, Gao P, Wood AM, Burgess S, Freitag DF, Pennells L, Peters SA, et al, and Emerging Risk Factors Collaboration. Association of Cardiometabolic Multimorbidity With Mortality. JAMA. 2015; 314:52–60. https://doi.org/10.1001/jama.2015.7008 [PubMed]
- 8. Li K, Hüsing A, Kaaks R. Lifestyle risk factors and residual life expectancy at age 40: a German cohort study. BMC Med. 2014; 12:59. https://doi.org/10.1186/1741-7015-12-59 [PubMed]
- 9. Murray CJL, Abbafati C, Abbas KM, Abbasi M, Abbasi-Kangevari M, Abd-Allah F, Abdollahi M, Abedi P, Abedi A, Abolhassani H, Aboyans V, Abreu LG, Abrigo MRM, et al, and GBD 2019 Viewpoint Collaborators. Five insights from the Global Burden of Disease Study 2019. The Lancet. 2020; 396:1135–59. https://doi.org/10.1016/S0140-6736(20)31404-5
- 10. Foreman KJ, Marquez N, Dolgert A, Fukutaki K, Fullman N, McGaughey M, Pletcher MA, Smith AE, Tang K, Yuan CW, Brown JC, Friedman J, He J, et al. Forecasting life expectancy, years of life lost, and all-cause and cause-specific mortality for 250 causes of death: reference and alternative scenarios for 2016-40 for 195 countries and territories. Lancet. 2018; 392:2052–90. https://doi.org/10.1016/S0140-6736(18)31694-5 [PubMed]
- 11. Rao Kondapally Seshasai S, Kaptoge S, Thompson A, Di Angelantonio E, Gao P, Sarwar N, Whincup PH, Mukamal KJ, Gillum RF, Holme I, Njølstad I, Fletcher A, Nilsson P, et al, and Emerging Risk Factors Collaboration. Diabetes mellitus, fasting glucose, and risk of cause-specific death. N Engl J Med. 2011; 364:829–41. https://doi.org/10.1056/NEJMoa1008862 [PubMed]
- 12. Wang Z, Liu M. Life years lost associated with diabetes: An individually matched cohort study using the U.S. National Health Interview Survey data. Diabetes Res Clin Pract. 2016; 118:69–76. https://doi.org/10.1016/j.diabres.2016.06.015 [PubMed]
- 13. Steensma C, Loukine L, Orpana H, Lo E, Choi B, Waters C, Martel S. Comparing life expectancy and health-adjusted life expectancy by body mass index category in adult Canadians: a descriptive study. Popul Health Metr. 2013; 11:21. https://doi.org/10.1186/1478-7954-11-21 [PubMed]
- 14. Shavelle RM, Paculdo DR, Kush SJ, Mannino DM, Strauss DJ. Life expectancy and years of life lost in chronic obstructive pulmonary disease: findings from the NHANES III Follow-up Study. Int J Chron Obstruct Pulmon Dis. 2009; 4:137–48. https://doi.org/10.2147/copd.s5237 [PubMed]
- 15. Wang T. Model of life expectancy of chronic hepatitis B carriers in an endemic region. J Epidemiol. 2009; 19:311–18. https://doi.org/10.2188/jea.je20090039 [PubMed]
- 16. Reimers CD, Knapp G, Reimers AK. Does physical activity increase life expectancy? A review of the literature. J Aging Res. 2012; 2012:243958. https://doi.org/10.1155/2012/243958 [PubMed]
- 17. Zhang D, Shen X, Qi X. Resting heart rate and all-cause and cardiovascular mortality in the general population: a meta-analysis. CMAJ. 2016; 188:E53–63. https://doi.org/10.1503/cmaj.150535 [PubMed]
- 18. Go AS, Mozaffarian D, Roger VL, Benjamin EJ, Berry JD, Borden WB, Bravata DM, Dai S, Ford ES, Fox CS, Franco S, Fullerton HJ, Gillespie C, et al, and American Heart Association Statistics Committee and Stroke Statistics Subcommittee. Executive summary: heart disease and stroke statistics--2013 update: a report from the American Heart Association. Circulation. 2013; 127:143–52. https://doi.org/10.1161/CIR.0b013e318282ab8f [PubMed]
- 19. Zacho J, Tybjaerg-Hansen A, Nordestgaard BG. C-reactive protein and all-cause mortality--the Copenhagen City Heart Study. Eur Heart J. 2010; 31:1624–32. https://doi.org/10.1093/eurheartj/ehq103 [PubMed]
- 20. Jee SH, Park JY, Kim HS, Lee TY, Samet JM. White blood cell count and risk for all-cause, cardiovascular, and cancer mortality in a cohort of Koreans. Am J Epidemiol. 2005; 162:1062–69. https://doi.org/10.1093/aje/kwi326 [PubMed]
- 21. Willems JM, Trompet S, Blauw GJ, Westendorp RG, de Craen AJ. White blood cell count and C-reactive protein are independent predictors of mortality in the oldest old. J Gerontol A Biol Sci Med Sci. 2010; 65:764–68. https://doi.org/10.1093/gerona/glq004 [PubMed]
- 22. Tamakoshi K, Toyoshima H, Yatsuya H, Matsushita K, Okamura T, Hayakawa T, Okayama A, Ueshima H, and NIPPON DATA90 Research Group. White blood cell count and risk of all-cause and cardiovascular mortality in nationwide sample of Japanese--results from the NIPPON DATA90. Circ J. 2007; 71:479–85. https://doi.org/10.1253/circj.71.479 [PubMed]
- 23. Boudoulas KD, Borer JS, Boudoulas H. Heart Rate, Life Expectancy and the Cardiovascular System: Therapeutic Considerations. Cardiology. 2015; 132:199–212. https://doi.org/10.1159/000435947 [PubMed]
- 24. Levine HJ. Rest heart rate and life expectancy. J Am Coll Cardiol. 1997; 30:1104–06. https://doi.org/10.1016/s0735-1097(97)00246-5 [PubMed]
- 25. Wen CP, Cheng TY, Tsai MK, Chang YC, Chan HT, Tsai SP, Chiang PH, Hsu CC, Sung PK, Hsu YH, Wen SF. All-cause mortality attributable to chronic kidney disease: a prospective cohort study based on 462 293 adults in Taiwan. Lancet. 2008; 371:2173–82. https://doi.org/10.1016/S0140-6736(08)60952-6 [PubMed]
- 26. Wen CP, Yang YC, Tsai MK, Wen SF. Urine dipstick to detect trace proteinuria: an underused tool for an underappreciated risk marker. Am J Kidney Dis. 2011; 58:1–3. https://doi.org/10.1053/j.ajkd.2011.05.007 [PubMed]
- 27. White SL, Yu R, Craig JC, Polkinghorne KR, Atkins RC, Chadban SJ. Diagnostic accuracy of urine dipsticks for detection of albuminuria in the general community. Am J Kidney Dis. 2011; 58:19–28. https://doi.org/10.1053/j.ajkd.2010.12.026 [PubMed]
- 28. Turin TC, Ahmed SB, Tonelli M, Manns B, Ravani P, James M, Quinn RR, Jun M, Gansevoort R, Hemmelgarn B. Kidney function, albuminuria and life expectancy. Can J Kidney Health Dis. 2014; 1:33. https://doi.org/10.1186/s40697-014-0033-6 [PubMed]
- 29. Wen CP, Chang CH, Tsai MK, Lee JH, Lu PJ, Tsai SP, Wen C, Chen CH, Kao CW, Tsao CK, Wu X. Diabetes with early kidney involvement may shorten life expectancy by 16 years. Kidney Int. 2017; 92:388–96. https://doi.org/10.1016/j.kint.2017.01.030 [PubMed]
- 30. Leal J, Gray AM, Clarke PM. Development of life-expectancy tables for people with type 2 diabetes. Eur Heart J. 2009; 30:834–39. https://doi.org/10.1093/eurheartj/ehn567 [PubMed]
- 31. Franco OH, Steyerberg EW, Hu FB, Mackenbach J, Nusselder W. Associations of diabetes mellitus with total life expectancy and life expectancy with and without cardiovascular disease. Arch Intern Med. 2007; 167:1145–51. https://doi.org/10.1001/archinte.167.11.1145 [PubMed]
- 32. Narayan KM, Boyle JP, Thompson TJ, Sorensen SW, Williamson DF. Lifetime risk for diabetes mellitus in the United States. JAMA. 2003; 290:1884–90. https://doi.org/10.1001/jama.290.14.1884 [PubMed]
- 33. Whitlock G, Lewington S, Sherliker P, Clarke R, Emberson J, Halsey J, Qizilbash N, Collins R, Peto R, and Prospective Studies Collaboration. Body-mass index and cause-specific mortality in 900 000 adults: collaborative analyses of 57 prospective studies. Lancet. 2009; 373:1083–96. https://doi.org/10.1016/S0140-6736(09)60318-4 [PubMed]
- 34. Nagai M, Kuriyama S, Kakizaki M, Ohmori-Matsuda K, Sone T, Hozawa A, Kawado M, Hashimoto S, Tsuji I. Impact of obesity, overweight and underweight on life expectancy and lifetime medical expenditures: the Ohsaki Cohort Study. BMJ Open. 2012; 2:e000940. https://doi.org/10.1136/bmjopen-2012-000940 [PubMed]
- 35. Berry CE, Wise RA. Mortality in COPD: causes, risk factors, and prevention. COPD. 2010; 7:375–82. https://doi.org/10.3109/15412555.2010.510160 [PubMed]
- 36. Barnes PJ, Burney PG, Silverman EK, Celli BR, Vestbo J, Wedzicha JA, Wouters EF. Chronic obstructive pulmonary disease. Nat Rev Dis Primers. 2015; 1:15076. https://doi.org/10.1038/nrdp.2015.76 [PubMed]
- 37. GBD 2019 Risk Factors Collaborators. Global burden of 87 risk factors in 204 countries and territories, 1990-2019: a systematic analysis for the Global Burden of Disease Study 2019. Lancet. 2020; 396:1223–49. https://doi.org/10.1016/S0140-6736(20)30752-2 [PubMed]
- 38. Mills KT, Stefanescu A, He J. The global epidemiology of hypertension. Nat Rev Nephrol. 2020; 16:223–37. https://doi.org/10.1038/s41581-019-0244-2 [PubMed]
- 39. Poulter NR, Prabhakaran D, Caulfield M. Hypertension. Lancet. 2015; 386:801–12. https://doi.org/10.1016/S0140-6736(14)61468-9 [PubMed]
- 40. Cappuccio FP, D’Elia L, Strazzullo P, Miller MA. Sleep duration and all-cause mortality: a systematic review and meta-analysis of prospective studies. Sleep. 2010; 33:585–92. https://doi.org/10.1093/sleep/33.5.585 [PubMed]
- 41. Gallicchio L, Kalesan B. Sleep duration and mortality: a systematic review and meta-analysis. J Sleep Res. 2009; 18:148–58. https://doi.org/10.1111/j.1365-2869.2008.00732.x [PubMed]
- 42. Schatz IJ, Masaki K, Yano K, Chen R, Rodriguez BL, Curb JD. Cholesterol and all-cause mortality in elderly people from the Honolulu Heart Program: a cohort study. Lancet. 2001; 358:351–55. https://doi.org/10.1016/S0140-6736(01)05553-2 [PubMed]
- 43. Bae JM, Yang YJ, Li ZM, Ahn YO. Low cholesterol is associated with mortality from cardiovascular diseases: a dynamic cohort study in Korean adults. J Korean Med Sci. 2012; 27:58–63. https://doi.org/10.3346/jkms.2012.27.1.58 [PubMed]
- 44. Biswas A, Oh PI, Faulkner GE, Bajaj RR, Silver MA, Mitchell MS, Alter DA. Sedentary time and its association with risk for disease incidence, mortality, and hospitalization in adults: a systematic review and meta-analysis. Ann Intern Med. 2015; 162:123–32. https://doi.org/10.7326/M14-1651 [PubMed]
- 45. Rezende LF, Sá TH, Mielke GI, Viscondi JY, Rey-López JP, Garcia LM. All-Cause Mortality Attributable to Sitting Time: Analysis of 54 Countries Worldwide. Am J Prev Med. 2016; 51:253–63. https://doi.org/10.1016/j.amepre.2016.01.022 [PubMed]
- 46. Wen CP, Wai JP, Tsai MK, Yang YC, Cheng TY, Lee MC, Chan HT, Tsao CK, Tsai SP, Wu X. Minimum amount of physical activity for reduced mortality and extended life expectancy: a prospective cohort study. Lancet. 2011; 378:1244–53. https://doi.org/10.1016/S0140-6736(11)60749-6 [PubMed]
- 47. Wu X, Tsai SP, Tsao CK, Chiu ML, Tsai MK, Lu PJ, Lee JH, Chen CH, Wen C, Chang SS, Hsu CY, Wen CP. Cohort Profile: The Taiwan MJ Cohort: half a million Chinese with repeated health surveillance data. Int J Epidemiol. 2017; 46:1744–44g. https://doi.org/10.1093/ije/dyw282 [PubMed]
- 48. Chiang CL. Life table and its applications. Malabar, Florida; Robert E. Krieger Publishing Co., 1984: 316p. https://libraryopac.searo.who.int/cgi-bin/koha/opac-detail.pl?biblionumber=356.