


Introduction
According to the latest global cancer burden data released by the International Agency for Research on Cancer (IARC) of the World Health Organization in 2020 [1], the incidence of breast cancer (BC) in women exceeds that of lung cancer, accounting for 11.7% of all new tumors and becoming the most common cancer in the worldwide. Approximately 685,000 deaths from BC were reported, making it the fifth leading cause of cancer-related death in the world [1], 90% of which were caused by distant metastasis of primary tumor cells [2, 3]. Among women, the BC incidence and mortality rank first among 159 countries in the world, and the relative increase in cancer risk was the largest in low or medium countries/regions (95% increase and 64% increase from 2020, respectively). Although the mortality rate of BC had decreased in 1991-2017 [4], in the past ten years (2008-2017), the rate of decrease in mortality of females with BC has gradually slowed. The aforementioned survey data showed that the previous preventive or treatment measures were not effective, and the high morbidity and mortality rates have become a public health problem that seriously threatens women’s health. Therefore, effective and cost-effective early detection, early diagnosis and individualized treatment of BC have become urgent problems that remain to be solved worldwide.
Current studies have reported many reproductive and environmental factors related to BC [5–7]. Genetic factors are also indispensable for increasing the risk of BC. BRCA1 and BRCA2 are currently recognized BC susceptibility genes and are widely measured as predictors of BC risk [8–10]. Recently, with the development of high-throughput sequencing technology, noncoding RNAs have been extensively studied, and lncRNAs, new BC biomarkers, are involved in some biological processes, such as cell proliferation, cell cycle, apoptosis, pluripotency differentiation and maintenance [11], resulting in the occurrence and development of some cancers including BC, liver cancer, and lung cancer, by promoting tumor proliferation, invasion, and metastasis [12–15].
The LncRNA MIR2052HG, also known as FLJ39080 and LOC441355, is a long non-coding RNA located on chromosome 8. James N et al. [16] found that the risk of BC recurrence in individuals with homozygous mutant and heterozygous genotypes of the lncRNA MIR2052HG was lower than that in the wild type homozygous individuals. In addition, MIR2052HG overexpression increases BC cell proliferation and promotes colony formation. Pharmacogenomics studies [17] have shown that as a functional polymorphic gene, MIR2052HG might affect the risk of BC recurrence in women treated with aromatase inhibitors. Single Nucleotide Polymorphisms (SNPs) are polymorphisms in DNA sequences caused by variations in single nucleotides at the genome level. According to genome-wide association studies (GWAS) [18], SNPs in lncRNAs are related to susceptibility to many diseases, and SNPs at the key regulatory position of lncRNAs may substantially disrupt their function. Wang L et al. [19] also found that the SNP rs3802201 in MIR2052HG is closely related to the recurrence. However, this study was mainly based on pharmacogenomics to explore the relationship between the lncRNA MIR2052HG and BC resistance and recurrence. Researchers have not clearly determined whether there is an association between the genetic variants of MIR2052HG and BC susceptibility exists.
Therefore, relying on the Han population in Henan, this project screened SNPs in the lncRNA MIR2052HG that affect the occurrence of BC and studied the possible molecular mechanism to discover new risk markers for BC. The results might facilitate the early identification and diagnosis of BC in high-risk populations to achieve the purpose of early prevention of BC.
Results
Basic characteristics of study subjects
Based on a case-control study, the basic information of 504 patients and 505 healthy controls was presented in Table 1. The results showed that the age at menarche of the case group (14.21±1.70) was higher than that of the control group (13.97±1.75) (P=0.030), and ≥2 pregnancies (OR:2.049, 95% CI: 1.592-2.637, P<0.001) and the family history of BC (OR:1.869 95% CI: 1.116-3.130, P=0.017) were risk factors for BC. However, a breastfeeding history (OR:0.724, 95% CI: 0.535-0.980, P=0.037) protected against BC.
Table 1. Basic characteristics of 504 breast cancer cases and 505 healthy controls.
| Variable | Case (%) | Control (%) | Pb | ||||||||||||||||||||||||||||||||||||||||||||||||||||||||||||||||||||||||||||||||||||||||||||||||
| n=504 | n=505 | ||||||||||||||||||||||||||||||||||||||||||||||||||||||||||||||||||||||||||||||||||||||||||||||||||
| Age ( | 48.00 ± 9.85 | 48.15 ± 9.61 | 0.806a | ||||||||||||||||||||||||||||||||||||||||||||||||||||||||||||||||||||||||||||||||||||||||||||||||
| Age at menarche ( | 14.21 ± 1.70 | 13.97 ± 1.75 | 0.030a | ||||||||||||||||||||||||||||||||||||||||||||||||||||||||||||||||||||||||||||||||||||||||||||||||
| Age at menopause ( | 48.60± 3.90 | 48.72 ± 3.70 | 0.760a | ||||||||||||||||||||||||||||||||||||||||||||||||||||||||||||||||||||||||||||||||||||||||||||||||
| Menopause statue | |||||||||||||||||||||||||||||||||||||||||||||||||||||||||||||||||||||||||||||||||||||||||||||||||||
| Un-menopause | 320 (63.5) | 294 (58.2) | |||||||||||||||||||||||||||||||||||||||||||||||||||||||||||||||||||||||||||||||||||||||||||||||||
| Post-menopause | 184 (36.5) | 211(41.8) | 0.086 | ||||||||||||||||||||||||||||||||||||||||||||||||||||||||||||||||||||||||||||||||||||||||||||||||
| Number of pregnancies | |||||||||||||||||||||||||||||||||||||||||||||||||||||||||||||||||||||||||||||||||||||||||||||||||||
| <2 | 53(10.5) | 94(18.6) | |||||||||||||||||||||||||||||||||||||||||||||||||||||||||||||||||||||||||||||||||||||||||||||||||
| ≥2 | 451 (89.5) | 411 (81.4) | <0.001 | ||||||||||||||||||||||||||||||||||||||||||||||||||||||||||||||||||||||||||||||||||||||||||||||||
| Number of abortions | |||||||||||||||||||||||||||||||||||||||||||||||||||||||||||||||||||||||||||||||||||||||||||||||||||
| <2 | 340 (67.5) | 345(68.3) | |||||||||||||||||||||||||||||||||||||||||||||||||||||||||||||||||||||||||||||||||||||||||||||||||
| ≥2 | 164 (32.5) | 160 (31.7) | 0.771 | ||||||||||||||||||||||||||||||||||||||||||||||||||||||||||||||||||||||||||||||||||||||||||||||||
| Breast-feeding history | |||||||||||||||||||||||||||||||||||||||||||||||||||||||||||||||||||||||||||||||||||||||||||||||||||
| No | 121 (24.0) | 94 (18.6) | |||||||||||||||||||||||||||||||||||||||||||||||||||||||||||||||||||||||||||||||||||||||||||||||||
| Yes | 383 (76.0) | 411(81.4) | 0.037 | ||||||||||||||||||||||||||||||||||||||||||||||||||||||||||||||||||||||||||||||||||||||||||||||||
| Family history | |||||||||||||||||||||||||||||||||||||||||||||||||||||||||||||||||||||||||||||||||||||||||||||||||||
| No | 461 (91.5) | 481(95.2) | |||||||||||||||||||||||||||||||||||||||||||||||||||||||||||||||||||||||||||||||||||||||||||||||||
| Yes | 43 (8.5) | 24 (4.8) | 0.017 | ||||||||||||||||||||||||||||||||||||||||||||||||||||||||||||||||||||||||||||||||||||||||||||||||
| ER receptor | |||||||||||||||||||||||||||||||||||||||||||||||||||||||||||||||||||||||||||||||||||||||||||||||||||
| Negative | 149(30.3) | ||||||||||||||||||||||||||||||||||||||||||||||||||||||||||||||||||||||||||||||||||||||||||||||||||
| Positive | 342(69.7) | ||||||||||||||||||||||||||||||||||||||||||||||||||||||||||||||||||||||||||||||||||||||||||||||||||
| PR receptor | |||||||||||||||||||||||||||||||||||||||||||||||||||||||||||||||||||||||||||||||||||||||||||||||||||
| Negative | 191(39.1) | ||||||||||||||||||||||||||||||||||||||||||||||||||||||||||||||||||||||||||||||||||||||||||||||||||
| Positive | 298(60.9) | ||||||||||||||||||||||||||||||||||||||||||||||||||||||||||||||||||||||||||||||||||||||||||||||||||
| HER-2 receptor | |||||||||||||||||||||||||||||||||||||||||||||||||||||||||||||||||||||||||||||||||||||||||||||||||||
| Negative | 136(29.3) | ||||||||||||||||||||||||||||||||||||||||||||||||||||||||||||||||||||||||||||||||||||||||||||||||||
| Positive | 328(70.7) | ||||||||||||||||||||||||||||||||||||||||||||||||||||||||||||||||||||||||||||||||||||||||||||||||||
| at test. | |||||||||||||||||||||||||||||||||||||||||||||||||||||||||||||||||||||||||||||||||||||||||||||||||||
| bχ2 test, Two-sided P<0.05 is statistically significant. | |||||||||||||||||||||||||||||||||||||||||||||||||||||||||||||||||||||||||||||||||||||||||||||||||||
Association of MIR2052HG SNPs with BC susceptibility
Different genotype models of nine MIR2052HG SNPs with BC susceptibility were presented in Table 2. The MIR2052HG rs3802201 CG+GG genotype, rs2553716 AC genotype and AC+CC genotype, rs2588297 GT genotype and GT+TT type, rs4259395 AG+GG genotype, rs10957736 TT genotype and CT+TT genotype and rs12546233 AC+CC genotype might reduce the risk of BC, while the rs34841297 deletion mutation increases the risk of breast cancer. Compared with the wild homozygous AA genotype, the SNP rs34841297 --(homozygous deletion) genotype (OR: 1.936, 95% CI: 1.208-3.123) and A-+--genotype (OR: 1.704, 95% CI: 1.087-2.672) resulted in a higher risk in BC.
Table 2. Association between nine SNPs and breast cancer susceptibility.
| SNPs | Genetic model | Genotype | Case (n=504, %) | Control (n=505, %) | Pa | Adjusted OR (95%CI) | Pb | ||||||||||||||||||||||||||||||||||||||||||||||||||||||||||||||||||||||||||||||||||||||||||||
| rs3802201 | Codominant | CC | 257(51) | 232(45.9) | 0.0545 | 1 | |||||||||||||||||||||||||||||||||||||||||||||||||||||||||||||||||||||||||||||||||||||||||||||
| CG | 218(43.3) | 231(45.7) | 0.776(0.590,1.022) | 0.071 | |||||||||||||||||||||||||||||||||||||||||||||||||||||||||||||||||||||||||||||||||||||||||||||||
| GG | 29(5.8) | 42(8.3) | 0.642(0.375,1.098) | 0.105 | |||||||||||||||||||||||||||||||||||||||||||||||||||||||||||||||||||||||||||||||||||||||||||||||
| Dominant | CC | 257(51.0) | 232(45.9) | 1 | |||||||||||||||||||||||||||||||||||||||||||||||||||||||||||||||||||||||||||||||||||||||||||||||
| CG+GG | 247(49.0) | 273(54.1) | 0.756(0.580,0.986) | 0.039 | |||||||||||||||||||||||||||||||||||||||||||||||||||||||||||||||||||||||||||||||||||||||||||||||
| Recessive | CC+CG | 475(94.2) | 463(91.7) | 1 | |||||||||||||||||||||||||||||||||||||||||||||||||||||||||||||||||||||||||||||||||||||||||||||||
| GG | 29(5.8) | 42(8.3) | 0.725(0.431,1.219) | 0.225 | |||||||||||||||||||||||||||||||||||||||||||||||||||||||||||||||||||||||||||||||||||||||||||||||
| Over-Dominant | CC+GG | 286(56.7) | 274(54.3) | 1 | |||||||||||||||||||||||||||||||||||||||||||||||||||||||||||||||||||||||||||||||||||||||||||||||
| CG | 218(43.3) | 231(45.7) | 0.822(0.630,1.073) | 0.148 | |||||||||||||||||||||||||||||||||||||||||||||||||||||||||||||||||||||||||||||||||||||||||||||||
| rs2553716 | Codominant | AA | 261(51.8) | 231(45.7) | 0.1535 | 1 | |||||||||||||||||||||||||||||||||||||||||||||||||||||||||||||||||||||||||||||||||||||||||||||
| AC | 211(41.9) | 232(45.9) | 0.739(0.560,0.973) | 0.031 | |||||||||||||||||||||||||||||||||||||||||||||||||||||||||||||||||||||||||||||||||||||||||||||||
| CC | 32(6.3) | 42(8.3) | 0.728(0.432,1.228) | 0.234 | |||||||||||||||||||||||||||||||||||||||||||||||||||||||||||||||||||||||||||||||||||||||||||||||
| Dominant | AA | 261(51.8) | 231(45.7) | 1 | |||||||||||||||||||||||||||||||||||||||||||||||||||||||||||||||||||||||||||||||||||||||||||||||
| AC+CC | 243(48.2) | 274(54.3) | 0.737(0.565,0.931) | 0.024 | |||||||||||||||||||||||||||||||||||||||||||||||||||||||||||||||||||||||||||||||||||||||||||||||
| Recessive | AA+AC | 472(93.7) | 463(91.7) | 1 | |||||||||||||||||||||||||||||||||||||||||||||||||||||||||||||||||||||||||||||||||||||||||||||||
| CC | 32(6.3) | 42(8.3) | 0.841(0.507,1.394) | 0.501 | |||||||||||||||||||||||||||||||||||||||||||||||||||||||||||||||||||||||||||||||||||||||||||||||
| Over-Dominant | AA+CC | 293(58.1) | 273(54.1) | 1 | |||||||||||||||||||||||||||||||||||||||||||||||||||||||||||||||||||||||||||||||||||||||||||||||
| AC | 211(41.9) | 232(45.9) | 0.770(0.590,1.006) | 0.055 | |||||||||||||||||||||||||||||||||||||||||||||||||||||||||||||||||||||||||||||||||||||||||||||||
| rs4259395 | Codominant | AA | 186(36.9) | 163(32.3) | 0.041 | 1 | |||||||||||||||||||||||||||||||||||||||||||||||||||||||||||||||||||||||||||||||||||||||||||||
| AG | 253(50.2) | 264(52.3) | 0.775(0.579,1.073) | 0.086 | |||||||||||||||||||||||||||||||||||||||||||||||||||||||||||||||||||||||||||||||||||||||||||||||
| GG | 65(12.9) | 78(15.4) | 0.693(0.457,1.453) | 0.086 | |||||||||||||||||||||||||||||||||||||||||||||||||||||||||||||||||||||||||||||||||||||||||||||||
| Dominant | AA | 186(36.9) | 163(32.3) | 1 | |||||||||||||||||||||||||||||||||||||||||||||||||||||||||||||||||||||||||||||||||||||||||||||||
| AG+GG | 318(63.1) | 542(67.7) | 0.756(0.573,0.999) | 0.049 | |||||||||||||||||||||||||||||||||||||||||||||||||||||||||||||||||||||||||||||||||||||||||||||||
| Recessive | AA+AG | 439(87.1) | 427(84.6) | 1 | |||||||||||||||||||||||||||||||||||||||||||||||||||||||||||||||||||||||||||||||||||||||||||||||
| GG | 65(12.9) | 78(15.4) | 0.807(0.552,1.179) | 0.268 | |||||||||||||||||||||||||||||||||||||||||||||||||||||||||||||||||||||||||||||||||||||||||||||||
| Over-Dominant | AA+GG | 251(49.8) | 241(47.7) | ||||||||||||||||||||||||||||||||||||||||||||||||||||||||||||||||||||||||||||||||||||||||||||||||
| AG | 253(50.2) | 264(52.3) | 0.862(0.662,1.123) | 0.272 | |||||||||||||||||||||||||||||||||||||||||||||||||||||||||||||||||||||||||||||||||||||||||||||||
| rs2588297 | Codominant | GG | 343(68.1) | 291(57.6) | 0.3605 | 1 | |||||||||||||||||||||||||||||||||||||||||||||||||||||||||||||||||||||||||||||||||||||||||||||
| GT | 147(29.2) | 195(38.6) | 0.597(0.448,0.794) | 0.000 | |||||||||||||||||||||||||||||||||||||||||||||||||||||||||||||||||||||||||||||||||||||||||||||||
| TT | 14(2.8) | 19(3.8) | 0.799(0.335,1.463) | 0.343 | |||||||||||||||||||||||||||||||||||||||||||||||||||||||||||||||||||||||||||||||||||||||||||||||
| Dominant | GG | 343(68.1) | 291(57.6) | 1 | |||||||||||||||||||||||||||||||||||||||||||||||||||||||||||||||||||||||||||||||||||||||||||||||
| GT+TT | 161(31.9) | 214(42.4) | 0.606(0.459,0.798) | 0.000 | |||||||||||||||||||||||||||||||||||||||||||||||||||||||||||||||||||||||||||||||||||||||||||||||
| Recessive | GG+GT | 490(97.2) | 486(96.2) | 1 | |||||||||||||||||||||||||||||||||||||||||||||||||||||||||||||||||||||||||||||||||||||||||||||||
| TT | 14(2.8) | 19(3.8) | 0.839(0.404,1.742) | 0.637 | |||||||||||||||||||||||||||||||||||||||||||||||||||||||||||||||||||||||||||||||||||||||||||||||
| Over-Dominant | GG+TT | 357(70.8) | 310(61.4) | 1 | |||||||||||||||||||||||||||||||||||||||||||||||||||||||||||||||||||||||||||||||||||||||||||||||
| GT | 147(29.2) | 195(38.6) | 0.608(0.458,0.807) | 0.001 | |||||||||||||||||||||||||||||||||||||||||||||||||||||||||||||||||||||||||||||||||||||||||||||||
| rs10957736 | Codominant | CC | 242(48.0) | 211(41.8) | 0.2226 | 1 | |||||||||||||||||||||||||||||||||||||||||||||||||||||||||||||||||||||||||||||||||||||||||||||
| CT | 224(44.4) | 235(46.5) | 0.804(0.608,1.062) | 0.124 | |||||||||||||||||||||||||||||||||||||||||||||||||||||||||||||||||||||||||||||||||||||||||||||||
| TT | 38(7.5) | 59(11.7) | 0.562(0.348,0.907) | 0.018 | |||||||||||||||||||||||||||||||||||||||||||||||||||||||||||||||||||||||||||||||||||||||||||||||
| rs10957736 | Dominant | CC | 242(48.0) | 211(41.8) | 1 | ||||||||||||||||||||||||||||||||||||||||||||||||||||||||||||||||||||||||||||||||||||||||||||||
| CT+TT | 262(52.0) | 294(58.2) | 0.756(0.579,0.986) | 0.039 | |||||||||||||||||||||||||||||||||||||||||||||||||||||||||||||||||||||||||||||||||||||||||||||||
| Recessive | CC+CT | 466(92.5) | 446(88.3) | 1 | |||||||||||||||||||||||||||||||||||||||||||||||||||||||||||||||||||||||||||||||||||||||||||||||
| TT | 38(7.5) | 59(11.7) | 0.627(0.397,0.991) | 0.046 | |||||||||||||||||||||||||||||||||||||||||||||||||||||||||||||||||||||||||||||||||||||||||||||||
| Over-Dominant | CC+TT | 280(55.6) | 270(53.5) | 1 | |||||||||||||||||||||||||||||||||||||||||||||||||||||||||||||||||||||||||||||||||||||||||||||||
| CT | 224(44.4) | 235(46.5) | 0.889(0.682,1.160) | 0.387 | |||||||||||||||||||||||||||||||||||||||||||||||||||||||||||||||||||||||||||||||||||||||||||||||
| rs269183 | Codominant | TT | 394(78.2) | 396(78.4) | 0.5904 | 1 | |||||||||||||||||||||||||||||||||||||||||||||||||||||||||||||||||||||||||||||||||||||||||||||
| CT | 106(21.0) | 103(20.4) | 1.009(0.727,1.399) | 0.959 | |||||||||||||||||||||||||||||||||||||||||||||||||||||||||||||||||||||||||||||||||||||||||||||||
| CC | 4(0.8) | 6(1.2) | 0.580(0.151,2.236) | 0.429 | |||||||||||||||||||||||||||||||||||||||||||||||||||||||||||||||||||||||||||||||||||||||||||||||
| Dominant | TT | 394(78.2) | 396(78.4) | 1 | |||||||||||||||||||||||||||||||||||||||||||||||||||||||||||||||||||||||||||||||||||||||||||||||
| CT+CC | 110(21.8) | 109(21.6) | 0.983(0.713,1.355) | 0.917 | |||||||||||||||||||||||||||||||||||||||||||||||||||||||||||||||||||||||||||||||||||||||||||||||
| Recessive | TT+CT | 500(99.2) | 499(98.8) | 1 | |||||||||||||||||||||||||||||||||||||||||||||||||||||||||||||||||||||||||||||||||||||||||||||||
| CC | 4(0.8) | 6(1.2) | 0.579(0.151,2.229) | 0.427 | |||||||||||||||||||||||||||||||||||||||||||||||||||||||||||||||||||||||||||||||||||||||||||||||
| Over-Dominant | TT+CC | 398(79.0) | 402(79.6) | 1 | |||||||||||||||||||||||||||||||||||||||||||||||||||||||||||||||||||||||||||||||||||||||||||||||
| CT | 106(21.0) | 103(20.4) | 1.015(0.733,1.408) | 0.927 | |||||||||||||||||||||||||||||||||||||||||||||||||||||||||||||||||||||||||||||||||||||||||||||||
| rs269198 | Codominant | CC | 380(75.4) | 384(76.0) | 0.733 | 1 | |||||||||||||||||||||||||||||||||||||||||||||||||||||||||||||||||||||||||||||||||||||||||||||
| CA | 117(23.2) | 114(22.6) | 1.036(0.756,1.459) | 0.826 | |||||||||||||||||||||||||||||||||||||||||||||||||||||||||||||||||||||||||||||||||||||||||||||||
| AA | 7(1.4) | 7(1.4) | 0.934(0.309,2.822) | 0.903 | |||||||||||||||||||||||||||||||||||||||||||||||||||||||||||||||||||||||||||||||||||||||||||||||
| Dominant | CC | 380(75.4) | 384(76.0) | 1 | |||||||||||||||||||||||||||||||||||||||||||||||||||||||||||||||||||||||||||||||||||||||||||||||
| CA+AA | 124(24.6) | 121(24.0) | 1.029(0.757,1.400) | 0.853 | |||||||||||||||||||||||||||||||||||||||||||||||||||||||||||||||||||||||||||||||||||||||||||||||
| Recessive | CC+CA | 497(98.6) | 498(98.6) | 1 | |||||||||||||||||||||||||||||||||||||||||||||||||||||||||||||||||||||||||||||||||||||||||||||||
| AA | 7(1.4) | 7(1.4) | 0.926(0.307,2.793) | 0.892 | |||||||||||||||||||||||||||||||||||||||||||||||||||||||||||||||||||||||||||||||||||||||||||||||
| Over-Dominant | CC+AA | 387(76.8) | 391(77.4) | 1 | |||||||||||||||||||||||||||||||||||||||||||||||||||||||||||||||||||||||||||||||||||||||||||||||
| CA | 117(23.2) | 114(22.6) | 1.037(0.758,1.420) | 0.820 | |||||||||||||||||||||||||||||||||||||||||||||||||||||||||||||||||||||||||||||||||||||||||||||||
| rs34841297 | Codominant | AA | 39(7.7) | 63(12.5) | 0.3673 | 1 | |||||||||||||||||||||||||||||||||||||||||||||||||||||||||||||||||||||||||||||||||||||||||||||
| A- | 223(44.2) | 236(46.7) | 1.502(0.938,2.405) | 0.091 | |||||||||||||||||||||||||||||||||||||||||||||||||||||||||||||||||||||||||||||||||||||||||||||||
| -- | 242(48.0) | 206(40.8) | 1.936(1.208,3.123) | 0.006 | |||||||||||||||||||||||||||||||||||||||||||||||||||||||||||||||||||||||||||||||||||||||||||||||
| Dominant | AA | 39(7.7) | 63(12.5) | 1 | |||||||||||||||||||||||||||||||||||||||||||||||||||||||||||||||||||||||||||||||||||||||||||||||
| A-+-- | 465(92.3) | 442(87.5) | 1.704(1.087,2.672) | 0.020 | |||||||||||||||||||||||||||||||||||||||||||||||||||||||||||||||||||||||||||||||||||||||||||||||
| Recessive | AA+A- | 262(52.0) | 299(59.2) | 1 | |||||||||||||||||||||||||||||||||||||||||||||||||||||||||||||||||||||||||||||||||||||||||||||||
| -- | 242(48.0) | 206(40.8) | 1.388(1.062,1.812) | 0.016 | |||||||||||||||||||||||||||||||||||||||||||||||||||||||||||||||||||||||||||||||||||||||||||||||
| Over-Dominant | AA+-- | 281(55.8) | 269(53.3) | 1 | |||||||||||||||||||||||||||||||||||||||||||||||||||||||||||||||||||||||||||||||||||||||||||||||
| A- | 223(44.2) | 236(46.7) | 0.875(0.671,1.142) | 0.326 | |||||||||||||||||||||||||||||||||||||||||||||||||||||||||||||||||||||||||||||||||||||||||||||||
| rs12546233 | Codominant | AA | 276(54.8) | 242(47.9) | 0.6976 | 1 | |||||||||||||||||||||||||||||||||||||||||||||||||||||||||||||||||||||||||||||||||||||||||||||
| AC | 195(38.7) | 220(43.6) | 0.764(0.578,1.006) | 0.055 | |||||||||||||||||||||||||||||||||||||||||||||||||||||||||||||||||||||||||||||||||||||||||||||||
| CC | 33(6.5) | 43(8.5) | 0.664(0.394,1.119) | 0.124 | |||||||||||||||||||||||||||||||||||||||||||||||||||||||||||||||||||||||||||||||||||||||||||||||
| Dominant | AA | 276(54.8) | 242(47.9) | 1 | |||||||||||||||||||||||||||||||||||||||||||||||||||||||||||||||||||||||||||||||||||||||||||||||
| AC+CC | 228(45.2) | 263(52.1) | 0.747(0.573,0.973) | 0.031 | |||||||||||||||||||||||||||||||||||||||||||||||||||||||||||||||||||||||||||||||||||||||||||||||
| Recessive | AA+AC | 471(93.5) | 462(91.5) | 1 | |||||||||||||||||||||||||||||||||||||||||||||||||||||||||||||||||||||||||||||||||||||||||||||||
| CC | 33(6.5) | 43(8.5) | 0.749(0.451,1.244) | 0.264 | |||||||||||||||||||||||||||||||||||||||||||||||||||||||||||||||||||||||||||||||||||||||||||||||
| Over-Dominant | AA+CC | 309(61.3) | 285(56.4) | 1 | |||||||||||||||||||||||||||||||||||||||||||||||||||||||||||||||||||||||||||||||||||||||||||||||
| aP value of Hardy-Weinberg equilibrium in controls. | |||||||||||||||||||||||||||||||||||||||||||||||||||||||||||||||||||||||||||||||||||||||||||||||||||
| bP value of logistic regression analysis with adjusted for age, age at menarche, menopausal status, number of pregnancies and abortions, breast-feeding status, and family history of BC in first degree relative. | |||||||||||||||||||||||||||||||||||||||||||||||||||||||||||||||||||||||||||||||||||||||||||||||||||
Stratified analysis of the association between MIR2052HG SNPs and breast cancer susceptibility
A stratified analysis was conducted to further explore the relationship between the nine SNPs in the MIR2052HG gene and BC susceptibility. As shown in Table 3, compared with the rs34841297 AA genotype, the A-+-- genotype of rs34841297 in patients age<50 years (OR: 1.998, 95% CI: 1.072-3.723) with an age at menarche<14 years (OR: 2.823, 95% CI: 1.316-6.005) who were non-menopausal (OR: 2.490, 95% CI: 1.288-4.815), had a history of abortion (OR: 2.045, 95% CI: 1.117-3.744), no history of breastfeeding (OR: 3.290, 95% CI: 1.183-3.070) and had family history of tumors in first-degree relatives (OR: 1.905, 95% CI: 1.183-3.070) had an increased risk of BC. However, the CG+GG genotype of rs3802201, the AC+CC genotype of rs2553716, the AG+GG genotype of rs4259395, the rs2588297 GT+TT genotype, the CT+TT genotype of rs10957736 and the AC+CC genotype of rs12546233 were all found to exert a protective effect on the BC risk.
Table 3. Stratification analysis of the nine SNPs and BC susceptibility.
| rs3802201(CG+GG/CC) OR(95%CI) | Pa | rs2553716(AC+CC/AA) OR(95%CI) | Pa | rs4259395(AG+GG/AA) OR(95%CI) | Pa | ||||||||||||||||||||||||||||||||||||||||||||||||||||||||||||||||||||||||||||||||||||||||||||||
| age | |||||||||||||||||||||||||||||||||||||||||||||||||||||||||||||||||||||||||||||||||||||||||||||||||||
| <50 | 0.845(0.599,1.193) | 0.339 | 0.822(0.583,1.160) | 0.266 | 0.908(0.638,1.293) | 0.749 | |||||||||||||||||||||||||||||||||||||||||||||||||||||||||||||||||||||||||||||||||||||||||||||
| ≥50 | 0.718(0.466,1.106) | 0.133 | 0.704(0.457,1.085) | 0.112 | 0.622(0.395,0.979) | 0.040 | |||||||||||||||||||||||||||||||||||||||||||||||||||||||||||||||||||||||||||||||||||||||||||||
| Age at menarche | |||||||||||||||||||||||||||||||||||||||||||||||||||||||||||||||||||||||||||||||||||||||||||||||||||
| <14 | 0.817(0.532,1.253) | 0.354 | 0.844(0.550,1.294) | 0.436 | 0.813(0.515,1.285) | 0.376 | |||||||||||||||||||||||||||||||||||||||||||||||||||||||||||||||||||||||||||||||||||||||||||||
| ≥14 | 0.736(0.523,1.035) | 0.078 | 0.686(0.488,0.965) | 0.031 | 0.752(0.527,1.072) | 0.115 | |||||||||||||||||||||||||||||||||||||||||||||||||||||||||||||||||||||||||||||||||||||||||||||
| Menopausal state | |||||||||||||||||||||||||||||||||||||||||||||||||||||||||||||||||||||||||||||||||||||||||||||||||||
| Pre-menopausal | 0.770(0.542,1.092) | 0.142 | 0.750(0.528,1.064) | 0.106 | 0.822(0.570,1.185) | 0.293 | |||||||||||||||||||||||||||||||||||||||||||||||||||||||||||||||||||||||||||||||||||||||||||||
| Post-menopausal | 0.760(0.499,1.158) | 0.202 | 0.749(0.491,1.141) | 0.178 | 0.690(0.930,2.257) | 0.101 | |||||||||||||||||||||||||||||||||||||||||||||||||||||||||||||||||||||||||||||||||||||||||||||
| Age at menopause | |||||||||||||||||||||||||||||||||||||||||||||||||||||||||||||||||||||||||||||||||||||||||||||||||||
| <45 | 0.945(0.224,3.987) | 0.938 | 0.945(0.224,3.987) | 0.938 | 0.784(0.172,3.571) | 0.753 | |||||||||||||||||||||||||||||||||||||||||||||||||||||||||||||||||||||||||||||||||||||||||||||
| ≥45 | 0.725(0.463,1.135) | 0.160 | 0.709(0.453,1.110) | 0.133 | 0.678(0.424,1.085) | 0.105 | |||||||||||||||||||||||||||||||||||||||||||||||||||||||||||||||||||||||||||||||||||||||||||||
| No. of pregnancies | |||||||||||||||||||||||||||||||||||||||||||||||||||||||||||||||||||||||||||||||||||||||||||||||||||
| <3 | 0.854(0.572,1.273) | 0.438 | 0.861 (0.577,1.283) | 0.462 | 0.882(0.583,1.333) | 0.551 | |||||||||||||||||||||||||||||||||||||||||||||||||||||||||||||||||||||||||||||||||||||||||||||
| ≥3 | 0.759(0.536,1.074) | 0.120 | 0.702(0.495,0.994) | 0.046 | 0.688(0.473,1.003) | 0.052 | |||||||||||||||||||||||||||||||||||||||||||||||||||||||||||||||||||||||||||||||||||||||||||||
| History of abortion | |||||||||||||||||||||||||||||||||||||||||||||||||||||||||||||||||||||||||||||||||||||||||||||||||||
| no | 0.667(0.429,1.036) | 0.071 | 0.665(0.429,1.033) | 0.069 | 0.715(0.448,1.142) | 0.160 | |||||||||||||||||||||||||||||||||||||||||||||||||||||||||||||||||||||||||||||||||||||||||||||
| yes | 0.834(0.598,1.164) | 0.286 | 0.789(0.572,1.113) | 0.183 | 0.721(0.507,1.023) | 0.067 | |||||||||||||||||||||||||||||||||||||||||||||||||||||||||||||||||||||||||||||||||||||||||||||
| Breast-feeding | |||||||||||||||||||||||||||||||||||||||||||||||||||||||||||||||||||||||||||||||||||||||||||||||||||
| no | 1.773(0.971,3.237) | 0.062 | 1.959(1.072,3.581) | 0.029 | 0.670(0.357,1.260) | 0.214 | |||||||||||||||||||||||||||||||||||||||||||||||||||||||||||||||||||||||||||||||||||||||||||||
| yes | 1.230(0.913,1.657) | 0.174 | 1.235(0.917,1.664) | 0.165 | 0.779(0.570,1.064) | 0.116 | |||||||||||||||||||||||||||||||||||||||||||||||||||||||||||||||||||||||||||||||||||||||||||||
| Family history | |||||||||||||||||||||||||||||||||||||||||||||||||||||||||||||||||||||||||||||||||||||||||||||||||||
| no | 0.717(0.544,0.944) | 0.018 | 0.691(0.524,0.910) | 0.009 | 0.738(0.554,0.985) | 0.039 | |||||||||||||||||||||||||||||||||||||||||||||||||||||||||||||||||||||||||||||||||||||||||||||
| yes | 1.594(0.542,4.691) | 0.397 | 1.838(0.615,5.495) | 0.276 | 0.965(0.291,3.199) | 0.953 | |||||||||||||||||||||||||||||||||||||||||||||||||||||||||||||||||||||||||||||||||||||||||||||
| rs2588297(GT+TT/GG) OR(95%CI) | Pa | rs10957736(CT+TT/CC) OR(95%CI) | Pa | rs269183(CT+CC/TT) OR(95%CI) | Pa | ||||||||||||||||||||||||||||||||||||||||||||||||||||||||||||||||||||||||||||||||||||||||||||||
| age | |||||||||||||||||||||||||||||||||||||||||||||||||||||||||||||||||||||||||||||||||||||||||||||||||||
| <50 | 0.671(0.468,0.963) | 0.030 | 0.934(0.658,1.326) | 0.703 | 1.098(0.730,1.649) | 0.654 | |||||||||||||||||||||||||||||||||||||||||||||||||||||||||||||||||||||||||||||||||||||||||||||
| ≥50 | 0.583(0.373,0.911) | 0.018 | 0.605(0.392,0.932) | 0.023 | 0.795(0.453,1.396) | 0.425 | |||||||||||||||||||||||||||||||||||||||||||||||||||||||||||||||||||||||||||||||||||||||||||||
| Age at menarche | |||||||||||||||||||||||||||||||||||||||||||||||||||||||||||||||||||||||||||||||||||||||||||||||||||
| <14 | 0.651(0.417,1.019) | 0.060 | 0.915(0.592,1.414) | 0.688 | 0.798(0.481,1.323) | 0.381 | |||||||||||||||||||||||||||||||||||||||||||||||||||||||||||||||||||||||||||||||||||||||||||||
| ≥14 | 0.580(0.407,0.828) | 0.003 | 0.704(0.500,0.990) | 0.043 | 1.203(0.785,1.845) | 0.396 | |||||||||||||||||||||||||||||||||||||||||||||||||||||||||||||||||||||||||||||||||||||||||||||
| Menopausal state | |||||||||||||||||||||||||||||||||||||||||||||||||||||||||||||||||||||||||||||||||||||||||||||||||||
| Pre-menopausal | 0.583(0.403,0.844) | 0.004 | 0.840(0.589,1.197) | 0.334 | 1.068(0.707,1.614) | 0.755 | |||||||||||||||||||||||||||||||||||||||||||||||||||||||||||||||||||||||||||||||||||||||||||||
| Post-menopausal | 0.679(0.439,1.048) | 0.080 | 0.700(0.459,1.066) | 0.097 | 0.860(0.496,1.492) | 0.592 | |||||||||||||||||||||||||||||||||||||||||||||||||||||||||||||||||||||||||||||||||||||||||||||
| Age at menopause | |||||||||||||||||||||||||||||||||||||||||||||||||||||||||||||||||||||||||||||||||||||||||||||||||||
| <45 | 1.787(0.416,7.670) | 0.435 | 1.667(0.404,6.880) | 0.480 | 1.226(0.194,7.738) | 0.828 | |||||||||||||||||||||||||||||||||||||||||||||||||||||||||||||||||||||||||||||||||||||||||||||
| ≥45 | 0.599(0.376,0.953) | 0.031 | 0.633(0.404,0.992) | 0.046 | 0.837(0.462,1.516) | 0.558 | |||||||||||||||||||||||||||||||||||||||||||||||||||||||||||||||||||||||||||||||||||||||||||||
| No. of pregnancies | |||||||||||||||||||||||||||||||||||||||||||||||||||||||||||||||||||||||||||||||||||||||||||||||||||
| <3 | 0.597(0.397,0.912) | 0.017 | 0.783(0.524,1.168) | 0.230 | 1.038(0.633,1.702) | 0.884 | |||||||||||||||||||||||||||||||||||||||||||||||||||||||||||||||||||||||||||||||||||||||||||||
| ≥3 | 0.638(0.446,0.912) | 0.014 | 0.708(0.498,1.005) | 0.054 | 0.866(0.573,1.307) | 0.492 | |||||||||||||||||||||||||||||||||||||||||||||||||||||||||||||||||||||||||||||||||||||||||||||
| Abortion | |||||||||||||||||||||||||||||||||||||||||||||||||||||||||||||||||||||||||||||||||||||||||||||||||||
| no | 0.468(0.296,0.739) | 0.001 | 0.619(0.398,0.961) | 0.032 | 1.181(0.698,1.998) | 0.534 | |||||||||||||||||||||||||||||||||||||||||||||||||||||||||||||||||||||||||||||||||||||||||||||
| yes | 0.717(0.508,1.013) | 0.059 | 0.795(0.56,1.113) | 0.181 | 0.800(0.528,1212) | 0.293 | |||||||||||||||||||||||||||||||||||||||||||||||||||||||||||||||||||||||||||||||||||||||||||||
| Breast-feeding | |||||||||||||||||||||||||||||||||||||||||||||||||||||||||||||||||||||||||||||||||||||||||||||||||||
| no | 0.515(0.271,0.978) | 0.043 | 0.730(0.397,1.342) | 0.311 | 0.990(0.492,1.994) | 0.979 | |||||||||||||||||||||||||||||||||||||||||||||||||||||||||||||||||||||||||||||||||||||||||||||
| yes | 0.623(0.457,0.850) | 0.003 | 0.775(0.575,1.045) | 0.094 | 0.989(0.687,1.425) | 0.953 | |||||||||||||||||||||||||||||||||||||||||||||||||||||||||||||||||||||||||||||||||||||||||||||
| Family history | |||||||||||||||||||||||||||||||||||||||||||||||||||||||||||||||||||||||||||||||||||||||||||||||||||
| no | 0.551(0.412,0.737) | 0.000 | 0.751(0.570,0.991) | 0.043 | 1.028(0.736,1.437) | 0.870 | |||||||||||||||||||||||||||||||||||||||||||||||||||||||||||||||||||||||||||||||||||||||||||||
| yes | 1.877(0.635,5.550) | 0.255 | 0.768(0.256,2.309) | 0.639 | 0.559(0.165,1.896) | 0.351 | |||||||||||||||||||||||||||||||||||||||||||||||||||||||||||||||||||||||||||||||||||||||||||||
| rs269198(CA+AA/CC) OR(95%CI) | Pa | rs34841297(A-+--/AA) OR(95%CI) | Pa | rs12546233(CC+AC/AA) OR(95%CI) | Pa | ||||||||||||||||||||||||||||||||||||||||||||||||||||||||||||||||||||||||||||||||||||||||||||||
| age | |||||||||||||||||||||||||||||||||||||||||||||||||||||||||||||||||||||||||||||||||||||||||||||||||||
| <50 | 1.015(0.909,1.132) | 0.795 | 1.998(1.072,3.723) | 0.029 | 0.809(0.572,1.145) | 0.231 | |||||||||||||||||||||||||||||||||||||||||||||||||||||||||||||||||||||||||||||||||||||||||||||
| ≥50 | 0.864(0.508,1.471) | 0.591 | 1.479(0.737,2.969) | 0.271 | 0.718(0.467,1.10) | 0.131 | |||||||||||||||||||||||||||||||||||||||||||||||||||||||||||||||||||||||||||||||||||||||||||||
| Age at menarche | |||||||||||||||||||||||||||||||||||||||||||||||||||||||||||||||||||||||||||||||||||||||||||||||||||
| <14 | 0.990(0.614,1.597) | 0.967 | 2.823(1.316,6.055) | 0.008 | 0.881(0.573,1.353) | 0.562 | |||||||||||||||||||||||||||||||||||||||||||||||||||||||||||||||||||||||||||||||||||||||||||||
| ≥14 | 1.133(0.752,1.709) | 0.550 | 1.220(0.679,2.191) | 0.506 | 0.699(0.496,0.984) | 0.040 | |||||||||||||||||||||||||||||||||||||||||||||||||||||||||||||||||||||||||||||||||||||||||||||
| Menopausal state | |||||||||||||||||||||||||||||||||||||||||||||||||||||||||||||||||||||||||||||||||||||||||||||||||||
| Pre-menopausal | 1.145(0.767,1.709) | 0.508 | 2.490(1.288,4.815) | 0.007 | 0.720(0.506,1.024) | 0.067 | |||||||||||||||||||||||||||||||||||||||||||||||||||||||||||||||||||||||||||||||||||||||||||||
| Post-menopausal | 0.855(0.509,1.438) | 0.555 | 1.063(0.546,2.070) | 0.858 | 0.857(0.563,1.305) | 0.472 | |||||||||||||||||||||||||||||||||||||||||||||||||||||||||||||||||||||||||||||||||||||||||||||
| Age at menopause | |||||||||||||||||||||||||||||||||||||||||||||||||||||||||||||||||||||||||||||||||||||||||||||||||||
| <45 | 0.725(0.126,4.158) | 0.718 | 0.333(0.027,4.106) | 0.391 | 1.689(0.406,7.026) | 0.471 | |||||||||||||||||||||||||||||||||||||||||||||||||||||||||||||||||||||||||||||||||||||||||||||
| ≥45 | 0.896(0.514,1.562) | 0.700 | 1.214(0.592,2.487) | 0.597 | 0.799(0.510,1.250) | 0.325 | |||||||||||||||||||||||||||||||||||||||||||||||||||||||||||||||||||||||||||||||||||||||||||||
| No. of pregnancies | |||||||||||||||||||||||||||||||||||||||||||||||||||||||||||||||||||||||||||||||||||||||||||||||||||
| <3 | 1.035(0.646,1.658) | 0.888 | 1.728(0.889,3.358) | 0.107 | 0.688(0.460,1.030) | 0.069 | |||||||||||||||||||||||||||||||||||||||||||||||||||||||||||||||||||||||||||||||||||||||||||||
| ≥3 | 0.918(0.616,1.368) | 0.674 | 1.573(0.861,2.876) | 0.141 | 0.750(0.530,1.060) | 0.103 | |||||||||||||||||||||||||||||||||||||||||||||||||||||||||||||||||||||||||||||||||||||||||||||
| Abortion | |||||||||||||||||||||||||||||||||||||||||||||||||||||||||||||||||||||||||||||||||||||||||||||||||||
| no | 1.164(0.707,1.918) | 0.550 | 1.218(0.608,2.438) | 0.578 | 0.517(0.333,0.804) | 0.003 | |||||||||||||||||||||||||||||||||||||||||||||||||||||||||||||||||||||||||||||||||||||||||||||
| yes | 0.865(0.580,1.289) | 0.475 | 2.045(1.117,3.744) | 0.020 | 0.889(0.637,1.240) | 0.488 | |||||||||||||||||||||||||||||||||||||||||||||||||||||||||||||||||||||||||||||||||||||||||||||
| Breast-feeding | |||||||||||||||||||||||||||||||||||||||||||||||||||||||||||||||||||||||||||||||||||||||||||||||||||
| no | 1.124(0.570,2.216) | 0.735 | 3.290(1.142,9.476) | 0.027 | 0.650(0.357,1.182) | 0.158 | |||||||||||||||||||||||||||||||||||||||||||||||||||||||||||||||||||||||||||||||||||||||||||||
| yes | 0.995(0.702,1.410) | 0.976 | 1.504(0.902,2.510) | 0.118 | 0.785(0.583,1.057) | 0.111 | |||||||||||||||||||||||||||||||||||||||||||||||||||||||||||||||||||||||||||||||||||||||||||||
| Family history | |||||||||||||||||||||||||||||||||||||||||||||||||||||||||||||||||||||||||||||||||||||||||||||||||||
| no | 1.063(0.771,1.464) | 0.710 | 0.627(0.103,3.820) | 0.613 | 0.737(0.560,0.971) | 0.030 | |||||||||||||||||||||||||||||||||||||||||||||||||||||||||||||||||||||||||||||||||||||||||||||
| yes | 0.661(0.199,2.192) | 0.498 | 1.905(1.183,3.070) | 0.008 | 0.943(0.323,2.754) | 0.914 | |||||||||||||||||||||||||||||||||||||||||||||||||||||||||||||||||||||||||||||||||||||||||||||
| aP values adjusted for age, menarche age, menopausal status, number of pregnancies, number of abortions, history of breast feeding, and family history of breast cancer in first-degree relatives in logistic regression analysis (except for stratification factors). | |||||||||||||||||||||||||||||||||||||||||||||||||||||||||||||||||||||||||||||||||||||||||||||||||||
The distributions of hormone receptor status (ER, PR and HER-2) and molecular subtypes (triple-negative, Her-2 overexpression and luminal) of patients with BC presenting different SNP genotypes are shown in Supplementary Tables 4 and 5, respectively. The rs269183 T>C variant was associated with Her-2 receptor positive and Her-2 overexpressing BC. The rs269198 C>A variant reduces the risk of Her-2-overexpressing BC. The GG genotype of rs4259395 was related to the PR receptor-positive BC, and the TT genotype of rs2588297 was related to the Luminal-type BC. SNPs rs3802201 C>G and rs2553716 A>C were both associated with PR positivity and luminal BC. In addition, the rs12546233 AC+CC genotype was associated with triple-negative BC and the AA genotype was associated with Her-2-overexpression BC.
False positive report probability (FPRP)
FPRP analysis [20] was used to evaluate the reliability of the positive results for MIR2052HG SNPs associated with BC susceptibility. As presented in Supplementary Table 6, when the critical value of FPRP was set to 0.5 and prior probability was 0.25, the FPRP values of all positive results for SNPs rs2553716, rs269183, rs269198, and rs12546233 were lower than the critical value. A possible association between the SNPs and the risk of BC was observed, which was worthy of further research and verification.
Haplotype analysis
Haplotype analysis was used to test the combined effect of MIR2052HG SNPs (Supplementary Table 7). Haplotype Crs3802201Ars2553716Ars4259395Grs2588297Crs10957736Trs269183Crs269198 Wrs34841297Ars12546233 was the highest frequency haplotype, and individuals with this haplotype have an increased risk of BC (OR: 1.203, 95% CI: 1.001-1.445), while Haplotype Grs3802201Crs2553716Grs4259395Trs2588297 Trs10957736 Trs269183Crs269198Mrs34841297 Ars12546233 and haplotype Grs3802201Crs2553716Grs4259395Trs2588297Trs10957736Trs269183Crs269198Mrs34841297Crs12546233 were associated with a low risk of BC (OR: 0.258, 95 %CI: 0.073-0.908; OR: 0.698, 95% CI: 0.549-0.887, respectively).
Multifactor dimensionality reduction
MDR software (multifactor dimensionality reduction 3.0.2) was used to analyze the interaction of genes and reproductive factors. As shown in Table 4, there was an interaction with the rs34841297 - (homozygous deletion) of A genotype, non-menopausal status, and no history of breastfeeding was observed, furthermore, the interaction model revealed a higher risk of BC (OR: 1.771, 95% CI: 1.367-2.941, P<0.001).
Table 4. Interaction results between MIR2052HG SNPs and reproductive factors.
| Model | TBAa | CVCb | χ2 | P | OR(95%CI) | ||||||||||||||||||||||||||||||||||||||||||||||||||||||||||||||||||||||||||||||||||||||||||||||
| Pre-menopausal, no breast-feeding | 0.4966 | 3/10 | 10.061 | 0.002 | 1.543(1.180,2.018) | ||||||||||||||||||||||||||||||||||||||||||||||||||||||||||||||||||||||||||||||||||||||||||||||
| Pre-menopausal, no breast-feeding, rs34841297 | 0.5313 | 7/10 | 18.883 | <0.001 | 1.771(1.367,2.941) | ||||||||||||||||||||||||||||||||||||||||||||||||||||||||||||||||||||||||||||||||||||||||||||||
| aTesting balance accuracy. | |||||||||||||||||||||||||||||||||||||||||||||||||||||||||||||||||||||||||||||||||||||||||||||||||||
| bCross-validation consistency. | |||||||||||||||||||||||||||||||||||||||||||||||||||||||||||||||||||||||||||||||||||||||||||||||||||
Real-time PCR results
The MIR2052HG expression levels in individuals with the rs34841297 --, A- and AA genotypes were shown in Figure 1A. The relative expression in individuals with the homozygous deletion genotype (1.68±1.37) was significantly higher than that in individuals with the heterozygous deletion genotype (0.94±0.95) (P=0.011) and AA genotype (0.26±0.12) (P<0.001). In addition, the relative expression of MIR2052HG in individuals with a homozygous deletion of rs34841297 was significantly higher than that of individuals with the AA genotype (P=0.001).
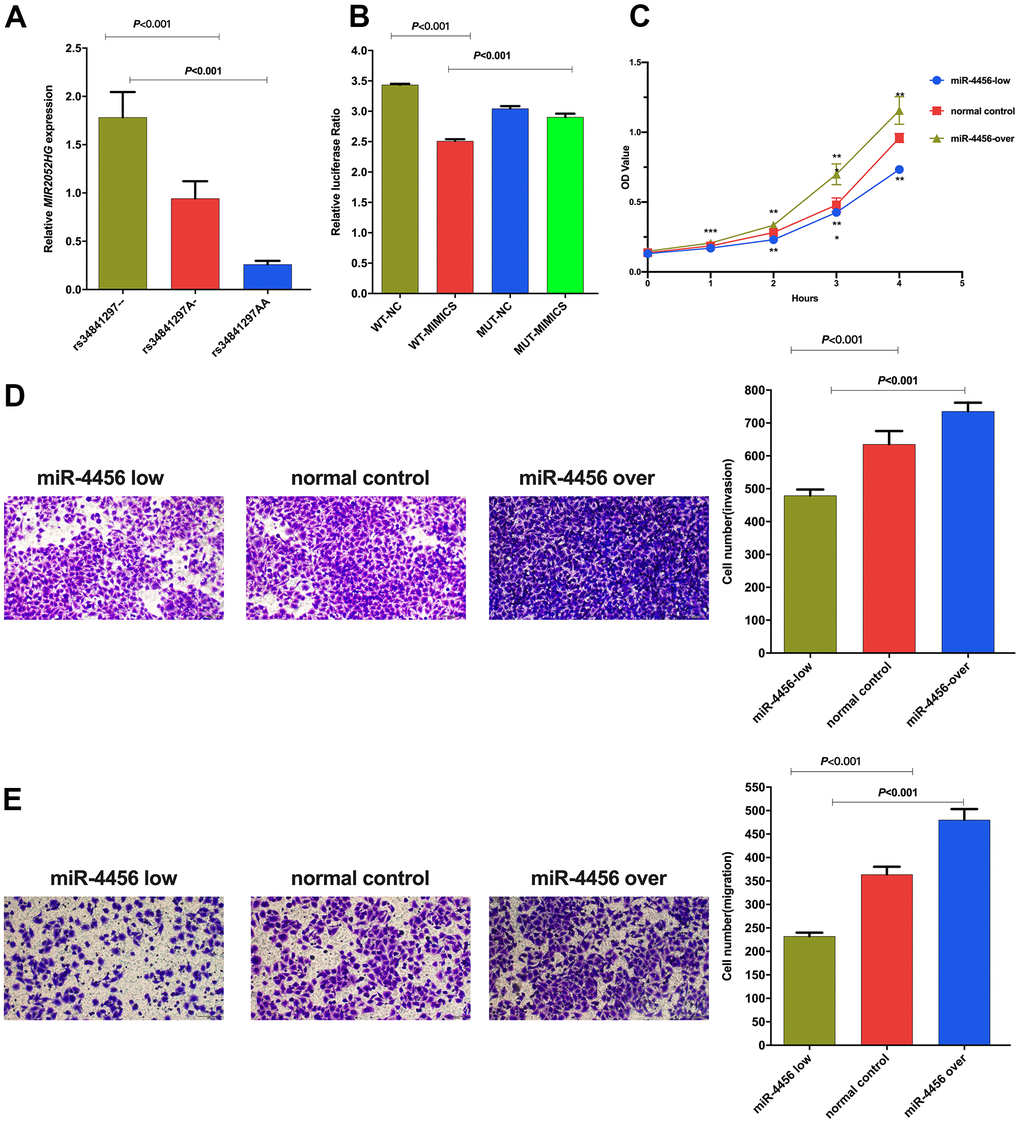
Figure 1. (A) Relative expression of LncRNA MIR2052HG in different genotypes of rs34841297. (B) The relative fluorescence value of different experimental groups in the dual luciferase report experiment. WT-NC: rs34841297 wild plasmids-Normal Control mimics, WT-MIMIC: rs34841297 wild plasmids-miR-4456 mimics, MUT-NC: rs34841297 mutant plasmids-Normal Control mimics, MUT-MIMIC: rs34841297 mutant plasmids-miR-4456 mimics. (C) The effect of miR-4456 combined with MIR2052HG on the proliferation of breast cancer cells (0-96h). *represents P<0.05; **represents P<0.01; ***represents P<0.001. (D) Transwell experiment explores the effect of miR-4456 combined with MIR2052HG on the invasion ability of MDA-MB-231 cells. (E) Transwell experiment explores the effect of miR-4456 combined with MIR2052HG on the migration ability of MDA-MB-231 cells.
Dual-luciferase reporter assays
A dual-luciferase reporter assay was performed in 293T cells to determine the biological association between rs34841297 and miR-4456. As shown in Figure 1B, the relative luciferase activity of the rs34841297 W-NC group was significantly higher than rs34841297 W-miR-4456 group (P<0.001), suggesting an interaction between the rs34841297 wild genotype plasmid vector and miR-4456. Meanwhile, the relative luciferase activity of the rs34841297 W-miR-4456 group was lower than the rs34841297 MUT-miR-4456 group (P<0.001), showing that the interaction between the plasmid vector of MIR2052HG and miR-4456 disappeared due to the deletion of the rs34841297 A allele.
The effect of miR-4456 combined with MIR2052HG on cell proliferation, invasion and migration
The relative expression of MIR2052HG and miR-4456 in MDA-MB-231 cells (2.02±0.34, 3.95±0.65) were both higher than that in MCF10A cells (0.92±0.08, 1.17±0.79), and the differences were statistically significant (Supplementary Figure 1).
qRT–PCR was performed to detect the relative expression of miR-4456 in BC cells (MDA-MB-231) stably transfected with three lentiviruses. The results of the CCK-8 test are shown in Figure 1C. In the MDA-MB-231 cells, the OD values for the miR-4456 low-expression group at 24 h (P<0.001), 48 h (P=0.001), 72 h (P<0.001) and 96 h (P=0.002) were lower than those of the NC group, and the OD values for the miR-4456 overexpression group at 24 h (P<0.001), 48 h (P=0.005), 72 h (P<0.001) and 96 h (P=0.001) were higher than those of the NC group. Then, the number of cells passing through the Matrigel-covered Transwell chamber was observed to determine the ability of miR-4456 to modulate the invasion of MDA-MB-231 cells. The results presented in Figure 1D showed that the number of invading MDA-MB-231 cells in the miR-4456 low-expression group was lower than that in the NC group (P<0.001), and the number of invading MDA-MB-231 cells in the miR-4456 overexpression group was higher than that in the NC group (P=0.002). Finally, Transwell experiments were performed to explore the migration ability of BC cells with different miR-4456 expression levels. As presented in Figure 1E, the number of migrating MDA-MB-231 cells in the miR-4456 low-expression group MDA-MB-231 was lower than that in the NC group (P=0.004), and the number of migrating MDA-MB-231 cells in the miR-4456 overexpression group MDA-MB-231 was higher than that in the NC group (P=0.022).
Discussion
In the present study, six SNPs rs3802201 (C>G), rs2553716 (A>C), rs4259395 (A>G), rs2588297 (G>T), rs10957736 (C>T) and rs12546233 (A>C), reduced the risk of BC. Among them, the rs3802201 (C>G) mutation reduces the risk of breast cancer, which corresponds with the study by Wang L et al. [19]. However, the rs34841297 gene polymorphism was positively correlated with the incidence of BC, and rs34841297 A gene deletion might increase the risk of BC. Furthermore, the associations between nine MIR2052HG SNPs and the BC receptor status (ER, PR, Her-2) were analyzed. Estrogen receptor (ER) can regulate normal breast epithelial cells and breast gland proliferation of cancer cells [21, 22]. Progesterone receptor (PR) was a member of the nuclear receptor superfamily of transcription factors that has the biological function of promoting functional recovery and reducing the volume of BC lesions [23]. Human epidermal growth factor receptor 2 (Her-2), as a marker for predicting the prognosis of BC, was regarded as the key to evaluating the efficacy of targeted drugs [16]. Our results indicated that rs3802201, rs2553716 and rs4259395 may exert a protective effect on BC by affecting PR receptor status. The CT+CC genotype of rs269183 was related to Her-2 receptor status and may affect the prognosis of BC. MDR model results showed that with rs34841297, homozygous deletion of the A gene, a non-menopausal status and no history of breastfeeding resulted in a higher risk of BC, which might lead to an increased risk of BC.
MIR2052HG downregulation expression was reported to reduce ERα-positive BC cell growth [24]. Genetic variations in MIR2052HG were associated with the BC-free interval in the MA.27 trial (ClinicalTrials.gov number NCT00066573), and the variant SNPs were associated with increased MIR2052HG expression due to increased ERα binding to EREs [17, 25]. What’s more, researchers have discovered that SNPs could mediate the occurrence of cancer by affecting the secondary structure and expression of lncRNAs and the biological effects mediated by the interactions between lncRNAs and miRNAs [26–28]. Here, we performed qRT–PCR to explore the total expression of MIR2052HG expression in individuals with different genotypes of rs34841297. A dual-luciferase reporter gene experiment was conducted to identify whether the rs34841297 A/- deletion mutation affects the binding ability of MIR2052HG to miR-4456. An interaction was observed between MIR2052HG and miR-4456 mimics when rs34841297 carried wild-type A allele, and the interaction disappeared with the deletion of the A allele, consistent with the results predicted by the LncRNASNP2 and DINAN websites. This result suggested that the rs34841297 polymorphism might affect the MIR2052HG and miR-4456 interaction.
MiRNAs are small noncoding RNAs of approximately 22 nucleotides in length that perform posttranscriptional regulatory functions by binding to specific sites on the target transcript [29]. miR-4456 is a tiny noncoding RNA located on chromosome 5 that putatively influences oxytocin signaling [30]. To date, no studies have reported the relationship between miR-4456 and cancer. Our study proposed the hypothesis that the effect of the lncRNA MIR2052HG on BC occurrence and development is based on the interaction of MIR2052HG and miR-4456 mediated by rs34841297. CCK-8, Transwell and scratch wound experiments were performed using MDA-MB-231 cells. Compared with the normal control group, the proliferation ability of MDA-MB-231 cells with high miR-4456 expression was significantly increased. The Transwell assays using MDA-MB-231 cells found that compared with the normal control group, the ability of cells with high miR-4456 expression to migrate through the chamber and invade the Matrigel-coated Transwell chamber was significantly increased. Based on these experiments, we preliminarily suggested that the lncRNA MIR2052HG might mediate the binding of miR-4456 through rs34841297 to affect the proliferation, invasion and metastasis of BC.
This study is the first to explore the association between genetic variants in the lncRNA MIR2052HG and BC susceptibility. This study has several advantages. First, the patients included in our study were all newly diagnosed and the controls were selected according to the frequency matching, which might reduce the selection bias in the study. Second, SNPscan high-throughput typing technology was used to SNP typing, making the results more accurate and credible than traditional restriction fragment length polymorphism (PCR-RFLP) typing technology. Finally, genotyping of all SNPs was performed on 10% of randomly selected samples for sequencing verification. Additionally, all cell function experiments were repeated more than three times, which improved the authenticity and reliability of the study results. Nevertheless, this study still has some limitations. All the subjects included in this study were of the Chinese Han population, and further studies of other populations should be performed to verify our results. In addition, the mechanism by which MIR2052HG SNPs modulate BC must be further explored in vivo.
Conclusions
In conclusion, the study reveals the association between the MIR2052HG gene polymorphism and the occurrence of BC. The MIR2052HG rs34841297 A/-- variant may affect the binding of miR-4456 to MIR2052HG and subsequently alter proliferation, invasion and migration of BC cells by regulating the expression of miR-4456 expression, which provides a baseline information for screening high-risk population populations for BC and formulating individualized preventive measures.
Materials and Methods
Research sample
Based on a case-control study design, 504 new BC samples that were pathologically confirmed were collected from March 2016 to December 2018. All patients were recruited from the top three hospitals in Henan Province. Through frequency matching to patients by age (±2 years), 505 healthy control samples were obtained from the biological sample bank of Henan Key Laboratory of Oncology Epidemiology. The basic information and clinical characteristics of the patients included age, age at menarche, menopausal status, menopausal age, number of pregnancies, number of abortions, history of breastfeeding and family history of BC. Moreover, information on patients’ hormone receptor status including estrogen receptor (ER), progesterone receptor (PR) and human epidermal growth factor receptor-2 (HER-2) was also acquired. The study was approved by the Ethics Review Committee of the Ethics Committee of Medical and Health Research of Zhengzhou University, Zhengzhou, Henan, China.
DNA extraction, SNP selection and genotyping
Sample DNA was extracted using a DNA Extraction Kit (Shanghai Laifeng Biotechnology Co., Ltd.) according to the manufacturer’s instructions and stored at -80° C until use. The MIR2052HG SNPs were screened using Ensembl38, Ensembl37, NCBI 1000 Genomes and Haploview software, with a minor allele frequency (MAF)>0.05 in Chinese Han population. Finally, 9 SNPs in functional regulatory regions SNPs and tag SNPs were determined, and the basic information was presented in Supplementary Table 1. RNAfold was used to predict the secondary structure of the significant SNPs. LncRNASNP2 and DIANA were used to predict the binding capacity of miRNAs that SNPs might affect (Supplementary Table 2). Combined with the Δ Energy, correlation with BC, and site prediction intersection results, miR-4456 was selected for further functional research. All SNPs were genotyped with SNPscan™ multiple SNP typing kit.
Quantitative real-time PCR (qRT–PCR)
Plasma RNA was extracted from 72 randomly selected healthy controls with TRIzol reagent, DNA was removed and RNA was reverse transcribed into cDNA. The relative expression of MIR2052HG in individuals carrying the rs34841297 polymorphism was detected using qRT–PCR with SYBR-green among individuals with different genotypes of rs34841297, and GAPDH served as the endogenous control. All samples were analyzed in triplicate, and the relative expression was calculated using the method of 2-ΔCt method. The sequences of primers used in this study were listed in Supplementary Table 3.
Dual-luciferase report assay
According to LncRNASNP2, carried with wild-type MIR2052HG-rs34841297 might gain a binding site for miR-4456, and the dual-luciferase assay verified the biological association between rs34841297 and miR-4456. Following the construction of the MIR2052HG rs34841297 wild-type and mutant pmirGLO plasmids, cotransfected HEK 293T cells with miR-4456 mimic or normal control (NC) mimics by using the riboFECT™ CP kit. Firefly fluorescence activity and Renilla fluorescence activity in each group were detected 72 hours after transfection, and relative luciferase activity was calculated based on firefly/Renilla fluorescence.
Cytological function experiment
qRT–PCR experiments first detected the relative expression of MIR2052HG and miR-4456 in MDA-MB-231 cells and MCF10A cells. The relative expression was calculated using the method of 2-ΔΔCt method. The sequences of MIR2052HG primers used in this study were listed in Supplementary Table 3. And the sequences of miR-4456 and U6 internal reference primers are shown in Supplementary Table 8.
BC cells (MDA-MB-231) stably transfected with low-expression, overexpression and negative control (NC) lentiviral vectors carrying miR-4456 were established. Then, the stably transfected cell line was used for CCK-8 experiments and Transwell experiments to detect the proliferation, invasion and migration ability of BC cells with different miR-4456 expression levels.
Statistical analysis
Unconditional logistic regression analysis was used to explore BC-related MIR2052HG SNPs and adjusted for age, menarche age, menopausal status, number of pregnancies, number of abortions, breastfeeding history, and family history. SHEsis online software was applied to conduct the haplotype analysis of MIR2052HG. Multifactor dimensionality reduction (MDR) was used to analyze the interaction between genes and the environment. Independent t tests were applied to compare the relative expression of the lncRNA MIR2052HG with different rs34841297 genotypes, and the false-positive report probability (FPRP) [20] analysis was conducted to verify the positive results and the cut-off value to ensure the reliability and accuracy of the positive results. A t test was used to compare the OD values from the CCK8 experiment among groups with low expression of miR-4456 and the high expression of miR-4456 and the NC group. Independent t tests were used to analyze the accurate counts of stained cells in the two groups obtained in Transwell experiments. Differences in invasion and migration capabilities were calculated using t tests. All data analysis and cell number statistical analyses in this study were performed using SPSS 21.0(t-test, χ2 test and unconditional logistic regression model analysis), ImageJ (calculate scratch healing area, Transwell migration and invasion cell count), and GraphPad Prism 7.0(plot the calculation results). Two-sided P<0.05 was statistically significant.
Informed consent
Informed consent was obtained from all individual participants included in the study.
Ethical approval
All procedures performed in studies involving human participants were in accordance with the ethical standards of the institutional and/or national research committee and with the 1964 Helsinki declaration and its later amendments or comparable ethical standards.
Author Contributions
CH S and LP X conceived of the study, participated in its design and helped to draft the manuscript. H Y carried out the molecular genetic studies, performed the statistical analysis, participated in the cell experiment and drafted the manuscript. QY S, FF C, XR J, YL W, KD X and YL Z revised the manuscript. All authors read and approved the final manuscript.
Acknowledgments
The authors thank the participants, the coordinators, and administrators for their supports during the study.
Conflicts of Interest
The authors declare no conflicts of interest.
Funding
This work was supported by Henan university science and technology innovation talents support program (19HASTIT005); Medical Science and Technology key projects of Henan Province and Zhengzhou (192102310088, 19A32000820, SBGJ2018089). The National Natural Science Foundation of China (U1604168).
References
- 1. Erratum: Global cancer statistics 2018: GLOBOCAN estimates of incidence and mortality worldwide for 36 cancers in 185 countries. CA Cancer J Clin. 2020; 70:313. https://doi.org/10.3322/caac.21609 [PubMed]
- 2. Harbeck N, Penault-Llorca F, Cortes J, Gnant M, Houssami N, Poortmans P, Ruddy K, Tsang J, Cardoso F. Breast cancer. Nat Rev Dis Primers. 2019; 5:66. https://doi.org/10.1038/s41572-019-0111-2 [PubMed]
- 3. Amelio I, Bernassola F, Candi E. Emerging roles of long non-coding RNAs in breast cancer biology and management. Semin Cancer Biol. 2021; 72:36–45. https://doi.org/10.1016/j.semcancer.2020.06.019 [PubMed]
- 4. Siegel RL, Miller KD, Jemal A. Cancer statistics, 2020. CA Cancer J Clin. 2020; 70:7–30. https://doi.org/10.3322/caac.21590 [PubMed]
- 5. Li N, Deng Y, Zhou L, Tian T, Yang S, Wu Y, Zheng Y, Zhai Z, Hao Q, Song D, Zhang D, Kang H, Dai Z. Global burden of breast cancer and attributable risk factors in 195 countries and territories, from 1990 to 2017: results from the Global Burden of Disease Study 2017. J Hematol Oncol. 2019; 12:140. https://doi.org/10.1186/s13045-019-0828-0 [PubMed]
- 6. Bray F, Ferlay J, Soerjomataram I, Siegel RL, Torre LA, Jemal A. Global cancer statistics 2018: GLOBOCAN estimates of incidence and mortality worldwide for 36 cancers in 185 countries. CA Cancer J Clin. 2018; 68:394–424. https://doi.org/10.3322/caac.21492 [PubMed]
- 7. Lambertini M, Santoro L, Del Mastro L, Nguyen B, Livraghi L, Ugolini D, Peccatori FA, Azim HA
Jr . Reproductive behaviors and risk of developing breast cancer according to tumor subtype: A systematic review and meta-analysis of epidemiological studies. Cancer Treat Rev. 2016; 49:65–76. https://doi.org/10.1016/j.ctrv.2016.07.006 [PubMed] - 8. Abdel-Sater F, Najar M, Fayyad-Kazan H. Triple negative breast cancer: microRNA expression profile and novel discriminators according to BRCA1 status. J Cell Physiol. 2020; 235:5204–12. https://doi.org/10.1002/jcp.29398 [PubMed]
- 9. Song Y, Barry WT, Seah DS, Tung NM, Garber JE, Lin NU. Patterns of recurrence and metastasis in BRCA1/BRCA2-associated breast cancers. Cancer. 2020; 126:271–80. https://doi.org/10.1002/cncr.32540 [PubMed]
- 10. Wiggins J, McLoughlin A, George A, Ring A, Kemp Z. Germline BRCA1 and BRCA2 testing for breast cancer survivors. J Med Genet. 2020; 57:528–30. https://doi.org/10.1136/jmedgenet-2019-106420 [PubMed]
- 11. Maruyama R, Suzuki H. Long noncoding RNA involvement in cancer. BMB Rep. 2012; 45:604–11. https://doi.org/10.5483/bmbrep.2012.45.11.227 [PubMed]
- 12. Zhou W, Ye XL, Xu J, Cao MG, Fang ZY, Li LY, Guan GH, Liu Q, Qian YH, Xie D. The lncRNA H19 mediates breast cancer cell plasticity during EMT and MET plasticity by differentially sponging miR-200b/c and let-7b. Sci Signal. 2017; 10:eaak9557. https://doi.org/10.1126/scisignal.aak9557 [PubMed]
- 13. Xu LJ, Yu XJ, Wei B, Hui HX, Sun Y, Dai J, Chen XF. LncRNA SNHG7 promotes the proliferation of esophageal cancer cells and inhibits its apoptosis. Eur Rev Med Pharmacol Sci. 2018; 22:2653–61. https://doi.org/10.26355/eurrev_201805_14961 [PubMed]
- 14. Wei GH, Wang X. lncRNA MEG3 inhibit proliferation and metastasis of gastric cancer via p53 signaling pathway. Eur Rev Med Pharmacol Sci. 2017; 21:3850–6. [PubMed]
- 15. Loewen G, Jayawickramarajah J, Zhuo Y, Shan B. Functions of lncRNA HOTAIR in lung cancer. J Hematol Oncol. 2014; 7:90. https://doi.org/10.1186/s13045-014-0090-4 [PubMed]
- 16. Tomiguchi M, Yamamoto Y, Yamamoto-Ibusuki M, Goto-Yamaguchi L, Fujiki Y, Fujiwara S, Sueta A, Hayashi M, Takeshita T, Inao T, Iwase H. Fibroblast growth factor receptor-1 protein expression is associated with prognosis in estrogen receptor-positive/human epidermal growth factor receptor-2-negative primary breast cancer. Cancer Sci. 2016; 107:491–8. https://doi.org/10.1111/cas.12897 [PubMed]
- 17. Ingle JN, Xie F, Ellis MJ, Goss PE, Shepherd LE, Chapman JW, Chen BE, Kubo M, Furukawa Y, Momozawa Y, Stearns V, Pritchard KI, Barman P, et al. Genetic Polymorphisms in the Long Noncoding RNA MIR2052HG Offer a Pharmacogenomic Basis for the Response of Breast Cancer Patients to Aromatase Inhibitor Therapy. Cancer Res. 2016; 76:7012–23. https://doi.org/10.1158/0008-5472.CAN-16-1371 [PubMed]
- 18. Wapinski O, Chang HY. Long noncoding RNAs and human disease. Trends Cell Biol. 2011; 21:354–61. https://doi.org/10.1016/j.tcb.2011.04.001 [PubMed]
- 19. Wang L, Ingle J, Weinshilboum R. Pharmacogenomic Discovery to Function and Mechanism: Breast Cancer as a Case Study. Clin Pharmacol Ther. 2018; 103:243–52. https://doi.org/10.1002/cpt.915 [PubMed]
- 20. Wacholder S, Chanock S, Garcia-Closas M, El Ghormli L, Rothman N. Assessing the probability that a positive report is false: an approach for molecular epidemiology studies. J Natl Cancer Inst. 2004; 96:434–42. https://doi.org/10.1093/jnci/djh075 [PubMed]
- 21. Marchese S, Silva E. Disruption of 3D MCF-12A breast cell cultures by estrogens--an in vitro model for ER-mediated changes indicative of hormonal carcinogenesis. PLoS One. 2012; 7:e45767. https://doi.org/10.1371/journal.pone.0045767 [PubMed]
- 22. Zhang Y, Cheng JC, Huang HF, Leung PC. Homeobox A7 stimulates breast cancer cell proliferation by up-regulating estrogen receptor-alpha. Biochem Biophys Res Commun. 2013; 440:652–7. https://doi.org/10.1016/j.bbrc.2013.09.121 [PubMed]
- 23. Gibson CL, Constantin D, Prior MJ, Bath PM, Murphy SP. Progesterone suppresses the inflammatory response and nitric oxide synthase-2 expression following cerebral ischemia. Exp Neurol. 2005; 193:522–30. https://doi.org/10.1016/j.expneurol.2005.01.009 [PubMed]
- 24. Cairns J, Ingle JN, Kalari KR, Shepherd LE, Kubo M, Goetz MP, Weinshilboum RM, Wang L. The lncRNA MIR2052HG regulates ERα levels and aromatase inhibitor resistance through LMTK3 by recruiting EGR1. Breast Cancer Res. 2019; 21:47. https://doi.org/10.1186/s13058-019-1130-3 [PubMed]
- 25. Frazer KA, Ballinger DG, Cox DR, Hinds DA, Stuve LL, Gibbs RA, Belmont JW, Boudreau A, Hardenbol P, Leal SM, Pasternak S, Wheeler DA, Willis TD, et al, and International HapMap Consortium. A second generation human haplotype map of over 3.1 million SNPs. Nature. 2007; 449:851–61. https://doi.org/10.1038/nature06258 [PubMed]
- 26. Gao P, Wei GH. Genomic Insight into the Role of lncRNA in Cancer Susceptibility. Int J Mol Sci. 2017; 18:1239. https://doi.org/10.3390/ijms18061239 [PubMed]
- 27. Minotti L, Agnoletto C, Baldassari F, Corrà F, Volinia S. SNPs and Somatic Mutation on Long Non-Coding RNA: New Frontier in the Cancer Studies? High Throughput. 2018; 7:34. https://doi.org/10.3390/ht7040034 [PubMed]
- 28. Fu Y, Zhang Y, Cui J, Yang G, Peng S, Mi W, Yin X, Yu Y, Jiang J, Liu Q, Qin Y, Xu W. SNP rs12982687 affects binding capacity of lncRNA UCA1 with miR-873-5p: involvement in smoking-triggered colorectal cancer progression. Cell Commun Signal. 2020; 18:37. https://doi.org/10.1186/s12964-020-0518-0 [PubMed]
- 29. Bartel DP. MicroRNAs: genomics, biogenesis, mechanism, and function. Cell. 2004; 116:281–97. https://doi.org/10.1016/s0092-8674(04)00045-5 [PubMed]
- 30. Boström AE, Chatzittofis A, Ciuculete DM, Flanagan JN, Krattinger R, Bandstein M, Mwinyi J, Kullak-Ublick GA, Öberg KG, Arver S, Schiöth HB, Jokinen J. Hypermethylation-associated downregulation of microRNA-4456 in hypersexual disorder with putative influence on oxytocin signalling: A DNA methylation analysis of miRNA genes. Epigenetics. 2020; 15:145–60. https://doi.org/10.1080/15592294.2019.1656157 [PubMed]