


Introduction
SLE is a lethal autoimmune disease caused by unknown reasons [1, 2]. Abnormalities in the regulation of cell-mediated immunity have been implicated in the pathophysiology of SLE [3]. For example, Bratha S. Devi et al. [3] found that the lack of T lymphocytes in the peripheral may contribute to the pathogenesis of SLE. Besides, B cells are an essential player in the pathogenic mechanism of SLE. Hanan Hassan Omar et al. [4] reported that CD5+ B cells were significantly decreased in SLE patients compared to healthy control. Furthermore, Hanan Hassan Omar et al. [4] also found that CD5+ B cells were significantly reduced in the active SLE patients compared to inactive ones, indicated that the numbers of CD5+ B cells in the peripheral might be related to the SLE disease activity. Interleukin (IL)-2 was markedly reduced the disease activity in SLE patients. The effect of IL-2 may refer to it selectively modulated the abundance of regulatory T (Treg) cell, follicular helper T (TFH) cells, and IL-17-producing helper T (TH17) cells, but not TH1 or TH2 cells [5]. The homeostasis of the lymphocyte’s subset is vital for an immune response [6, 7]. Therefore, having an overview of different cell types between SLE and healthy control can help us better understand its pathogenesis.
The diversity of TCR and BCR is also involved in determining the autoimmune response [8, 9]. Generally, the variety of TCR and BCR is achieved by the rearrangement of the variable (V), diversity (D), and Joining (J) genes at complementary-determining region 3 (CDR3) recombination junctions. Identifying disease-associated TCR and BCR can potentially serve as biomarkers and provide novel insights for disease status and therapeutic targets in SLE [10].
Single-cell sequencing has emerged as a robust new set of technologies for delineating complex populations [11–13]. It can elucidate the cell type composition of a sample. For example, Dominic Grun et al. [14, 15] discovered a rare intestinal cell type using single-cell mRNA sequencing. The heterogeneity of SLE can be revealed by a single-cell RNA sequence [14, 15]. Here, we used single-cell 5’ RNA sequencing and single-cell repertoire sequencing to reveal the cell types in peripheral blood of SLE patients, elucidate their biological process in the pathogenesis of SLE, and discover the disease-associated TCR/BCR.
Materials and Methods
Ethics statement
The experimental study was approved by the ethics committee of Shenzhen people’s hospital (LL-KT-2018358). The study adheres to the Helsinki Declaration guidelines on ethical principles for medical research involving human subjects.
Patient involvement
Ten peripheral blood samples of SLE patients and Ten NC samples were obtained from Shenzhen People's Hospital. Inclusion criteria: Patients diagnosed with SLE and SLE disease activity index (SLEDAI) scores are equal to or greater than 5 (Table 1). Exclusion criteria: patient and other immune diseases or treated with high dose (>1mg/kg/d) glucocorticoid and other immunosuppressants. All participants have signed the informed consent form.
Table 1. Clinical data of participants.
| Group | Age | Proteinuria(g/24h) | C3(g/l) | C4(g/l) | ESR | SLEDAI | |||||||||||||||||||||||||||||||||||||||||||||||||||||||||||||||||||||||||||||||||||||||||||||
| SLE | 45±12.3 | 1.3±1.35 | 0.65±0.37 | 0.15±0.03 | 58.9±15.3 | 5.8±0.5 | |||||||||||||||||||||||||||||||||||||||||||||||||||||||||||||||||||||||||||||||||||||||||||||
| NC | 42±11.8 | 0.06±0.02 | 1.83±0.62 | 0.4±0.1 | 9.8±2.7 | 0 | |||||||||||||||||||||||||||||||||||||||||||||||||||||||||||||||||||||||||||||||||||||||||||||
| C3, complement 3; C4, complement 4; ESR, erythrocyte sedimentation rate; h, hours; NC, normal control; SLE, systemic lupus erythematosus, SLEDAI, systemic lupus erythematosus disease activity index. | |||||||||||||||||||||||||||||||||||||||||||||||||||||||||||||||||||||||||||||||||||||||||||||||||||
Peripheral blood monocytes (PBMCs) isolation
The PBMCs were isolated by using a density gradient centrifugation method. Briefly, a blood sample from an ethylenediaminetetraacetic acid-anticoagulated tube was added to Ficoll paque plus density solution (17-1440- 03,GE Healthcare) and then centrifuged according to the manufacturer’s protocol.
Single-cell 5’ RNA sequencing
After PBMCs pooling, the suspension was loaded onto a Chromium platform (10x Genomics). The single-cell 5’ RNA sequencing as described in the previous publication [16]. In brief, we profiled thousands of genes at the single cell level by barcoding mRNA at the 5’ end, for unbiased characterization of cell types and cell states.
TCR/BCR profiling
At the same time, as we previously described, samples were processed per Chromium single cell V(D)J reagent kits protocol by 10x Genomics [17, 18]. We simultaneously profiled immune repertoire (BCR/TCR) and gene expression from the same cell to enable the correlation of clonotype with the corresponding cell subtype.
Data analysis
All raw data were processed through the CellRanger pipeline (10x Genomics), which allowed demultiplexing, alignment, filtering, barcode counting, UMI counting, and generating cell x barcode matrices. Unsupervised clustering and visualization were performed with R and t-distributed Stochastic Neighbor Embedding (tSNE), respectively. Marker genes (Supplementary Table 1) were defined with fold change adjusted p <0.05. Cell clusters were annotated using canonical markers by cellmarker [19] (http://bio-bigdata.hrbmu.edu.cn/CellMarker/). The Gorilla tool for discovering enriched GO terms in the ranked gene list was used to determine transcriptional signatures. For TCR/BCR clonotype analysis, we used the CellRanger pipeline. As per the definition by 10x genomics: “clonotypes are defined as a set of cells with the same CDR3 sequence in their V(D)J variable regions”.
Availability of data and materials
All data can be available in this manuscript, supplementary information files, and the corresponding author upon request.
Results
Abnormal subsets of neutrophil, macrophages, and dendritic cells were accumulated in the peripheral blood of SLE patients
We generated different cell numbers in SLE patients (11042) and NC (9732) (Figure 1A). In SLE, the mean reads per cell are 38294, and the median gene per cell is 1504. However, the mean reads per cell are 42599, and the median gene per cell is 1381 (Supplementary Figure 1) in NC. We further identified 12 cell clusters among 9732 cells in the NC group and 16 cell clusters among 11042 cells in the SLE group. Next, we defined these cell clusters by gene marker. Compared to the NC group, the neutrophil, macrophage, and dendritic cells accumulated in the SLE group (Figure 1B, 1C), indicating that these cells clusters might play an important role in the inflammation response. In addition, the trajectory analysis results showed five states in cell clusters of SLE groups. In contrast, only three states were showed in NC groups. The results suggested a different lineage hierarchy among the major immune cell types of PBMCs between these two groups (Supplementary Figure 2). Therefore, the roles of each cell type were different in NC and SLE.
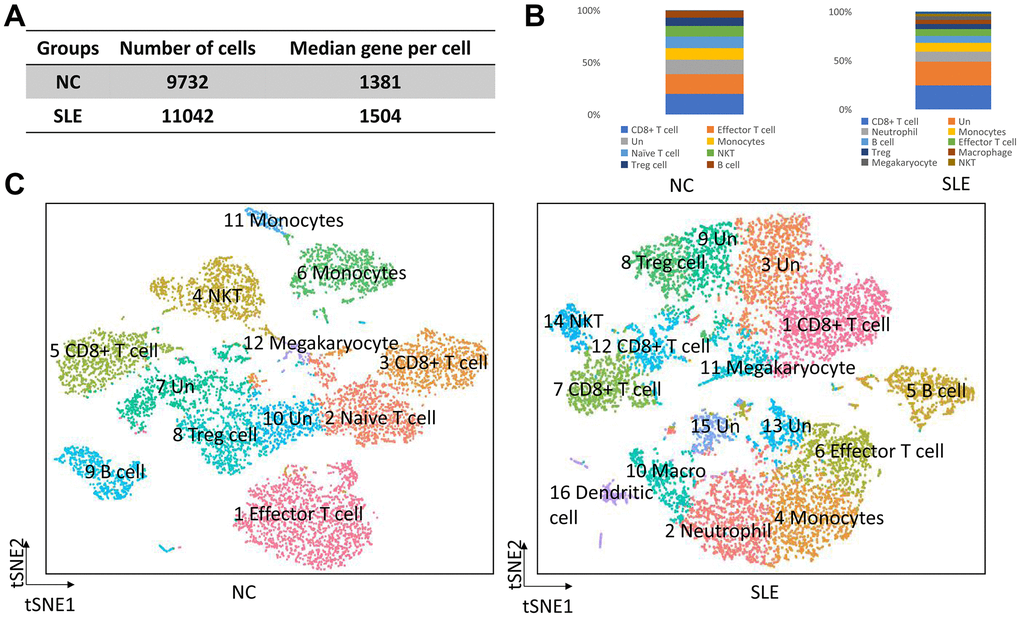
Figure 1. The overview of clusters in the SLE and NC. The accumulation of neutrophil, macrophage, and dendritic cells in SLE. (A) The cell number and median gene per cell were generated in NC and SLE. (B) The bar chart showed the immune cell types in NC and SLE. (C) The t-distributed stochastic neighbor embedding (t-SNE) analysis of cell clusters between NC and SLE. Un: undefined cell types, macro: macrophage cells.
The role of neutrophil cells in the pathogenesis of SLE
To further elucidated the role of neutrophil, macrophage, and dendritic cells in the pathogenesis of SLE, we performed the gene ontology (GO) and Kyoto Encyclopedia of Genes and Genomes (KEGG) pathway analysis. First, the differential expression genes (DEGs) in each cluster were identified. The heatmap of the DEGs showed in Figure 2. The disease enriched results showed that the DEGs in neutrophils play a role in autoimmune diseases, such as rheumatoid arthritis and lymphoproliferative disorders (Figure 3A). The GO analysis results further confirmed that the biological process of DEGs was enriched by the immune system process (Supplementary Figure 3). The KEGG pathway results showed that the DEGs in neutrophils might, through the NF-κB pathway, TNF signaling pathway participated in the pathogenesis of SLE (Figure 3B). These results suggested that neutrophils have an important role in the pathogenesis of SLE.
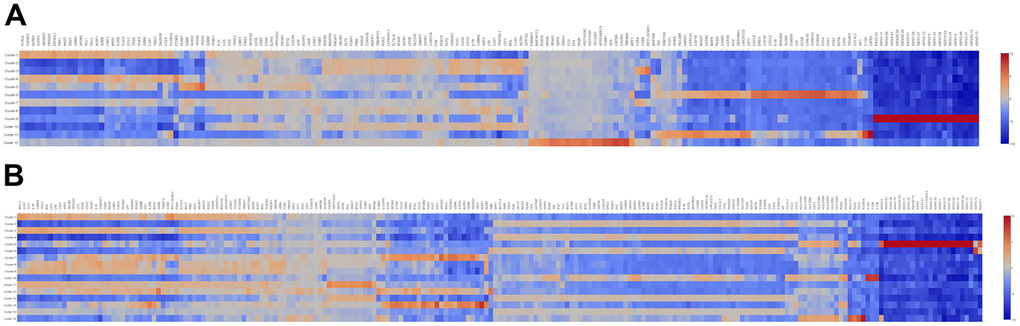
Figure 2. The heatmap of DEGs in different cell clusters between the SLE and NC groups. (A) The heatmap of DEGs in 12 cell clusters of the NC group. (B) The heatmap of DEGs in 16 cell clusters of the SLE group.
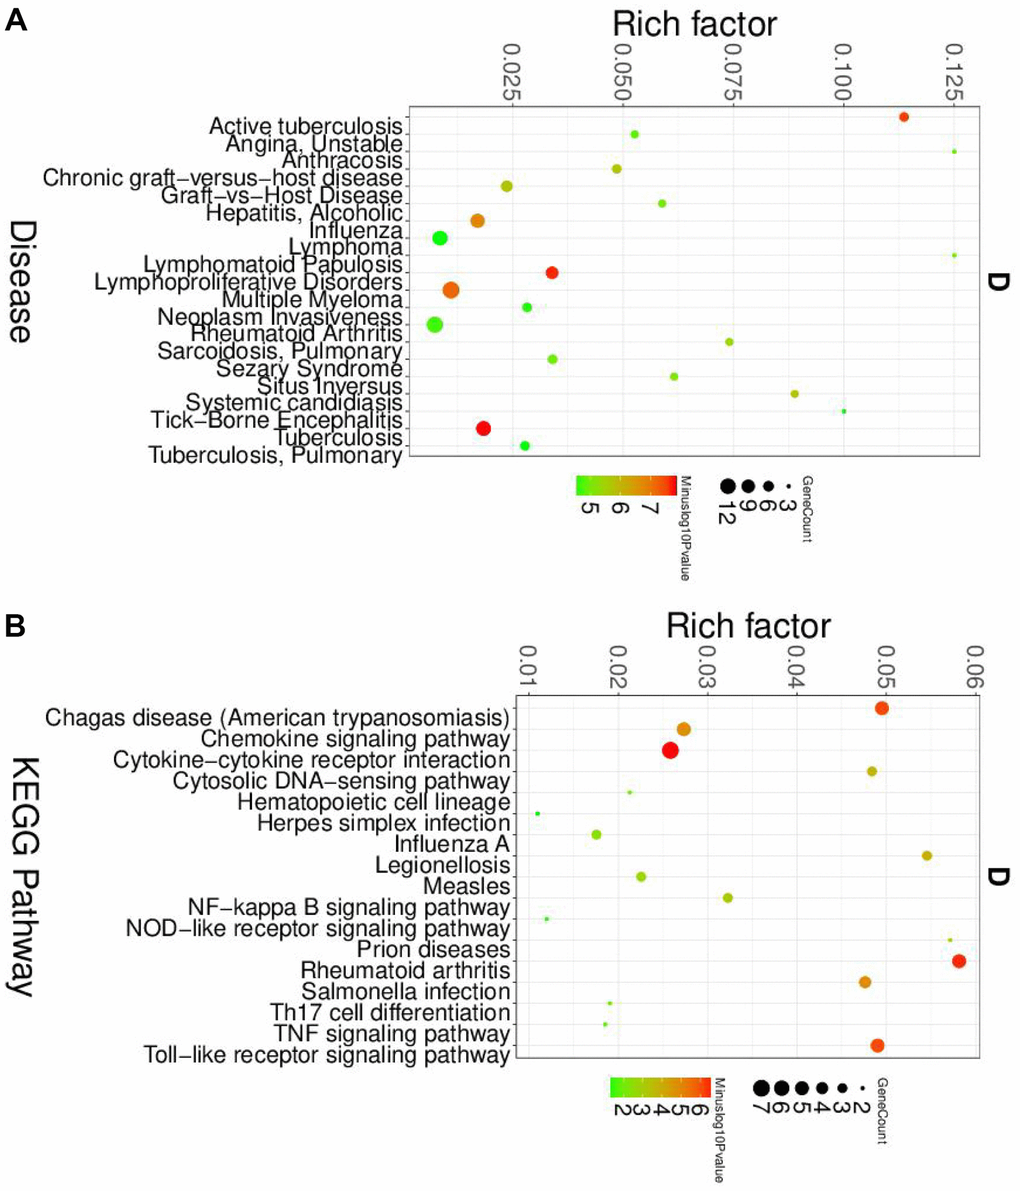
Figure 3. The disease and KEGG enriched of DEGs in neutrophils. (A) The top disease enriched of DEGs in neutrophils. (B) The KEGG pathway analyses of DEGs in neutrophils.
The role of macrophage and dendritic cells in the pathogenesis of SLE
Next, we analyzed the roles and macrophage and dendritic cells in the pathogenesis of SLE. Similar to the neutrophil, the GO and KEGG analyses were performed. The disease enriched analysis showed that the DEGs in macrophages were directly involved in the SLE (Figure 4A), and the results were further confirmed by the GO analysis results (Supplementary Figure 4). The KEGG results showed that the DEGs in macrophages would affect the Th1 and Th2 cell differentiation (Figure 4B). The differentiation status of Th1 and Th2 cells was correlated with the SLE [20]. Therefore, the DEGs in macrophage plays a vital role in the pathogenesis of SLE.
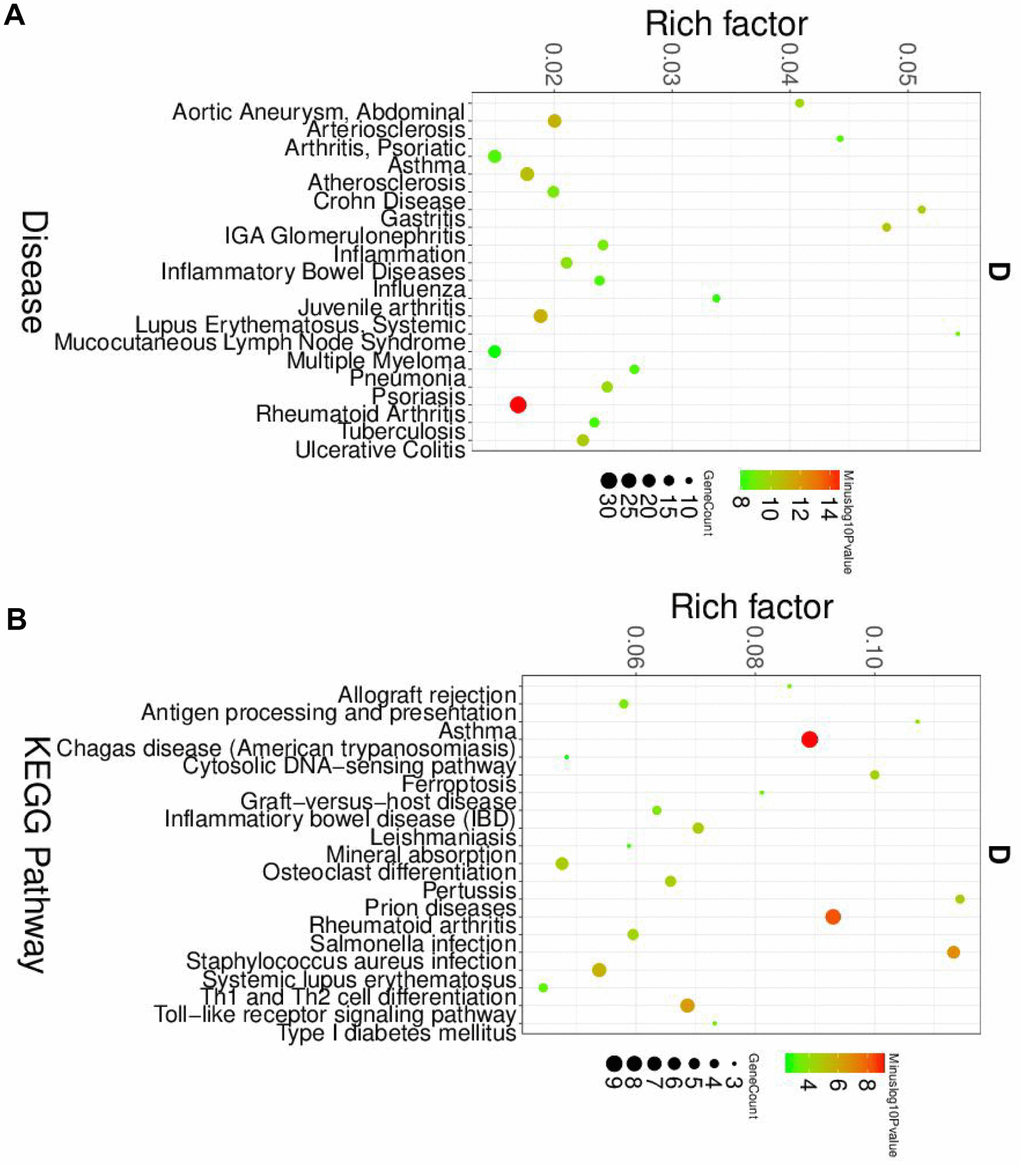
Figure 4. The disease and KEGG enriched of DEGs in macrophage cells. (A) The top disease enriched of DEGs in macrophage cells. (B) The KEGG pathway analyses of DEGs in macrophage cells.
Furthermore, the DEGs of dendritic cells were also enriched by the autoimmune disease (Figure 5A) and immune response (Supplementary Figure 5). The KEGG pathway results showed that dendritic cells' DEGs were involved in the NF-κB pathway and Th1 and Th2 cell differentiation (Figure 5B).
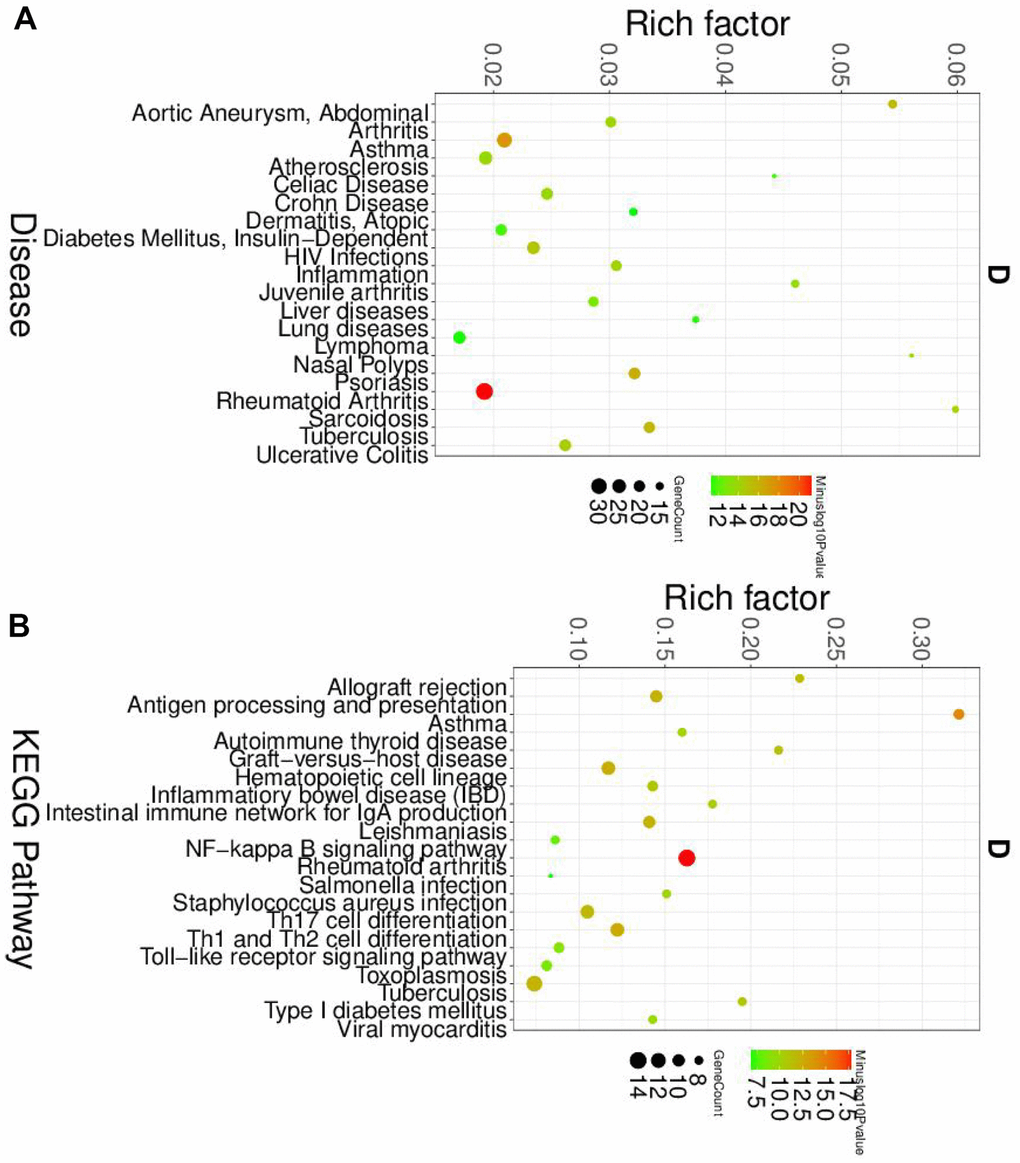
Figure 5. The disease and KEGG enriched of DEGs in dendritic cells. (A) The top disease enriched of DEGs in dendritic cells. (B) The KEGG pathway analyses of DEGs in dendritic cells.
Overall, our finding demonstrated that different immune cell types participated in the immune response in SLE through different pathways, which helped us better understand the pathogenesis of SLE.
The TCR clonotypes were increased in the SLE
The immune repertoire can be used for either diagnostic marker or therapeutic targets. Using the Cell Ranger pipeline, we identified 5167 clonotypes from 5847 barcodes in SLE patients, 4259 clonotypes from 4654 barcodes in NC, suggesting that the TCR clonotypes was increased in the SLE compared to NC (Figure 6). In addition, the usage of the VDJ gene in both TCR α and β chains was biased between these two groups (Figure 7). For example, the most used V gene in TCRα was TRAV40 in NC, whereas it was TRAV16 in SLE. The most usage TCR clonotype was shown in Supplementary Figure 6A (CALSGDSNYQLIW_CASSPRPGNTEAFF).
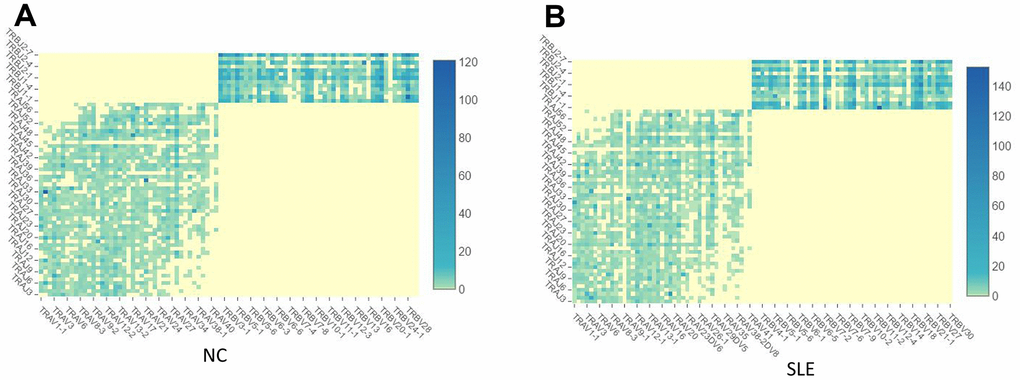
Figure 6. The TCR clonotypes was increased in SLE than in NC. (A) The heatmap of TCR VDJ in the NC group. (B) The heatmap of TCR VDJ in the SLE group.
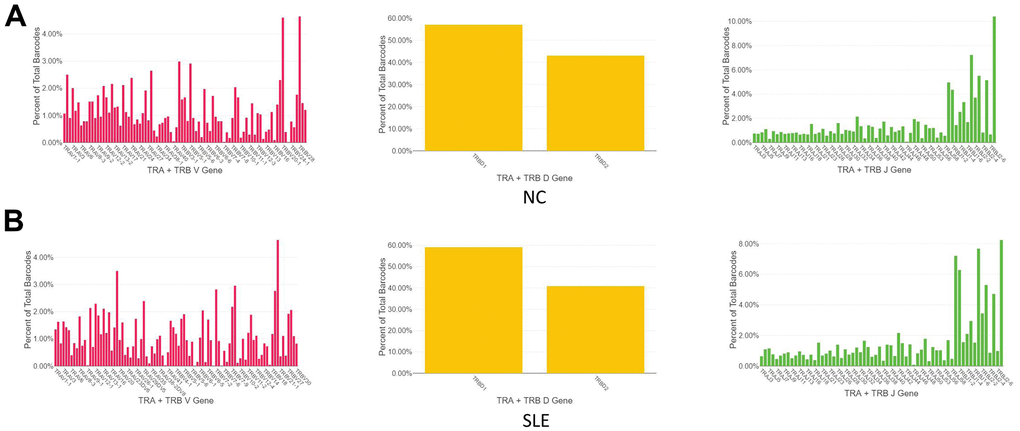
Figure 7. The biased usage of the VDJ gene of TCR between SLE and NC group. (A) The usage of the VDJ gene of TCR α and β chain in NC group. (B) The usage of the VDJ gene of TCR α and β chain in the SLE group.
The BCR clonotypes were increased in the SLE
1064 clonotypes from 1087 barcodes were identified in SLE, whereas 639 clonotypes from 653 barcodes were identified in NC. The results showed that the BCR clonotypes was also increased in the SLE compared to NC (Figure 8 and Supplementary Figure 7). In addition, the usage of the VDJ gene in both BCR IGH, IGK, and IGL chains was biased between these two groups (Figure 9). For example, the most use of V gene in BCR IGH was IGHV3-21 in NC, whereas it was IGHV3-23 in SLE. The most usage BCR clonotype was shown in Supplementary Figure 6B (CAAWDASLNGGWVF_CARGVAALW). The different usage of TCR and BCR may provide us an avenue to develop a specific treatment for SLE patients.
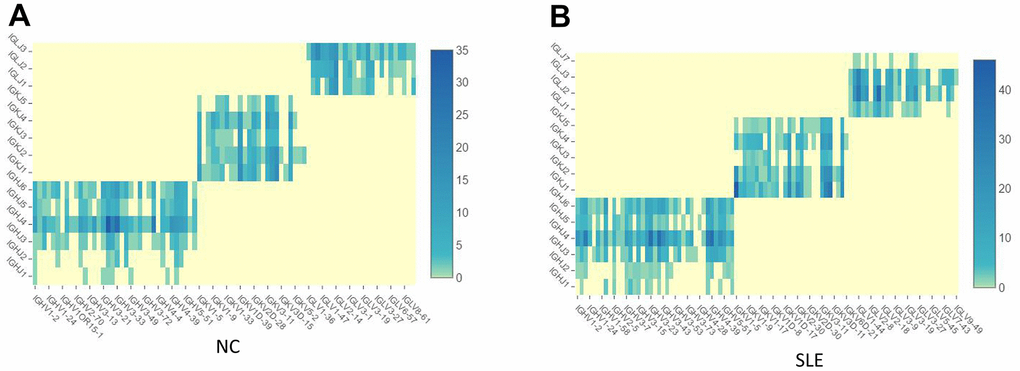
Figure 8. The BCR clonotypes was increased in SLE than in NC. (A) The heatmap of BCR in the NC group. (B) The heatmap of BCR in the SLE group.
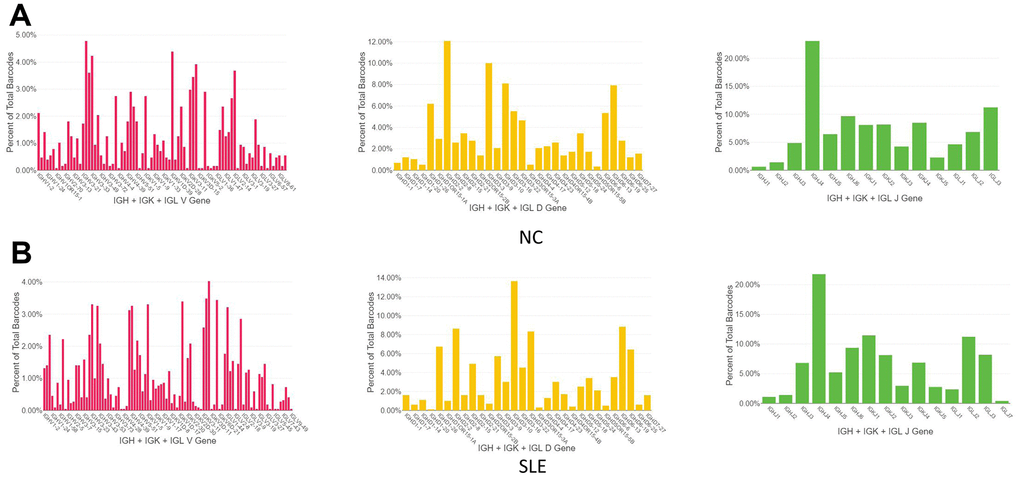
Figure 9. The biased usage of the VDJ gene of BCR between NC and SLE group. (A) The usage of VDJ gene of BCR IGH, IGK, and IGL chain in the NC group. (B) The usage of the VDJ gene of BCR IGH, IGK, and IGL chain in the SLE group.
Discussion
In this study, we revealed different immune cell types between the SLE and NC. The hemostasis subsets and populations of lymphocytes are important in the maintenance of immune systems. Abnormal cell subsets in peripheral blood may lead to immune-related diseases, such as SLE, rheumatoid arthritis, and IgA nephritis. In SLE, the abnormal T cell subsets may be involved in the pathogenesis of SLE [21].
In contrast to normal and inactive SLE patients, the percentage of typical T cell antigen-positive cells were reduced in all active SLE patients. In other words, the imbalance subsets of human T cells exist in patients with SLE [21]. Every T cell subsets have their specific role in SLE. The roles of CD4+ T cell, CD8+ T cell, Th1, Th2, Th17, and Treg cell in SLE have been well documented [20, 22–25].
This study first observed the accumulation of neutrophil, macrophage, and dendritic cells in SLE. And then, their roles in the pathogenesis of SLE were elucidated. The results showed that these three immune cell types participated in the pathogenesis through a different pathway. The correlation of neutrophil and SLC were investigated by a retrospective study. In this study, 154 SLE patients and 151 healthy controls were involved. The neutrophil to lymphocyte ratio (NLR) was positively correlated with C-reaction protein, SLE disease activity index (SLEDAI) scores, suggested an important role of neutrophil in SLE [26]. In addition, the formation of neutrophil extracellular traps indicated that the injury in the host [27].
The abnormal macrophage was observed in this study as well as other groups [28, 29]. In SLE patients, the macrophage might contribute to the acceleration of atherosclerosis [30], which is a severe cardiovascular disease. In addition to macrophages, dendritic cells are also important in regulating both immunity and tolerance. Generally, the population of dendritic cells in peripheral blood is very low. However, several cell types may differentiate into dendritic cells when responding to inflammatory status [31]. Patrick Blanco et al. [32] found that serum from SLE patients can initiate the differentiation from normal monocytes into dendritic cells. The capacity of SLE patient’s serum to generate dendritic differentiation related to disease activity. Accumulation shreds of evidence have highlighted dendritic cells as the culprit for SLE pathogenesis, mainly through type-I interferons production [33, 34]. Dendritic cells are hyperactivated in SLE patients who respond to rituximab, which requires a normalized plasmacytoid dendritic cell and regulatory B cell interaction [35]. Therefore, dendritic cells are crucial in both the innate and adaptive immune response. Either directly or via produced interferons, it has a pivotal role in autoimmunity. In addition, we also revealed the critical pathway of these cells involved, such NF-kB pathway and TNF signaling pathway. Their roles in the pathogenesis and the treatment of SLE have been reported [36–38].
The immune repertoire can be used for either diagnostic marker or therapeutic targets. The identified TCR/BCR can provide targets for chimeric antigen receptor (CAR)-T cell-based-adoptive immuno-therapies and neoantigen-specific TCR-T cell-based adoptive immuno-therapies [39]. Recently, Jin et al. [40] claimed that anti-CD19 CAR-T cell therapy worked effectively in treating murine SLE, suggested its potential in treating human patients. Besides, the disease-associated TCR/BCR can identify antibodies that contribute to functional immune response [41]. The TCR/BCR can be developed as diagnostic biomarkers or therapeutic targets in SLE [42]. These studies suggested that identifying disease-related TCR/BCR was critical for the diagnosis and treatment of SLE. This study revealed biased TCR/BCR in SLE patients and identified some frequent TCR/BCR clonotypes in SLE. We hope our study can provide some evidence to discover the SLE-related TCR/BCR. Further investigation is warranted.
Conclusions
Our finding first elucidated the difference of immune cell subsets between SLE and NC. It then explored their transcription signature to have a better understanding of the pathogenesis of SLE. We also identified several TCR/BCR clonotypes, which can be developed as diagnostic biomarkers or therapeutic targets. However, the sample included in this study is SLEDAI greater than five, and the sample size is limited. Further study is necessary. Overall, we used single-cell RNA sequencing to reveal the transcriptome signature of immune cells and their immune repertoire in SLE in this study.
Author Contributions
Study design and concept: Fengping Zheng, Donge Tang, Zuying Xiong and Yong Dai. Patients involvement: Fengping Zheng, Huixuan Xu, Cantong Zhang, Weier Dai, Xiaoping Hong. Data acquisition, Fengping Zheng, Donge Tang, and Dongzhou Liu. Data analysis and interpretation: Fengping Zheng. Manuscript preparation: Fengping Zheng. Manuscript review: Zuying Xiong and Yong Dai. All authors read and approved the final manuscript.
Acknowledgments
We thank the Genergy bio for their technical support.
Conflicts of Interest
The authors declare that they have no conflicts of interest.
Funding
This project was supported by the National Natural Science Foundation of China (Grant No. 81971464), the Shenzhen science and technology innovation commission (No. JCYJ20200109144218597 and JCYJ20200109140412476), Key Research and Development Program of Guangdong Province (Grant No. 2019B020229001), Sanming Project of Medicine in Shenzhen (SZSM201812097), Shenzhen Key Medical Discipline Construction Fund(No.SZXK011), and Shenzhen Fund for Guangdong Provincial High-level Clinical Key Specialties (NO.SZGSP001).
Editorial Note
This corresponding author has a verified history of publications using a personal email address for correspondence
References
- 1. Fava A, Petri M. Systemic lupus erythematosus: Diagnosis and clinical management. J Autoimmun. 2019; 96:1–13. https://doi.org/10.1016/j.jaut.2018.11.001 [PubMed]
- 2. Lo MS, Tsokos GC. Recent developments in systemic lupus erythematosus pathogenesis and applications for therapy. Curr Opin Rheumatol. 2018; 30:222–28. https://doi.org/10.1097/BOR.0000000000000474 [PubMed]
- 3. Devi BS, Van Noordin S, Krausz T, Davies KA. Peripheral blood lymphocytes in SLE--hyperexpression of CD154 on T and B lymphocytes and increased number of double negative T cells. J Autoimmun. 1998; 11:471–75. https://doi.org/10.1006/jaut.1998.0213 [PubMed]
- 4. Omar HH, Nasef SI, Omar HH, Ghaly MS. CD5+ B lymphocytes in systemic lupus erythematosus patients: relation to disease activity. Clin Rheumatol. 2017; 36:2719–26. https://doi.org/10.1007/s10067-017-3818-z [PubMed]
- 5. He J, Zhang X, Wei Y, Sun X, Chen Y, Deng J, Jin Y, Gan Y, Hu X, Jia R, Xu C, Hou Z, Leong YA, et al. Low-dose interleukin-2 treatment selectively modulates CD4(+) T cell subsets in patients with systemic lupus erythematosus. Nat Med. 2016; 22:991–93. https://doi.org/10.1038/nm.4148 [PubMed]
- 6. Prado C, de Paz B, López P, Gómez J, Rodríguez-Carrio J, Suárez A. Relationship between FOXP3 positive populations and cytokine production in systemic lupus erythematosus. Cytokine. 2013; 61:90–96. https://doi.org/10.1016/j.cyto.2012.08.033 [PubMed]
- 7. Katsuyama T, Tsokos GC, Moulton VR. Aberrant T Cell Signaling and Subsets in Systemic Lupus Erythematosus. Front Immunol. 2018; 9:1088. https://doi.org/10.3389/fimmu.2018.01088 [PubMed]
- 8. Xianliang Hou J, Lu C, Wang L, Wu W, Wei Y, Ding Y, Ye P, Dai Y, Diao H. The conserved T cell receptor repertoire observed in patients with systemic lupus erythematosus. Int J Clin Exp Med. 2017; 10:2053–65.
- 9. Ramadoss NS, Robinson WH. Characterizing the BCR repertoire in immune-mediated diseases. Nat Rev Rheumatol. 2020; 16:7–8. https://doi.org/10.1038/s41584-019-0339-y [PubMed]
- 10. Liu X, Zhang W, Zhao M, Fu L, Liu L, Wu J, Luo S, Wang L, Wang Z, Lin L, Liu Y, Wang S, Yang Y, et al. T cell receptor β repertoires as novel diagnostic markers for systemic lupus erythematosus and rheumatoid arthritis. Ann Rheum Dis. 2019; 78:1070–78. https://doi.org/10.1136/annrheumdis-2019-215442 [PubMed]
- 11. Shapiro E, Biezuner T, Linnarsson S. Single-cell sequencing-based technologies will revolutionize whole-organism science. Nat Rev Genet. 2013; 14:618–30. https://doi.org/10.1038/nrg3542 [PubMed]
- 12. Kolodziejczyk AA, Kim JK, Svensson V, Marioni JC, Teichmann SA. The technology and biology of single-cell RNA sequencing. Mol Cell. 2015; 58:610–20. https://doi.org/10.1016/j.molcel.2015.04.005 [PubMed]
- 13. Grün D, van Oudenaarden A. Design and Analysis of Single-Cell Sequencing Experiments. Cell. 2015; 163:799–810. https://doi.org/10.1016/j.cell.2015.10.039 [PubMed]
- 14. Grün D, Lyubimova A, Kester L, Wiebrands K, Basak O, Sasaki N, Clevers H, van Oudenaarden A. Single-cell messenger RNA sequencing reveals rare intestinal cell types. Nature. 2015; 525:251–55. https://doi.org/10.1038/nature14966 [PubMed]
- 15. Nehar-Belaid D, Hong S, Marches R, Chen G, Bolisetty M, Baisch J, Walters L, Punaro M, Rossi RJ, Chung CH, Huynh RP, Singh P, Flynn WF, et al. Mapping systemic lupus erythematosus heterogeneity at the single-cell level. Nat Immunol. 2020; 21:1094–106. https://doi.org/10.1038/s41590-020-0743-0 [PubMed]
- 16. Luo T, Zheng F, Wang K, Xu Y, Xu H, Shen W, Zhu C, Zhang X, Sui W, Tang D, Yin L, Dai Y. A single-cell map for the transcriptomic signatures of peripheral blood mononuclear cells in end-stage renal disease. Nephrol Dial Transplant. 2021; 36:599–608. https://doi.org/10.1093/ndt/gfz227 [PubMed]
- 17. Hanamsagar R, Reizis T, Chamberlain M, Marcus R, Nestle FO, de Rinaldis E, Savova V. An optimized workflow for single-cell transcriptomics and repertoire profiling of purified lymphocytes from clinical samples. Sci Rep. 2020; 10:2219. https://doi.org/10.1038/s41598-020-58939-y [PubMed]
- 18. Yang HQ, Wang YS, Zhai K, Tong ZH. Single-Cell TCR Sequencing Reveals the Dynamics of T Cell Repertoire Profiling During Pneumocystis Infection. Front Microbiol. 2021; 12:637500. https://doi.org/10.3389/fmicb.2021.637500 [PubMed]
- 19. Zhang X, Lan Y, Xu J, Quan F, Zhao E, Deng C, Luo T, Xu L, Liao G, Yan M, Ping Y, Li F, Shi A, et al. CellMarker: a manually curated resource of cell markers in human and mouse. Nucleic Acids Res. 2019; 47:D721–28. https://doi.org/10.1093/nar/gky900 [PubMed]
- 20. Talaat RM, Mohamed SF, Bassyouni IH, Raouf AA. Th1/Th2/Th17/Treg cytokine imbalance in systemic lupus erythematosus (SLE) patients: Correlation with disease activity. Cytokine. 2015; 72:146–53. https://doi.org/10.1016/j.cyto.2014.12.027 [PubMed]
- 21. Morimoto C, Reinherz EL, Schlossman SF, Schur PH, Mills JA, Steinberg AD. Alterations in immunoregulatory T cell subsets in active systemic lupus erythematosus. J Clin Invest. 1980; 66:1171–74. https://doi.org/10.1172/JCI109948 [PubMed]
- 22. Yin Y, Choi SC, Xu Z, Perry DJ, Seay H, Croker BP, Sobel ES, Brusko TM, Morel L. Normalization of CD4+ T cell metabolism reverses lupus. Sci Transl Med. 2015; 7:274ra18. https://doi.org/10.1126/scitranslmed.aaa0835 [PubMed]
- 23. Maeda N, Sekigawa I, Iida N, Matsumoto M, Hashimoto H, Hirose S. Relationship between CD4+/CD8+ T cell ratio and T cell activation in systemic lupus erythematosus. Scand J Rheumatol. 1999; 28:166–70. https://doi.org/10.1080/03009749950154248 [PubMed]
- 24. Filaci G, Bacilieri S, Fravega M, Monetti M, Contini P, Ghio M, Setti M, Puppo F, Indiveri F. Impairment of CD8+ T suppressor cell function in patients with active systemic lupus erythematosus. J Immunol. 2001; 166:6452–57. https://doi.org/10.4049/jimmunol.166.10.6452 [PubMed]
- 25. Bystrom J, Taher TE, Muhyaddin MS, Clanchy FI, Mangat P, Jawad AS, Williams RO, Mageed RA. Harnessing the Therapeutic Potential of Th17 Cells. Mediators Inflamm. 2015; 2015:205156. https://doi.org/10.1155/2015/205156 [PubMed]
- 26. Qin B, Ma N, Tang Q, Wei T, Yang M, Fu H, Hu Z, Liang Y, Yang Z, Zhong R. Neutrophil to lymphocyte ratio (NLR) and platelet to lymphocyte ratio (PLR) were useful markers in assessment of inflammatory response and disease activity in SLE patients. Mod Rheumatol. 2016; 26:372–76. https://doi.org/10.3109/14397595.2015.1091136 [PubMed]
- 27. Yu Y, Su K. Neutrophil Extracellular Traps and Systemic Lupus Erythematosus. J Clin Cell Immunol. 2013; 4:139. https://doi.org/10.4172/2155-9899.1000139 [PubMed]
- 28. Li Y, Lee PY, Reeves WH. Monocyte and macrophage abnormalities in systemic lupus erythematosus. Arch Immunol Ther Exp (Warsz). 2010; 58:355–64. https://doi.org/10.1007/s00005-010-0093-y [PubMed]
- 29. Tas SW, Quartier P, Botto M, Fossati-Jimack L. Macrophages from patients with SLE and rheumatoid arthritis have defective adhesion in vitro, while only SLE macrophages have impaired uptake of apoptotic cells. Ann Rheum Dis. 2006; 65:216–21. https://doi.org/10.1136/ard.2005.037143 [PubMed]
- 30. Ayoub S, Hickey MJ, Morand EF. Mechanisms of disease: macrophage migration inhibitory factor in SLE, RA and atherosclerosis. Nat Clin Pract Rheumatol. 2008; 4:98–105. https://doi.org/10.1038/ncprheum0701 [PubMed]
- 31. Shortman K, Naik SH. Steady-state and inflammatory dendritic-cell development. Nat Rev Immunol. 2007; 7:19–30. https://doi.org/10.1038/nri1996 [PubMed]
- 32. Blanco P, Palucka AK, Gill M, Pascual V, Banchereau J. Induction of dendritic cell differentiation by IFN-alpha in systemic lupus erythematosus. Science. 2001; 294:1540–43. https://doi.org/10.1126/science.1064890 [PubMed]
- 33. Chan VS, Nie YJ, Shen N, Yan S, Mok MY, Lau CS. Distinct roles of myeloid and plasmacytoid dendritic cells in systemic lupus erythematosus. Autoimmun Rev. 2012; 11:890–97. https://doi.org/10.1016/j.autrev.2012.03.004 [PubMed]
- 34. Rönnblom L, Eloranta ML, Alm GV. Role of natural interferon-alpha producing cells (plasmacytoid dendritic cells) in autoimmunity. Autoimmunity. 2003; 36:463–72. https://doi.org/10.1080/08916930310001602128 [PubMed]
- 35. Menon M, Blair PA, Isenberg DA, Mauri C. A Regulatory Feedback between Plasmacytoid Dendritic Cells and Regulatory B Cells Is Aberrant in Systemic Lupus Erythematosus. Immunity. 2016; 44:683–97. https://doi.org/10.1016/j.immuni.2016.02.012 [PubMed]
- 36. Postal M, Appenzeller S. The role of Tumor Necrosis Factor-alpha (TNF-α) in the pathogenesis of systemic lupus erythematosus. Cytokine. 2011; 56:537–43. https://doi.org/10.1016/j.cyto.2011.08.026 [PubMed]
- 37. Aringer M, Smolen JS. Therapeutic blockade of TNF in patients with SLE-promising or crazy? Autoimmun Rev. 2012; 11:321–25. https://doi.org/10.1016/j.autrev.2011.05.001 [PubMed]
- 38. Pacheco GV, Novelo Noh IB, Velasco Cárdenas RM, Angulo Ramírez AV, López Villanueva RF, Quintal Ortiz IG, Alonso Salomón LG, Ruz NP, Rivero Cárdenas NA. Expression of TLR-7, MyD88, NF-kB, and INF-α in B Lymphocytes of Mayan Women with Systemic Lupus Erythematosus in Mexico. Front Immunol. 2016; 7:22. https://doi.org/10.3389/fimmu.2016.00022 [PubMed]
- 39. Ye B, Smerin D, Gao Q, Kang C, Xiong X. High-throughput sequencing of the immune repertoire in oncology: Applications for clinical diagnosis, monitoring, and immunotherapies. Cancer Lett. 2018; 416:42–56. https://doi.org/10.1016/j.canlet.2017.12.017 [PubMed]
- 40. Jin X, Lu L. Anti-CD19 CAR-T cell therapy for Systemic Lupus Erythematosus in a mouse disease model. J Immunol. 2020; 204:S238.3. https://www.jimmunol.org/content/204/1_Supplement/238.3.
- 41. Robinson WH. Sequencing the functional antibody repertoire--diagnostic and therapeutic discovery. Nat Rev Rheumatol. 2015; 11:171–82. https://doi.org/10.1038/nrrheum.2014.220 [PubMed]
- 42. Dziubianau M, Hecht J, Kuchenbecker L, Sattler A, Stervbo U, Rödelsperger C, Nickel P, Neumann AU, Robinson PN, Mundlos S, Volk HD, Thiel A, Reinke P, Babel N. TCR repertoire analysis by next generation sequencing allows complex differential diagnosis of T cell-related pathology. Am J Transplant. 2013; 13:2842–54. https://doi.org/10.1111/ajt.12431 [PubMed]