Analysis of genes related to BRCA co-expressed with PSMD family genes
By leveraging the Oncomine online platform to perform a thorough analysis of the co-expression network of PSMD1, we found that PSMD1 was positively correlated with AGFG1, GPR107, PTH2R, TFPI, GUCY1A3, SLCO2Al, EIF5B, PAQR3, and ROD1. As for genes which are supposedly co-expressed with PSMD2, we concluded that its expression was positively correlated with EIF2S2, NUPL2, GLRX3, LSM5, CBX3, PAKIIP1, CCT6A, MRPS17, CHCHD2, PSMA2, SEC61G, NUDT1, POLD2, FSTL1, EIF3B, CYCS, and AIMP2. As for genes co-expressed with PSMD3, there were positive correlations with CASC3, MED24, MSL1, THRA, RAPGEFL1, RARA, WIPF2, SLC16A6, ACACA, PDESB, CST4, ABHD2, FRY, and POLG. Similarly, genes co-expressed with PSMD4 included UBE2Q1, MRPL9, POGZ, SETDB1, P14KB, VPS72, SCNM1, P14KB, PRUNE, ADAR, APH1A, TDRKH, CLK2, PRPF3, UBAPZL, and DAP3. Moreover, positive correlations with PSMD5 were determined for MEX3D, CATSPERB, SULT1E1, CEACAM7, CES1, MARCH6, GPD2, ATIC, GTF2H2, P4HAL, C2ORF54, GGCT, GUCY1A2, PPAP2B, MAP3K5, SMPDL3A, and SWAP70. Similar to previous cases, PSMD6 was found to be positively correlated with GOLGA4, PDCD6IP, ARL8B, GHITM, NGLY1, OXSM, CYP51P2, CYP51A1, CLU, APOOL, MRS2, SLC25A46, RNF14, VDACIP3, CLINT1, and SEC24A. We found that genes co-expressed with PSMD7 included NAE1, USP10, AP1G1, SETD6, NUP93, CBFB, BRD7, NFATC3, CNOTI, HNRNPD, CHMP1A, CFDP1, TAFIC, ZCCHC14, HSBP1, GOT2, CTCF, GPR56, and TMEM208. Genes co-expressed with PSMD8 included PSMC4, MRPS12, EIF3K, EIF3K, RPS16, COX6B1, DGUOK, TPRKB, RNF7, COX7A2, METTL5, ATP5J, ATP50, TOR3A, SDHB, MBD2, and ATP5G3. As for genes co-expressed with PSMD9, there were positive correlations with ARPC3, GNS, POP5, WSB2, RFC5, NTAN1, EPB41L3, EPB41L3, GCA, HMGN3, ASNAI, ICAM3, RAB8A, UPF1, PPPICA, OTUBI, JARIDZ, and PGD. Genes co-expressed with PSMD10 included UBEZN, C12orf29, TBC1D15, CCNT2, MAP4K3, MTX2, KDM6A, RNF13, C4orf43, UBE2K, PDS5A, CLIP1, CHD9, KIAA1033, PPPIR1ZA, and PPP1R12A. Moreover, PSMD11 was positively correlated with SUMOZ, PSMD12, KPNA2, HN1, HSPH1, INTS8, LSM6, ANAPC10, ABCE1, ABCE1, SMARCA5, GRHL2, TUG1, EPB41L4B, RPRD1A, and HSPD1. PSMD12 was found to be positively correlated with HELZ, LOC220594, FASTKD3, PHB, CCDC47, TEX2, TEX14, RAD51C, BCAS3, SLC4A8, BPTF, AMZ2, NOL11, BPTF, SMARCD2, PSMC5, FTSJ3, and TACOI. Genes co-expressed with PSMD13 included PSMC3, MRPL17, SPCS2, C7orf44, EWSR1, POLD3, ZNF84, ZNF140, ZNF268, NFYB, ZNF195, ANKLE2, GOLGA3, CHFR, NEK3, ELF1, ZC3H13, PHF11, and RCBTB1. Finally, genes co-expressed with PSMD14 were ATP2C1, ATP2C1, HSPE1, PDE6D, CISD1, COQ2, ZMYND11, NUDT21, PKM2, HPS5, SLBP, EIF3J, ETF1, SMN1, GNAI3, MAPRE1, CLCC1, PSMA5, C2orf47, and NDUFS1 (Figure 4).
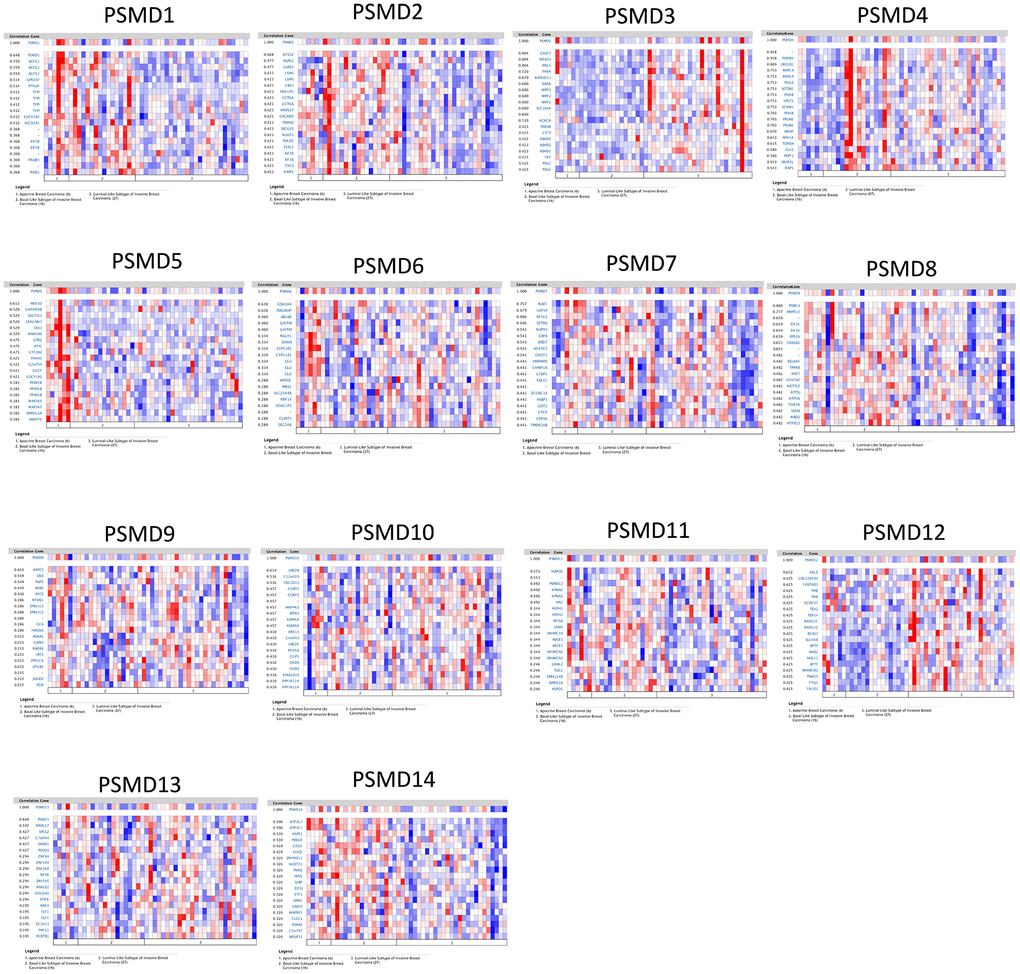
Figure 4. Heatmap co-expression profiles of 26S proteasome delta subunit, non -ATPase (PSMD) family members in breast cancer (BRCA). Genes co-expressed with each of the PSMD family members in term of BRCA patients are presented in a heatmap format (data extracted from the Oncomine database).
Relationships between disease prognostication and PSMD gene expression levels measured in tumor specimens
The Kaplan-Meier (KM) plotter database also indicated that most PSMD family members were associated with poor recurrence-free survival (RFS), except for PSMD9 and PSMD11. Higher expression levels of PSMD9 and PSMD11 were significantly associated with better survival rates of patients (Figure 5). We also validated these data from the NCBI GEO database (GSE21653) [54], and also obtained consistent data (Supplementary Figure 1). In addition, high expression levels of PSMD1, PSMD2, PSMD3, PSMD7, PSMD10, PSMD12, and PSMD14 were linked with poor distant metastasis-free survival (DMFS), whereas others were not (Figure 6). The RFS and DMFS data implied that these genes have oncogenic roles in BRCA progression. Therefore, we chose PSMD1, PSMD2, PSMD3, PSMD7, PSMD10, PSMD12, and PSMD14 as objectives for further bioinformatics analyses. Due to the fact that samples from BRCA patients displayed distinctly different expressions of PSMD family genes, we continued to explore how these target genes participate in particular metabolic pathways prior to investigating their clinical relevance. Therefore, the intensities of antibodies represented in clinical BRCA specimens were extracted from the Human Protein Atlas (HPA) for further analysis. Immunohistochemical (IHC) images revealed dense distributions of PSMD2 and PSMD4, while the other PSMDs, including PSMD1, PSMD2, PSMD3, PSMD7, PSMD12, and PSMD14, were moderately distributed in breast tumor samples (Figure 7).
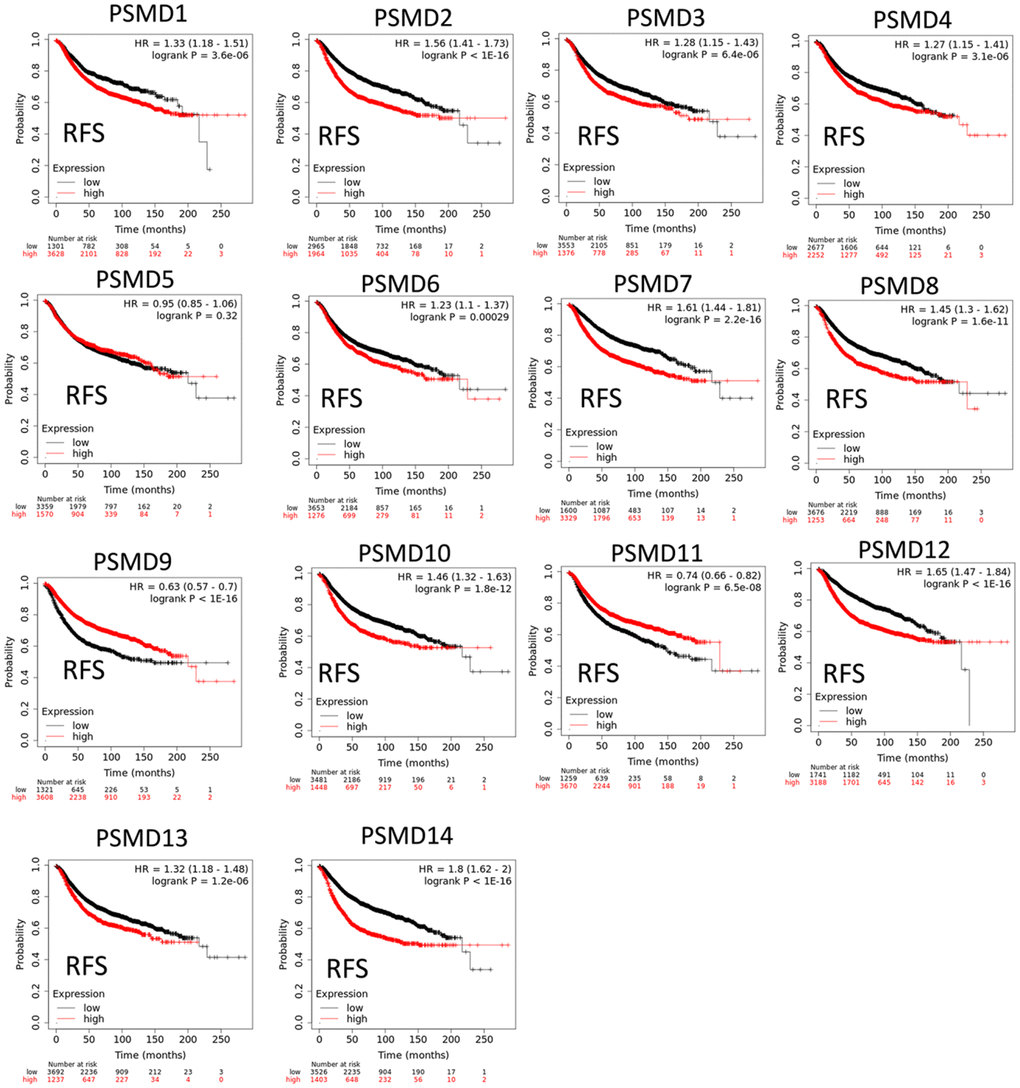
Figure 5. Significant correlations between mRNA levels of 26S proteasome delta subunit, non-ATPase (PSMD) family members and recurrence-free survival curve (RFS) of patients diagnosed with breast cancer (BRCA). The two survival curves respectively illustrate survival outcomes (including survival percentages and survival times) of BRCA patients with high (red) or low (black) expression levels of PSMD family members. Increased mRNA levels of target genes resulted in poor prognoses, while increasing levels of PSMD9 and PSMD11 were associated with favorable outcomes (p<0.05 was considered statistically significant).
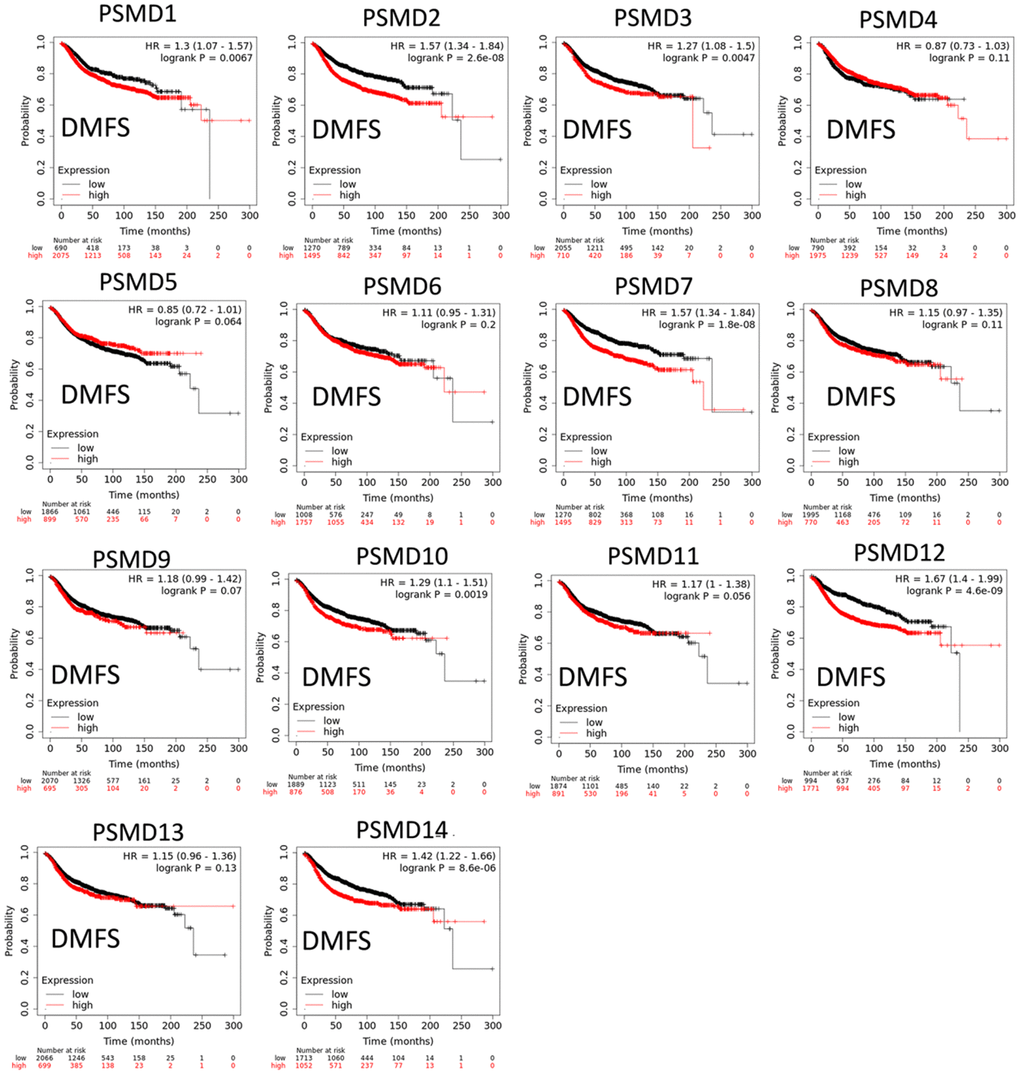
Figure 6. Significant correlations between mRNA levels of 26S proteasome delta subunit, non-ATPase (PSMD) family members, and distant metastasis-free survival (DMFS) curve of patients diagnosed with breast cancer (BRCA). The two survival curves respectively illustrate survival outcomes (including survival percentages and survival times) of BRCA patients with high (red) and low (black) expression levels of PSMD family members. Increased mRNA levels of target genes resulted in poor prognoses, except for PSMD4, PSMD5, PSMD6, PSMD8, PSMD9, PSMD11, and PSMD13 (p<0.05 was considered statistically significant).
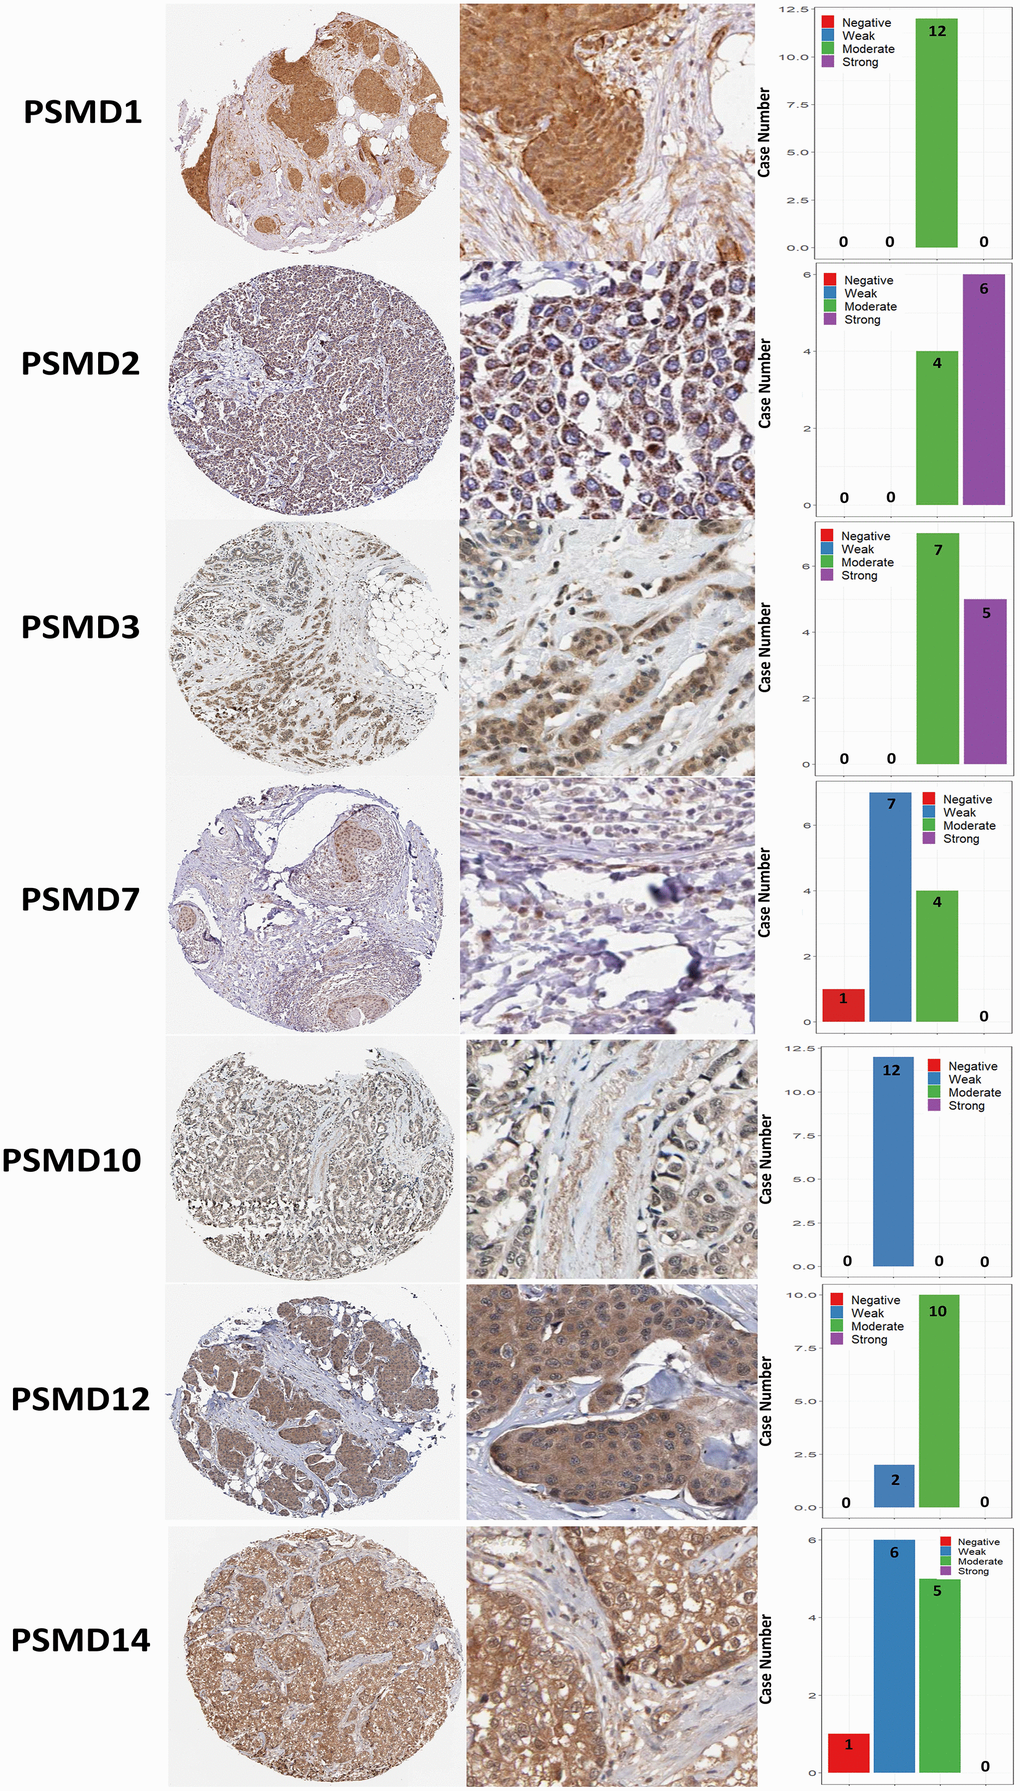
Figure 7. Immunohistochemical staining of 26S proteasome delta subunit, non-ATPase (PSMD) family members in normal tissues and breast cancer (BRCA) tissues represented in IHC staining images and bar chart. The images illustrate intensities of antibodies in both BRCA and adjacent normal tissues while the bar charts of IHC staining show intensities of PSMD family members in BRCA.
In addition, when we performed the required analysis using the Tumor Immune Estimation Resource (TIMER) database (available at: http://timer.cistrome.org/), PSMD member genes also showed relevance to immune infiltration profiles of BRCA, and the expression of each individual was related to tumor purity and markers of six tumor-infiltrating immune cell types which belonged to two separate groups: a lymphoid lineage (B cells, cluster of differentiation 4-positive (CD4+) T cells, and cluster of differentiation 8-positivie (CD8+) T cells) and myeloid lineage (neutrophils, macrophages, and dendritic cells) (Figure 8).
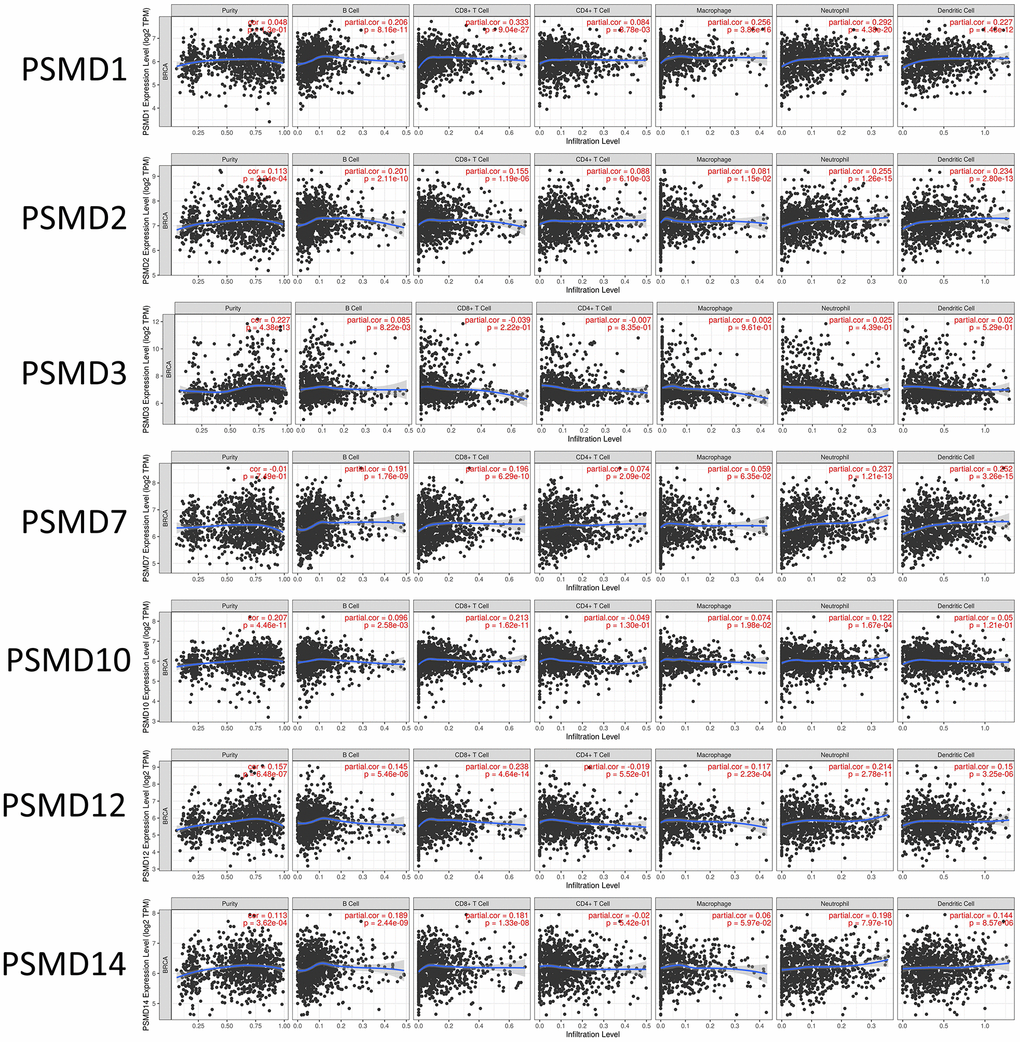
Figure 8. Correlations between expressions of 26S proteasome delta subunit, non-ATPase (PSMD) family members and immune infiltration profiles of breast cancer via the TIMER database. The figure shows correlations between each abnormally expressed gene of the PSMD family and levels of several tumor-infiltrating immune cell markers, such as B cells, cluster of differentiation 8-positive (CD8+) T cells, CD4+ T cells, macrophages, neutrophils, and dendritic cells.
Pathway and network analysis of PSMD family genes
Since some potential information for refining the full picture of regulated pathways available to PSMD family genes is still missing, GeneGo Metacore software was launched to extensively explore downstream networks linked to the aforementioned co-expression patterns of PSMD family genes. We obtained PSMD1 coexpression profiles of BRCA from available datasets from both METABRIC and TCGA. As a result, annotations of biological processes obtained from GeneGo Metacore showed that genes co-expressed with PSMD1 participated in several networks and cell cycle-related pathways such as “Cell cycle_Role of APC in cell cycle regulation”, “Cell cycle_The metaphase checkpoint”, “Cell cycle_Spindle assembly and chromosome separation”, “DNA damage_Intra S-phase checkpoint”, and “Cell cycle_Start of DNA replication in early S phase” (Figure 9 and Supplementary Table 2). PSMD2 was associated with “Cell cycle_Cell cycle (generic schema) Cell cycle_Start of DNA replication in early S phase”, “Cell cycle_Chromosome condensation in prometaphase”, “DNA damage_Intra S-phase checkpoint”, “Cell cycle_Role of SCF complex in cell cycle regulation”, and “Reproduction_Progesterone-mediated oocyte maturation” (Figure 10 and Supplementary Table 3). PSMD3 was involved in “Cell cycle_Role of Nek in cell cycle regulation”, “Transcription_Negative regulation of HIF1A function”, “DNA damage_Intra S-phase checkpoint”, “DNA damage_ATM/ATR regulation of G2/M checkpoint: cytoplasmic signaling”, “Cytoskeleton remodeling_Keratin filaments”, and “Regulation of degradation of deltaF508-CFTR in CF” (Figure 11 and Supplementary Table 4). PSMD7 was involved in “Cell cycle_ESR1 regulation of G1/S transition”, “The role of aberrations in CDKN2 locus and CDK4 in familial melanoma”, “Putative role of estrogen receptor and androgen receptor signaling in the progression of lung cancer”, “Signal transduction_Adenosine A3 receptor signaling pathway”, and “Transport_RAN regulation pathway” (Figure 12 and Supplementary Table 5). PSMD10 was involved in “DNA damage_Nucleotide excision repair”, “CFTR folding and maturation (normal and CF)”, “Immune response_Antigen presentation by MHC class II”, “Regulation of degradation of deltaF508-CFTR in CF”, “Cell cycle_Role of SCF complex in cell cycle regulation”, and “Immune response_BAFF-induced non-canonical NF-kB signaling” (Figure 13 and Supplementary Table 6). PSMD12 was involved in “DNA damage_ATM/ATR regulation of G2/M checkpoint: nuclear signaling”, “Cell cycle_Initiation of mitosis”, “Cell cycle_ESR1 regulation of G1/S transition”, “Cell cycle_Nucleocytoplasmic transport of CDK/cyclins”, and “Mitogenic action of estradiol/ESR1 (nuclear) in breast cancer” (Figure 14 and Supplementary Table 7). PSMD14 was involved in “Cell cycle_The metaphase checkpoint”, “Regulation of degradation of deltaF508-CFTR in CF”, “Cell cycle_Sister chromatid cohesion”, “Oxidative stress_Role of ASK1 under oxidative stress”, and “Transport_RAN regulation pathway” (Figure 15 and Supplementary Table 8). Meanwhile, we obtained similar results from the cBioPortal and the Cytoscape and METABRIC databases, which revealed that these PSMD members were correlated with metabolic pathways and the cancer development-related genes (Supplementary Figure 2).
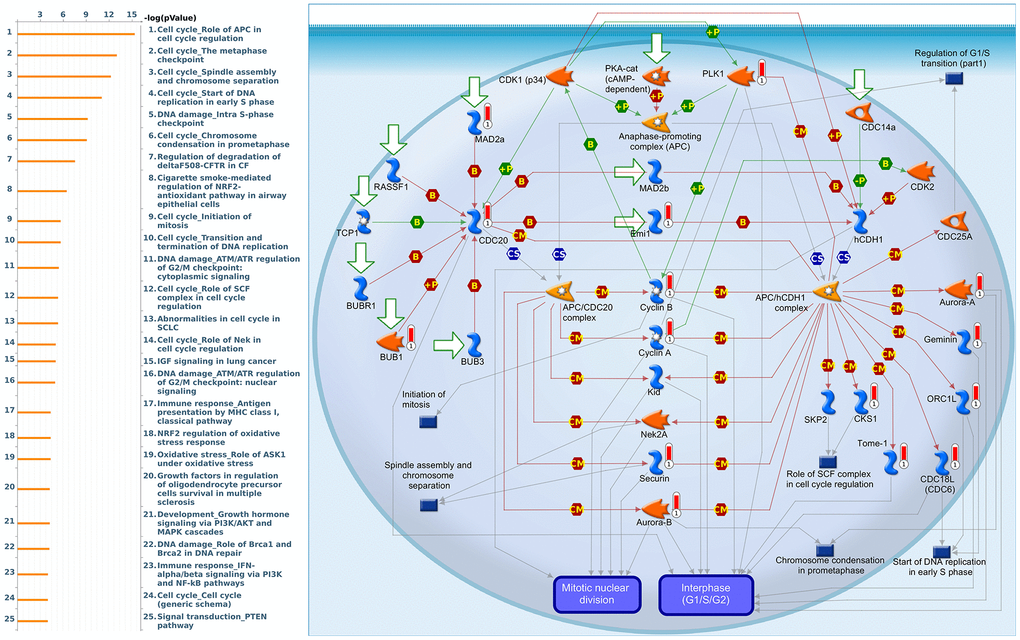
Figure 9. Cell cycle-related networks correlated with the 26S proteasome delta subunit, non-ATPase 1 (PSMD1) family gene in breast cancer (BRCA). MetaCore pathway analysis of biological processes revealed that pathways related to "Cell cycle_Role of APC in cell cycle regulation" were correlated with BRCA development.
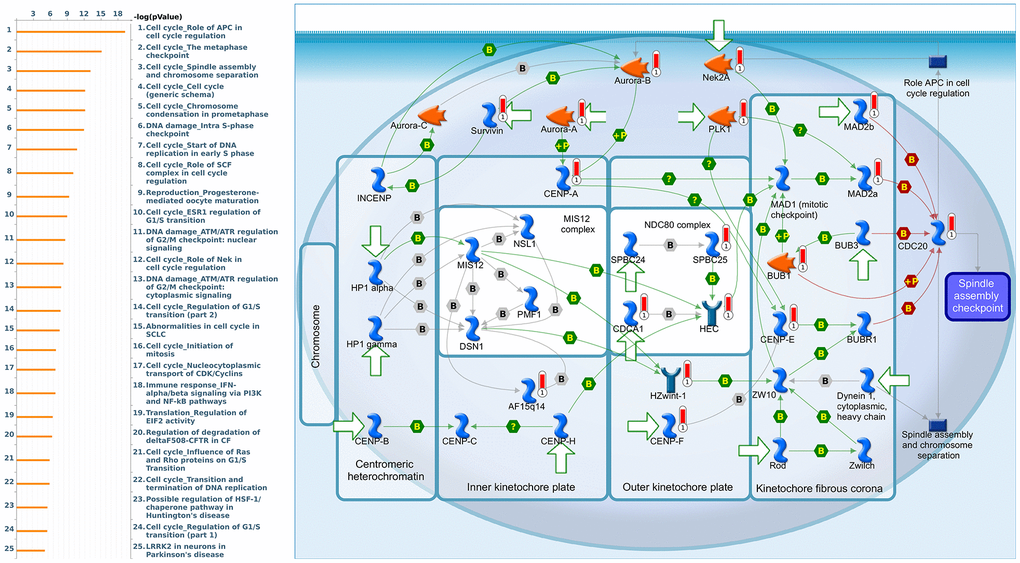
Figure 10. Cell cycle-related networks correlated with the 26S proteasome delta subunit, non-ATPase 2 (PSMD2) family gene in breast cancer (BRCA). MetaCore pathway analysis of biological processes revealed that pathways related to "Cell cycle_The metaphase checkpoint" were significantly associated with BRCA development.
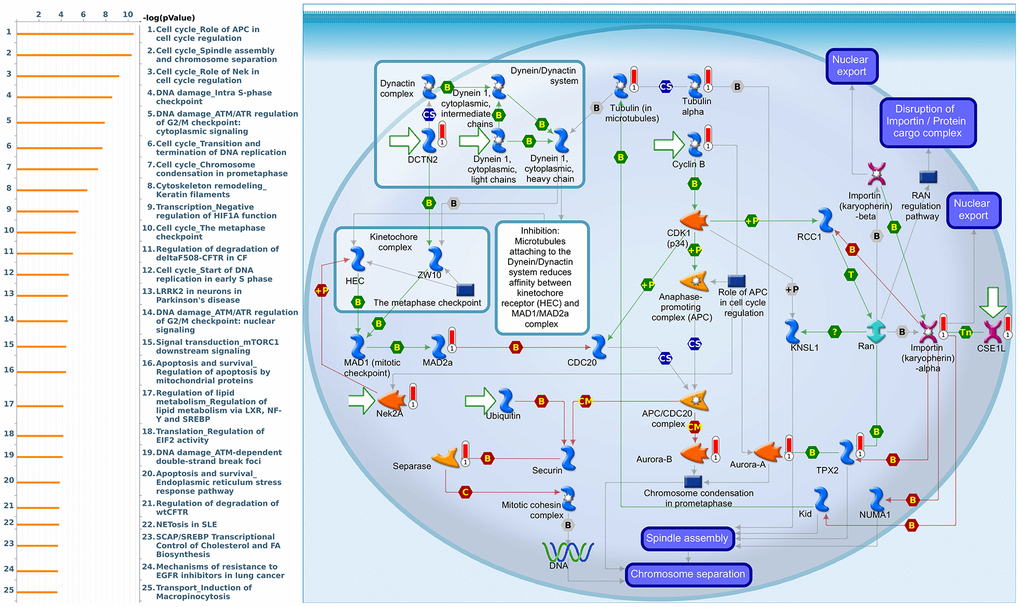
Figure 11. Cell cycle-related networks correlated with the 26S proteasome delta subunit, non-ATPase 3 (PSMD3) family gene in breast cancer (BRCA). MetaCore pathway analysis of biological processes revealed that pathways related to "Cell cycle_Spindle assembly and chromosome separation" were significantly associated with BRCA development.
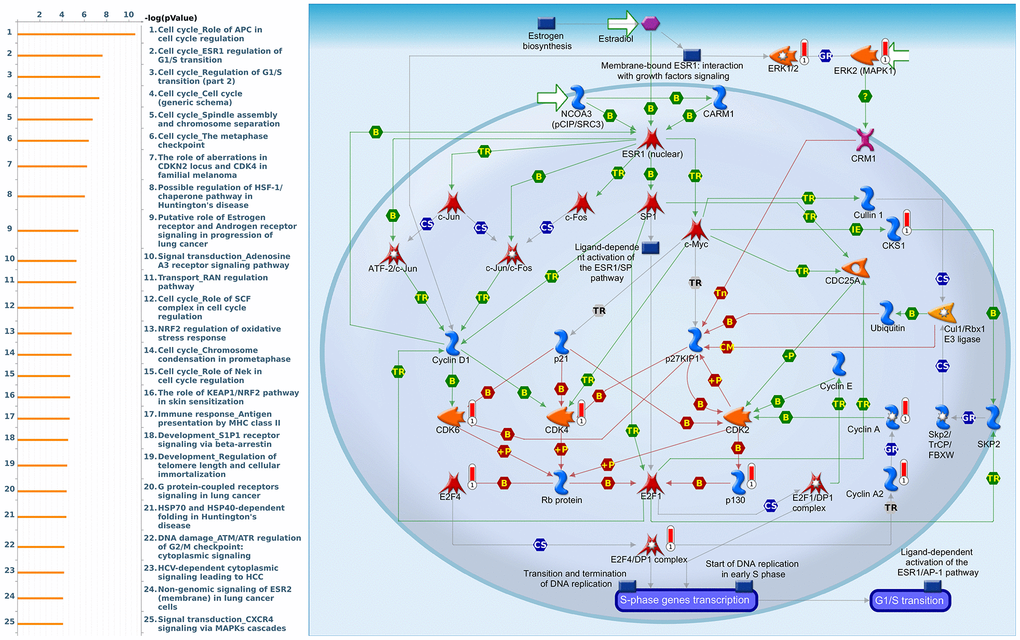
Figure 12. Cell cycle-related networks correlated with the 26S proteasome delta subunit, non-ATPase 7 (PSMD7) family gene in breast cancer (BRCA). MetaCore pathway analysis of biological processes revealed that pathways related to "Cell cycle_ESR1 regulation of G1S transition" were significantly associated with BRCA development.
Figure 13. Cell cycle-related networks correlated with the 26S proteasome delta subunit, non-ATPase 10 (PSMD10) family gene in breast cancer (BRCA). MetaCore pathway analysis of biological processes revealed that pathways related to "Immune response_Antigen presentation by MHC class II" were significantly associated with BRCA development.
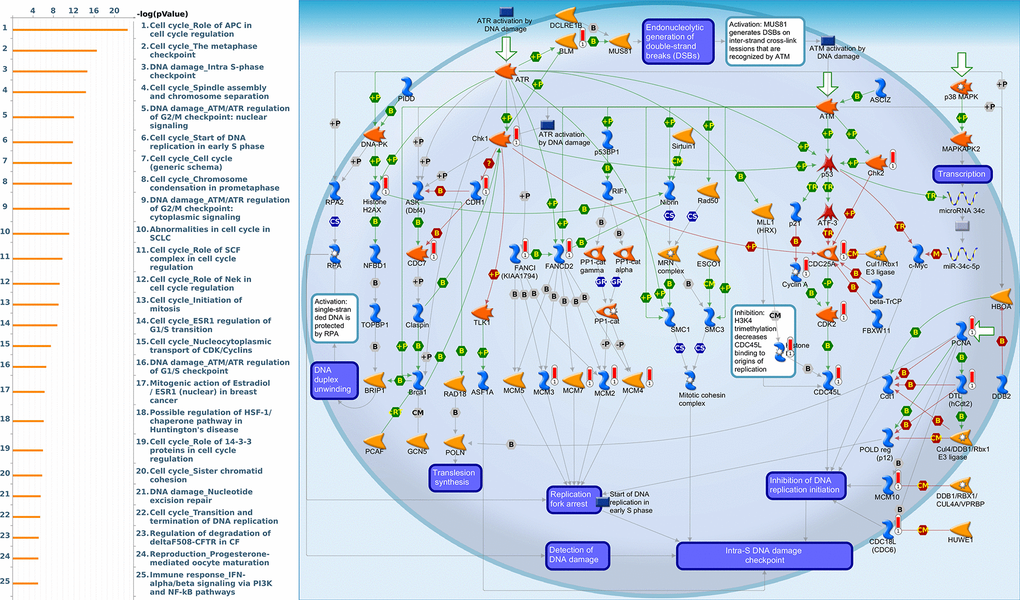
Figure 14. Cell cycle-related networks correlated with the 26S proteasome delta subunit, non-ATPase 12 (PSMD12) family gene in breast cancer (BRCA). MetaCore pathway analysis of biological processes revealed that pathways related to "DNA damage_Intra S-phase checkpoint" were significantly associated with BRCA development.
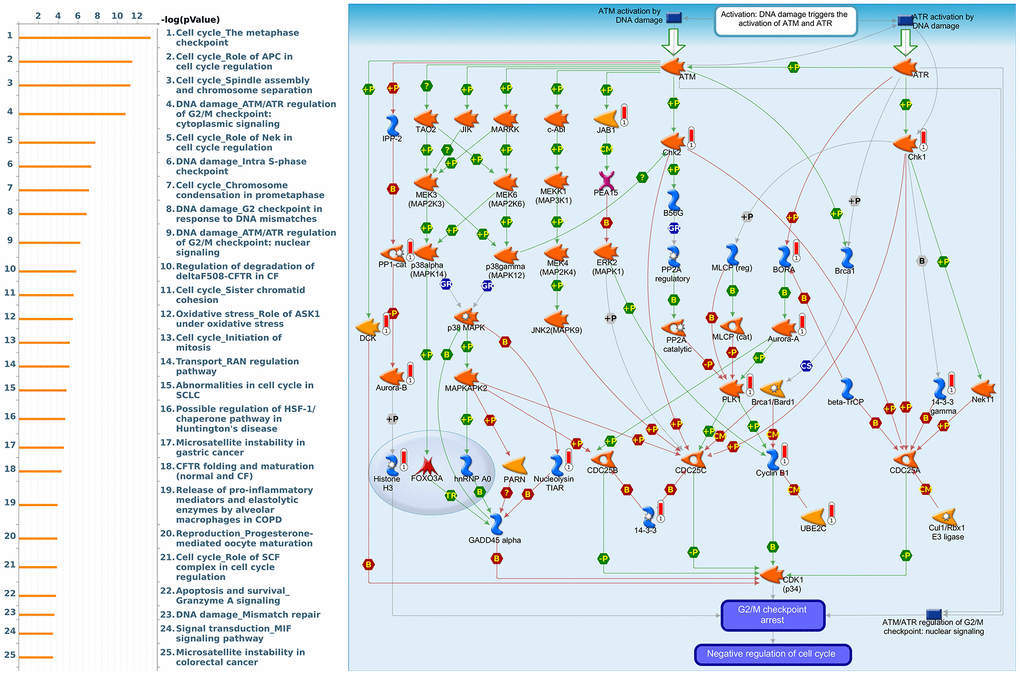
Figure 15. Cell cycle-related networks correlated with the 26S proteasome delta subunit, non-ATPase 14 (PSMD14) family gene in breast cancer (BRCA). MetaCore pathway analysis of biological processes revealed that pathways related to "DNA damage_ATMATR regulation of G2M checkpoint cytoplasmic signaling" were significantly associated with BRCA development.