


Introduction
According to statistical data of cancer incidence and mortality, breast cancer (BRCA) accounts for 30% of newly diagnosed cases of cancer among American women [1, 2]. The currently used stratification system is still undergoing changes due to the heterogeneity of this disease, which can be observed at both the molecular and histological levels. Based on the presence or absence of prevalent listed biomarkers, including: the estrogen receptor (ER), progesterone receptor (PR), human epidermal growth factor receptor (HER)-2, and some other markers. Stratifying BRCA not only helps in selecting treatment options but also assists in approximating treatment responses and predicting prognostic statuses.
Many different treatment strategies besides surgery are available for patients with BRCA. Treatment options are personalized and often based on a multi-modality approach, depending on several factors, including the stage and biology of the tumor (hormone receptor and nodal status); genomic markers (Oncotype DX™ or MammaPrint™) [3, 4]; patient age, physical condition, menopausal status, and the presence of inherited genetic mutations (such as BRCA1 or BRCA2); and a patient’s acceptance and tolerance of treatment regimens. Some treatments are standard, such as surgical therapy, radiotherapy, systemic therapy (endocrine therapy, chemotherapy, and targeted therapy), and immuno-therapy, while others are undergoing clinical trials. As one of the potential approaches, targeted therapies are selective inhibitors which only affect altered cancer cells [5, 6]. They precisely identify and attack specific molecules to block cancer growth, progression, and metastasis. Most targeted therapies are either monoclonal antibodies (mAbs) or small-molecule drugs (tyrosine kinase inhibitors, cyclin-dependent kinase inhibitors, poly (ADP-ribose) polymerase (PARP) inhibitors) and mammalian target of rapamycin (mTOR) inhibitors [7–9]. Nevertheless, drugs resistance which may develop soon after onset of this therapy is the main challenge to current research. Meanwhile, immunotherapeutic strategies, which are drugs designed to strengthen the body's natural defenses to fight cancer, have appreciably raised our expectations of successfully treating various cancer types [10–15]. In general, immunotherapies are further categorized into various subtypes, such as mAbs, immune checkpoint blockade (anti-cytotoxic T-lymphocyte-associated (CTLA)-4, anti-programmed death (PD)-1, anti-PD-ligand 1 (L1)), cytokine therapy, T-cell transfer therapy (including tumor-infiltrating lymphocytes (or TIL) therapy and chimeric antigen receptor (CAR) T Cell Therapy), and therapeutic vaccines. For instance, the immune checkpoint inhibitors that target the PD-1 pathway (pembrolizumab, atezolizumab, dostarlimab) are approved by the US Food and Drug Administration (FDA) for patients with metastatic TNBC [16–21]. According to recent literature, the abovementioned treatments for early BRCA determined by sub-classification have significantly improved the prognosis of BRCA patients with a 5-year survival rate of more than 85%. Therefore, it is crucial for us to understand the occurrence and development of breast cancer and to find biomarkers that indicates the sensitivity of current therapies and long-term outcomes in the early stage of the disease [22–28].
The ubiquitin-proteasome system is an indispensable mechanism of highly regulated intracellular protein degradation and turn over, thus dominates human antigen processing, signal transduction and cell-cycle regulation. The 26S proteasome is composed of one proteolytically active cylinder-shaped particle (the 20S proteasome), and one or two ATPase-containing complexes (known as the 19S cap complexes). The 20S core is constructed from inner α-rings and outer β-rings, which are both divided into 7 structurally similar subunits: proteasome 20S subunit α (PSMA1~7) and β (PSMB1~7), respectively. The 19S cap complexes is composed of a base and a lid subcomplex, further categorized into ATPase subunits (PSMC1~6) and non-ATPase subunits (PSMD1~14) [29–33]. In recent studies, dysfunction of the ubiquitin-proteasome system, which manifests as up- and/or downregulation of the aforementioned genes, has been described in various oncogenic situations. Hence, extensive research need to be conducted to fully assess the oncogenic potential of this family genes.
The PSMD family, which is comprised of 14 members in total, was proven to be partially involved in the formation of the regulatory complex. Both components occupy an important place in modulating the proteasome that performs several essential functions, such as catalyzing the unfolding and translocation of substrates into the 20S proteasome. Recent studies showed that PSMD1 and PSMD3 act as oncogenes in chronic myeloid leukemia by stabilizing nuclear factor (NF)-κB [34]. In gastric cancer, interactions between PSMD2 and asporin induced cell proliferation [35]. PSMD4 influenced cell malignancy of esophageal cancer via suppressing endoplasmic reticular (ER) stress [36]. PSMD5 inactivation promoted 26S proteasome assembly during colorectal tumor progression [37]. PSMD6, PSMD9, PSMD11, and PSMD14 expressions were significantly related to decreased survival chances in pancreatic ductal adenocarcinoma [38]. High-throughput technologies are widely used as systematic approaches to explore differences in expressions of thousands of genes in both biological and genomics systems [39–41]. Abnormal gene expressions are generally related to oncogenes and tumor-suppressor genes which regulate tumor maturation [42–47].
However, no studies have yet been conducted to develop data of how messenger (m)RNA levels of each PSMD family gene change in BRCA development. Therefore, this study aimed to make relevant comparisons of gene expressions in BRCA and normal tissues, by extracting information from public datasets, including numerous RNA-sequencing (RNA-Seq) and microarrays data of BRCA patients.
Moreover, we also explored the interactive cooperation or gene regulatory networks in which the targeted family genes were involved to identify completely novel biomarkers [48–53]. By adopting a meta-analytical approach, downstream molecules associated with PSMD genes were effectively screened. The study findings revealed that these PSMD family members and their regulated gene counterparts are worth considering as novel therapeutic targets for BRCA patients.
Results
PSMD family members are involved in important processes in the developmental stages of BRCA
Prior studies discovered PSMD family members in human and significant roles in cancer progression of some of them. To provide further identification of PSMD family gene signatures related to breast neoplasms, a meta-analysis was carried out. As reported by an Oncomine analysis of mRNA expressions among PSMD family members, including PSMD1, PSMD2, PSMD3, PSMD5, PSMD10, PSMD12, and PSMD14 are highly upregulated in BRCA tissues. It was suggested that their overexpression promotes tumor growth. Therefore, we decided to perform further bioinformatics analyses on BRCA (Figure 1). Since the Kaplan-Meier curves are univariate analysis, the univariate and multivariate Cox proportional hazards regression analysis, which works for both quantitative predictor variables and for categorical variables, was subsequently verified by TCGA-based breast cancer samples. Results was presented in Supplementary Table 1.
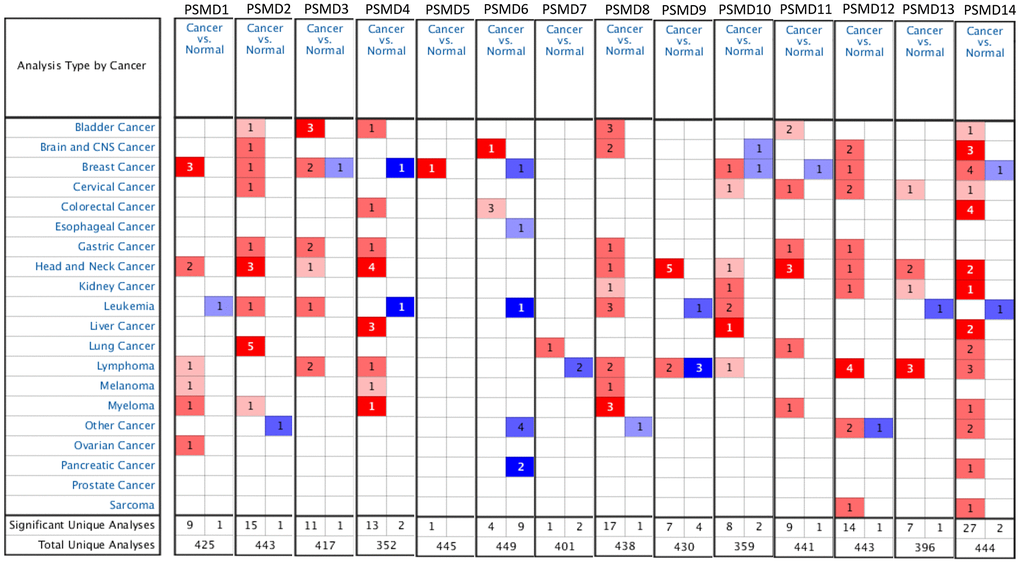
Figure 1. Systemic analysis of 26S proteasome delta subunit, non-ATPase (PSMD) family genes in 20 common types of cancer (Oncomine platform). Dysregulation of each PSMD individual gene in targeted cancer tissues as measured by the mRNA expression level was compared to their normal counterparts using Students’ t-test. The cutoff parameters were set as follows: p<0.05; multiple of change >2; and gene rank in the top 10%. The quantity of datasets which met those thresholds was represented as a number inside the table cells, while colors (red or blue) indicate the trend of gene expressions (up- or downregulation, respectively) and the intensity of colors indicates the degree of abnormal expression.
Associations of PSMD family gene interpretations in neoplastic cell lines with clinicopathological parameters of BRCA patients
After properly examining differences in PSMD family gene expressions between neoplastic and normal tissues using GEPIA2 datasets, we found that all mRNA levels of the former were upregulated compared to the latter, with the q-value cutoff set to <<0.001 (Figure 2). In addition, analysis performed on a Cancer Cell Line Encyclopedia (CCLE) dataset (https://www.broadinstitute.org/ccle) also indicated that PSMD mRNA levels were overexpressed in BRCA tissues (Figure 3).
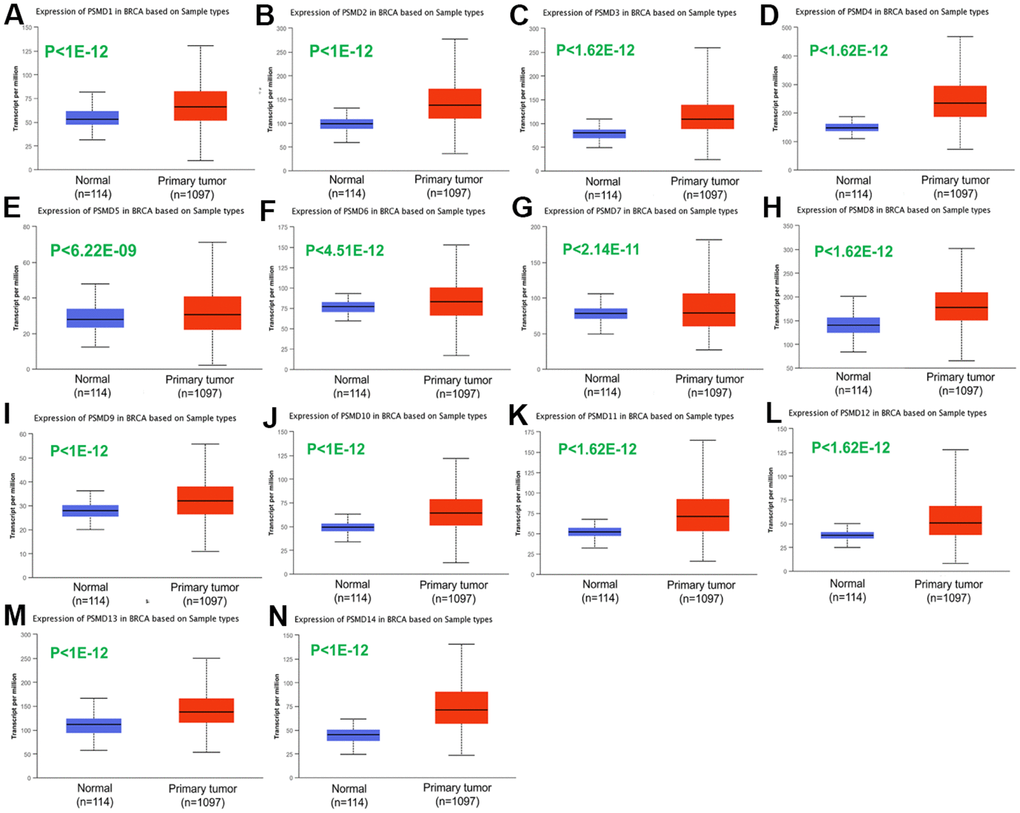
Figure 2. Transcriptional expression of 26S proteasome delta subunit, non-ATPase (PSMD) family members in breast cancer (BRCA) patients. (A–N) Transcriptome alterations observed in PSMD1~14. Boxplot of PSMD mRNA expression levels measured in BRCA specimens (red) compared to their normal counterparts (blue) obtained from the UALCAN database. Statistical analysis was performed using Student’s t-test, and p<0.05 was considered statistically significant.
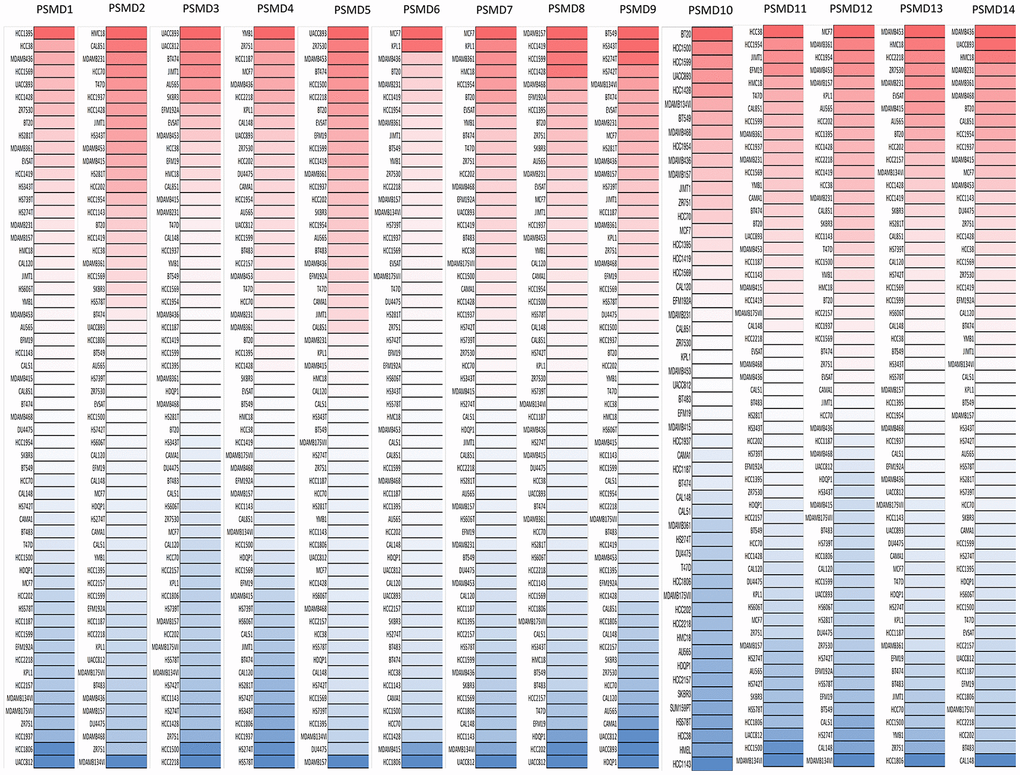
Figure 3. Expressions of 26S proteasome delta subunit, non-ATPase (PSMD) genes measured in common types of breast cancer (BRCA) cell lines. A CCLE database-built heatmap plot presents patterns of changes in expression levels of PSMD family genes among different BRCA cell lines. Shades of colors vary from red (overexpressed sample) to white (no change in gene expressions) and blue (under-expressed sample). The darker the colors are, the higher the gene expressions that were recorded.
Analysis of genes related to BRCA co-expressed with PSMD family genes
By leveraging the Oncomine online platform to perform a thorough analysis of the co-expression network of PSMD1, we found that PSMD1 was positively correlated with AGFG1, GPR107, PTH2R, TFPI, GUCY1A3, SLCO2Al, EIF5B, PAQR3, and ROD1. As for genes which are supposedly co-expressed with PSMD2, we concluded that its expression was positively correlated with EIF2S2, NUPL2, GLRX3, LSM5, CBX3, PAKIIP1, CCT6A, MRPS17, CHCHD2, PSMA2, SEC61G, NUDT1, POLD2, FSTL1, EIF3B, CYCS, and AIMP2. As for genes co-expressed with PSMD3, there were positive correlations with CASC3, MED24, MSL1, THRA, RAPGEFL1, RARA, WIPF2, SLC16A6, ACACA, PDESB, CST4, ABHD2, FRY, and POLG. Similarly, genes co-expressed with PSMD4 included UBE2Q1, MRPL9, POGZ, SETDB1, P14KB, VPS72, SCNM1, P14KB, PRUNE, ADAR, APH1A, TDRKH, CLK2, PRPF3, UBAPZL, and DAP3. Moreover, positive correlations with PSMD5 were determined for MEX3D, CATSPERB, SULT1E1, CEACAM7, CES1, MARCH6, GPD2, ATIC, GTF2H2, P4HAL, C2ORF54, GGCT, GUCY1A2, PPAP2B, MAP3K5, SMPDL3A, and SWAP70. Similar to previous cases, PSMD6 was found to be positively correlated with GOLGA4, PDCD6IP, ARL8B, GHITM, NGLY1, OXSM, CYP51P2, CYP51A1, CLU, APOOL, MRS2, SLC25A46, RNF14, VDACIP3, CLINT1, and SEC24A. We found that genes co-expressed with PSMD7 included NAE1, USP10, AP1G1, SETD6, NUP93, CBFB, BRD7, NFATC3, CNOTI, HNRNPD, CHMP1A, CFDP1, TAFIC, ZCCHC14, HSBP1, GOT2, CTCF, GPR56, and TMEM208. Genes co-expressed with PSMD8 included PSMC4, MRPS12, EIF3K, EIF3K, RPS16, COX6B1, DGUOK, TPRKB, RNF7, COX7A2, METTL5, ATP5J, ATP50, TOR3A, SDHB, MBD2, and ATP5G3. As for genes co-expressed with PSMD9, there were positive correlations with ARPC3, GNS, POP5, WSB2, RFC5, NTAN1, EPB41L3, EPB41L3, GCA, HMGN3, ASNAI, ICAM3, RAB8A, UPF1, PPPICA, OTUBI, JARIDZ, and PGD. Genes co-expressed with PSMD10 included UBEZN, C12orf29, TBC1D15, CCNT2, MAP4K3, MTX2, KDM6A, RNF13, C4orf43, UBE2K, PDS5A, CLIP1, CHD9, KIAA1033, PPPIR1ZA, and PPP1R12A. Moreover, PSMD11 was positively correlated with SUMOZ, PSMD12, KPNA2, HN1, HSPH1, INTS8, LSM6, ANAPC10, ABCE1, ABCE1, SMARCA5, GRHL2, TUG1, EPB41L4B, RPRD1A, and HSPD1. PSMD12 was found to be positively correlated with HELZ, LOC220594, FASTKD3, PHB, CCDC47, TEX2, TEX14, RAD51C, BCAS3, SLC4A8, BPTF, AMZ2, NOL11, BPTF, SMARCD2, PSMC5, FTSJ3, and TACOI. Genes co-expressed with PSMD13 included PSMC3, MRPL17, SPCS2, C7orf44, EWSR1, POLD3, ZNF84, ZNF140, ZNF268, NFYB, ZNF195, ANKLE2, GOLGA3, CHFR, NEK3, ELF1, ZC3H13, PHF11, and RCBTB1. Finally, genes co-expressed with PSMD14 were ATP2C1, ATP2C1, HSPE1, PDE6D, CISD1, COQ2, ZMYND11, NUDT21, PKM2, HPS5, SLBP, EIF3J, ETF1, SMN1, GNAI3, MAPRE1, CLCC1, PSMA5, C2orf47, and NDUFS1 (Figure 4).
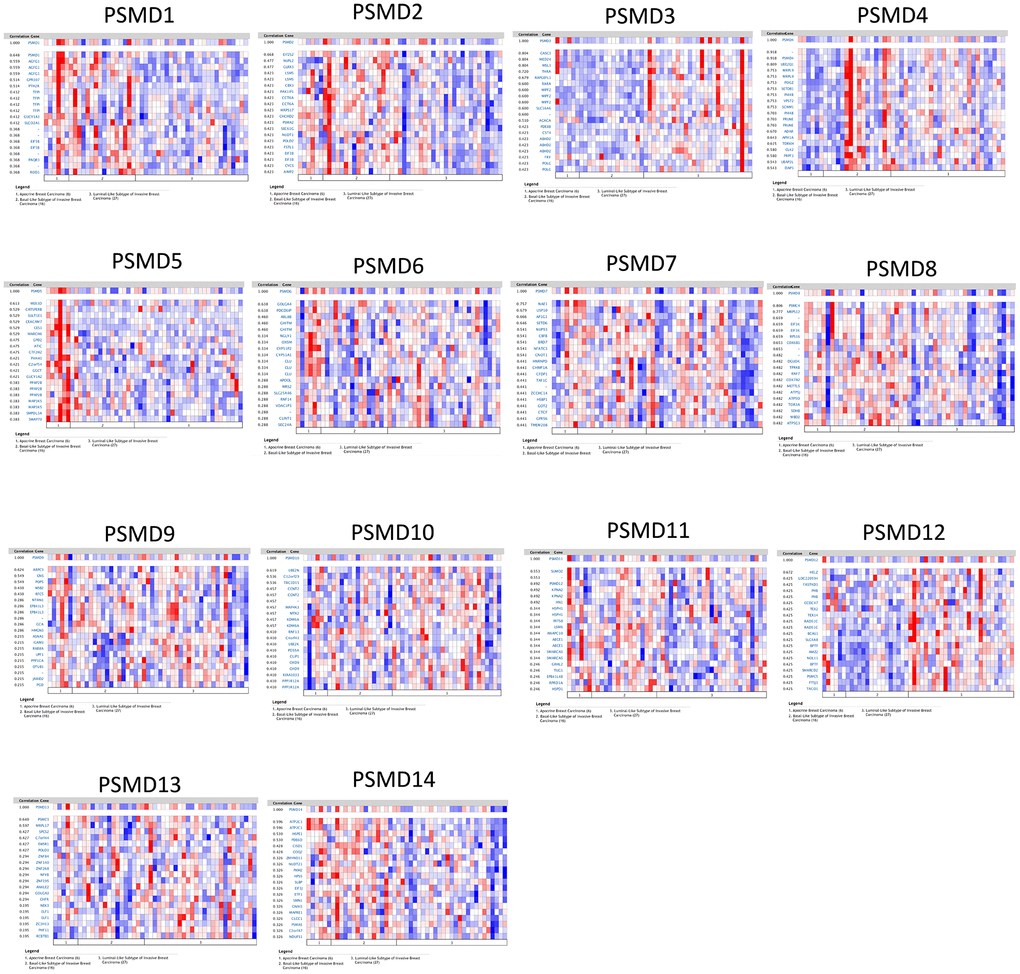
Figure 4. Heatmap co-expression profiles of 26S proteasome delta subunit, non -ATPase (PSMD) family members in breast cancer (BRCA). Genes co-expressed with each of the PSMD family members in term of BRCA patients are presented in a heatmap format (data extracted from the Oncomine database).
Relationships between disease prognostication and PSMD gene expression levels measured in tumor specimens
The Kaplan-Meier (KM) plotter database also indicated that most PSMD family members were associated with poor recurrence-free survival (RFS), except for PSMD9 and PSMD11. Higher expression levels of PSMD9 and PSMD11 were significantly associated with better survival rates of patients (Figure 5). We also validated these data from the NCBI GEO database (GSE21653) [54], and also obtained consistent data (Supplementary Figure 1). In addition, high expression levels of PSMD1, PSMD2, PSMD3, PSMD7, PSMD10, PSMD12, and PSMD14 were linked with poor distant metastasis-free survival (DMFS), whereas others were not (Figure 6). The RFS and DMFS data implied that these genes have oncogenic roles in BRCA progression. Therefore, we chose PSMD1, PSMD2, PSMD3, PSMD7, PSMD10, PSMD12, and PSMD14 as objectives for further bioinformatics analyses. Due to the fact that samples from BRCA patients displayed distinctly different expressions of PSMD family genes, we continued to explore how these target genes participate in particular metabolic pathways prior to investigating their clinical relevance. Therefore, the intensities of antibodies represented in clinical BRCA specimens were extracted from the Human Protein Atlas (HPA) for further analysis. Immunohistochemical (IHC) images revealed dense distributions of PSMD2 and PSMD4, while the other PSMDs, including PSMD1, PSMD2, PSMD3, PSMD7, PSMD12, and PSMD14, were moderately distributed in breast tumor samples (Figure 7).
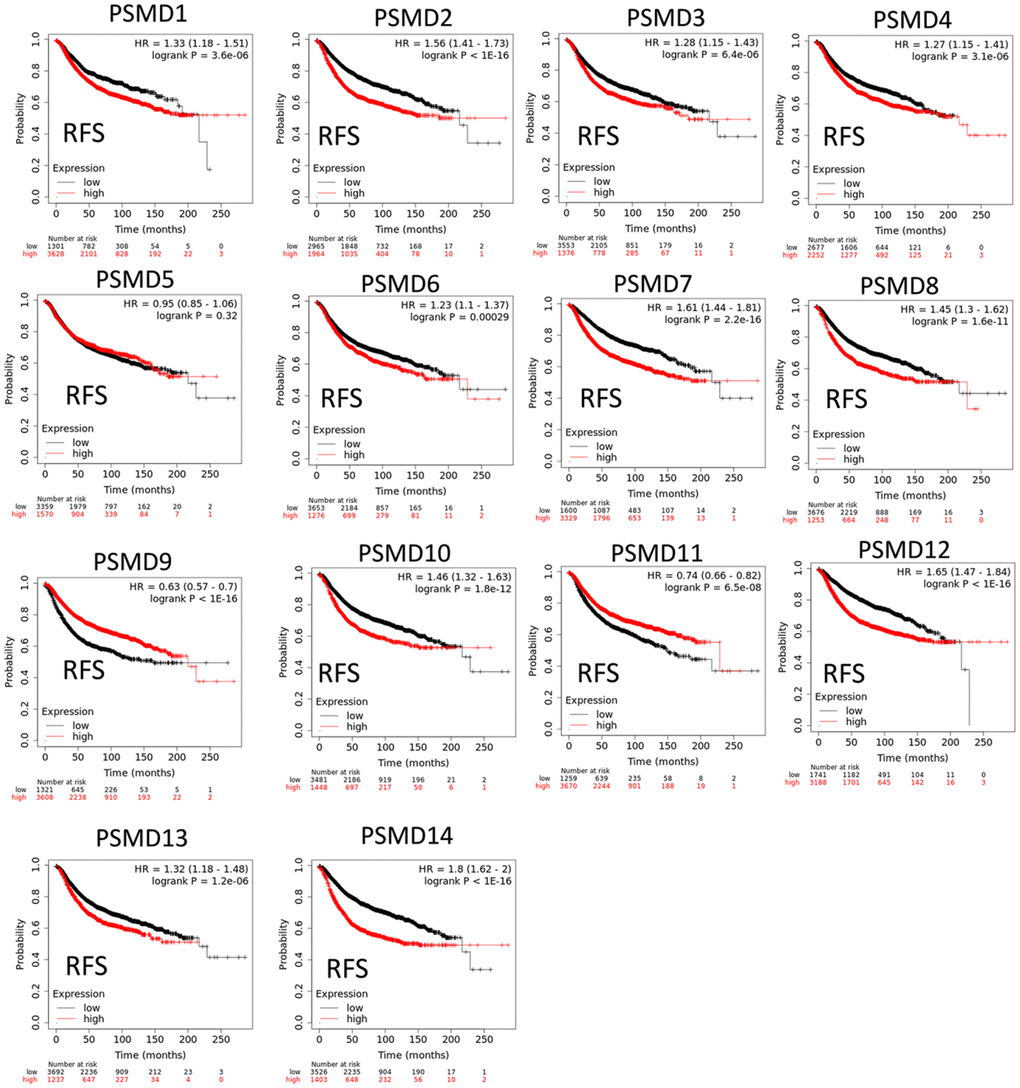
Figure 5. Significant correlations between mRNA levels of 26S proteasome delta subunit, non-ATPase (PSMD) family members and recurrence-free survival curve (RFS) of patients diagnosed with breast cancer (BRCA). The two survival curves respectively illustrate survival outcomes (including survival percentages and survival times) of BRCA patients with high (red) or low (black) expression levels of PSMD family members. Increased mRNA levels of target genes resulted in poor prognoses, while increasing levels of PSMD9 and PSMD11 were associated with favorable outcomes (p<0.05 was considered statistically significant).
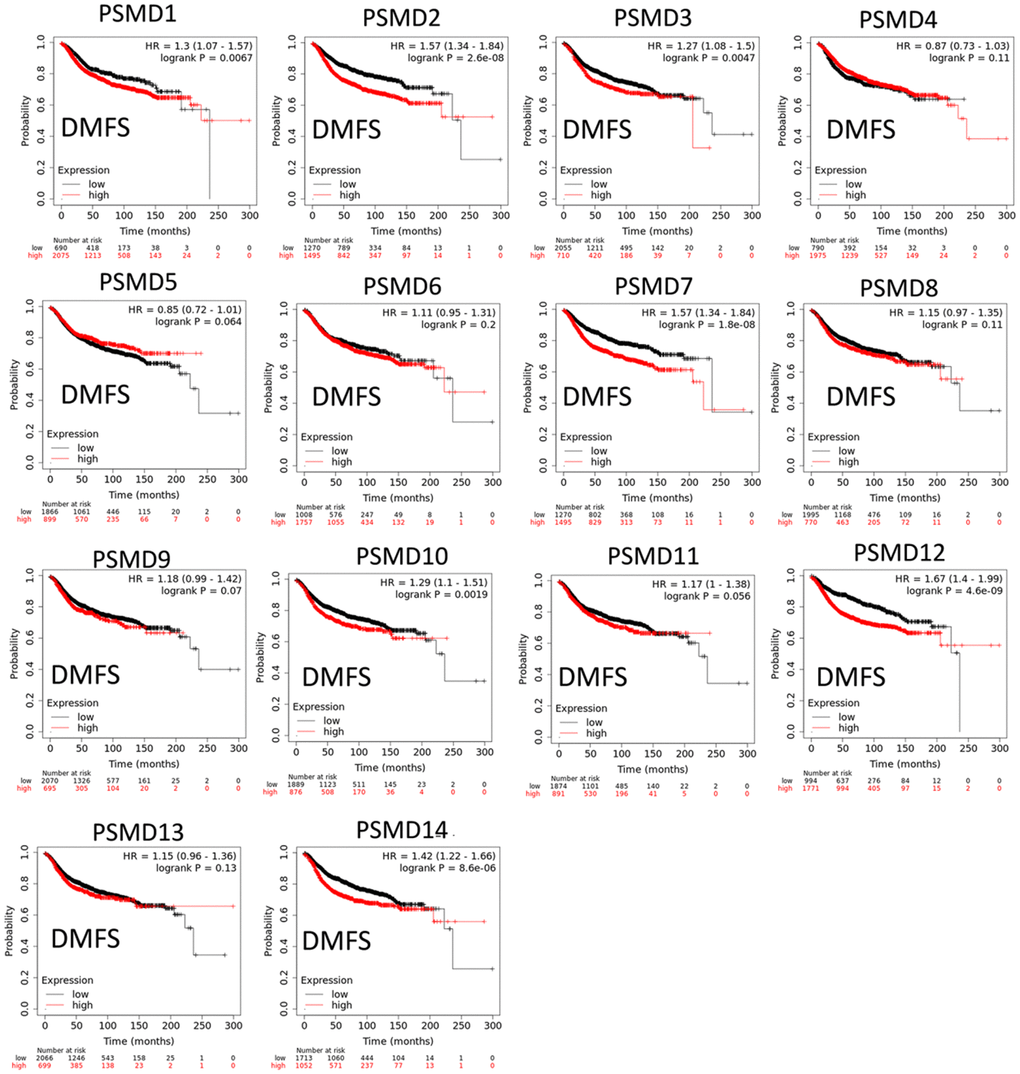
Figure 6. Significant correlations between mRNA levels of 26S proteasome delta subunit, non-ATPase (PSMD) family members, and distant metastasis-free survival (DMFS) curve of patients diagnosed with breast cancer (BRCA). The two survival curves respectively illustrate survival outcomes (including survival percentages and survival times) of BRCA patients with high (red) and low (black) expression levels of PSMD family members. Increased mRNA levels of target genes resulted in poor prognoses, except for PSMD4, PSMD5, PSMD6, PSMD8, PSMD9, PSMD11, and PSMD13 (p<0.05 was considered statistically significant).
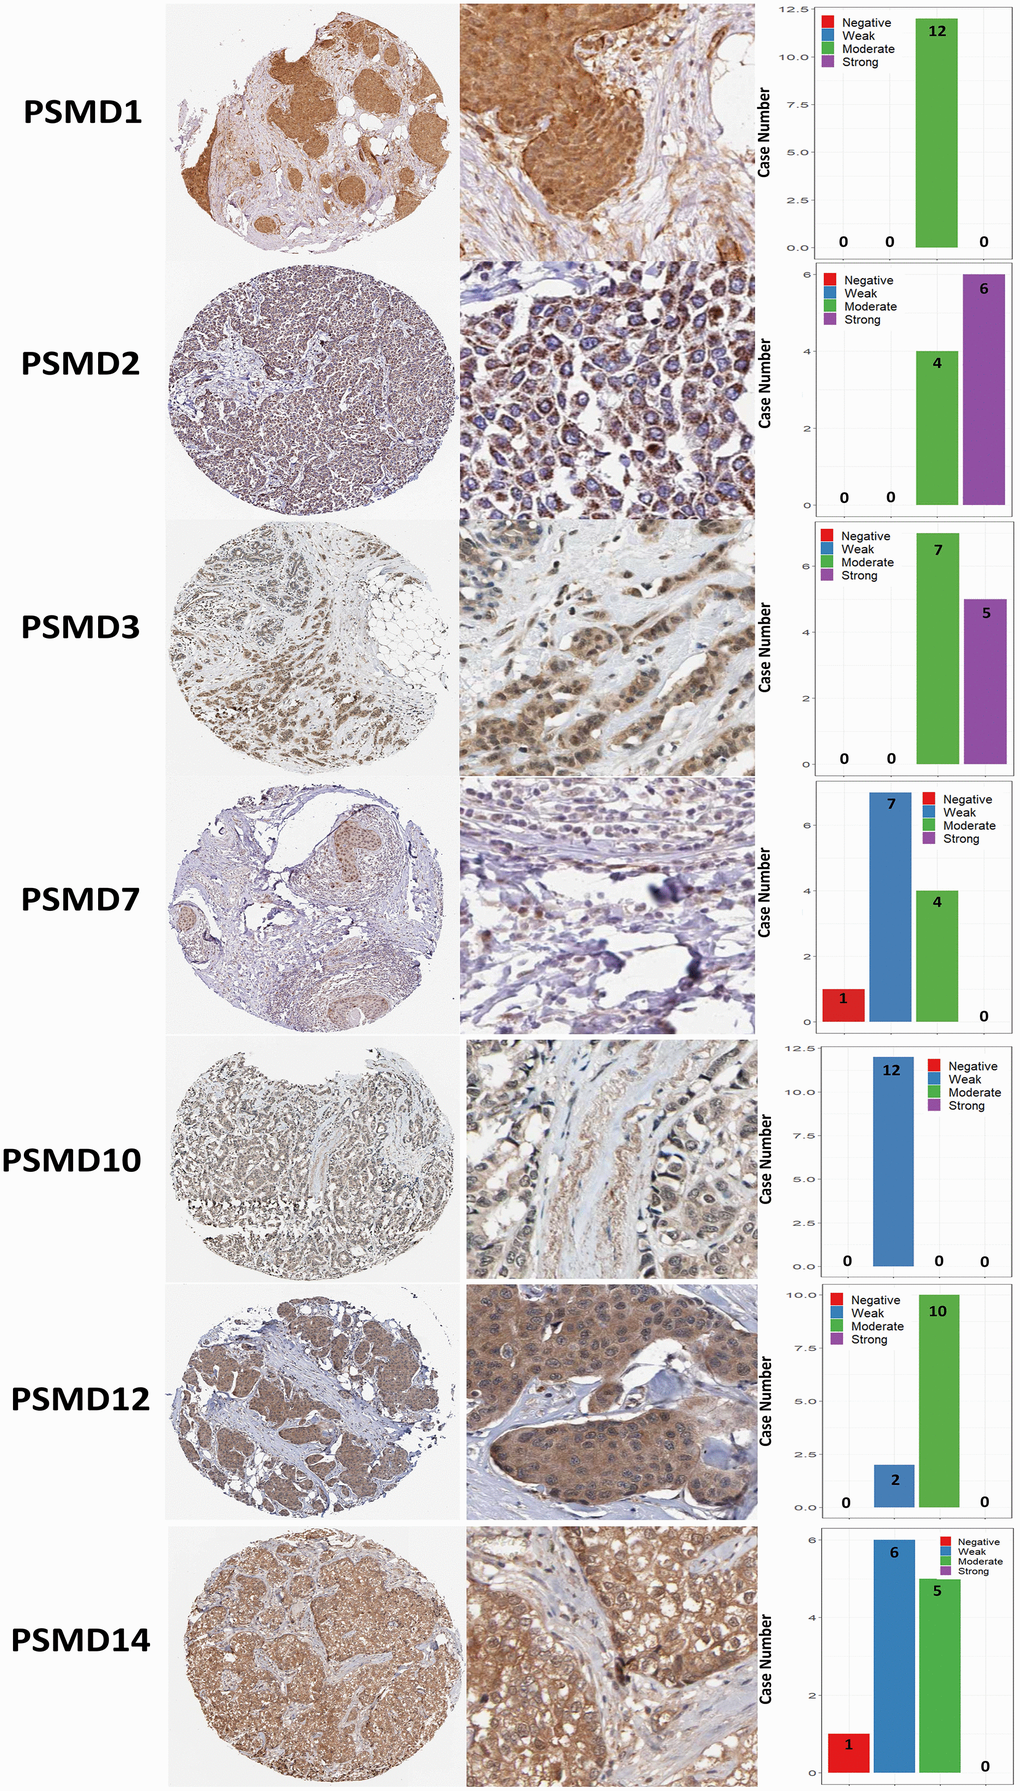
Figure 7. Immunohistochemical staining of 26S proteasome delta subunit, non-ATPase (PSMD) family members in normal tissues and breast cancer (BRCA) tissues represented in IHC staining images and bar chart. The images illustrate intensities of antibodies in both BRCA and adjacent normal tissues while the bar charts of IHC staining show intensities of PSMD family members in BRCA.
In addition, when we performed the required analysis using the Tumor Immune Estimation Resource (TIMER) database (available at: http://timer.cistrome.org/), PSMD member genes also showed relevance to immune infiltration profiles of BRCA, and the expression of each individual was related to tumor purity and markers of six tumor-infiltrating immune cell types which belonged to two separate groups: a lymphoid lineage (B cells, cluster of differentiation 4-positive (CD4+) T cells, and cluster of differentiation 8-positivie (CD8+) T cells) and myeloid lineage (neutrophils, macrophages, and dendritic cells) (Figure 8).
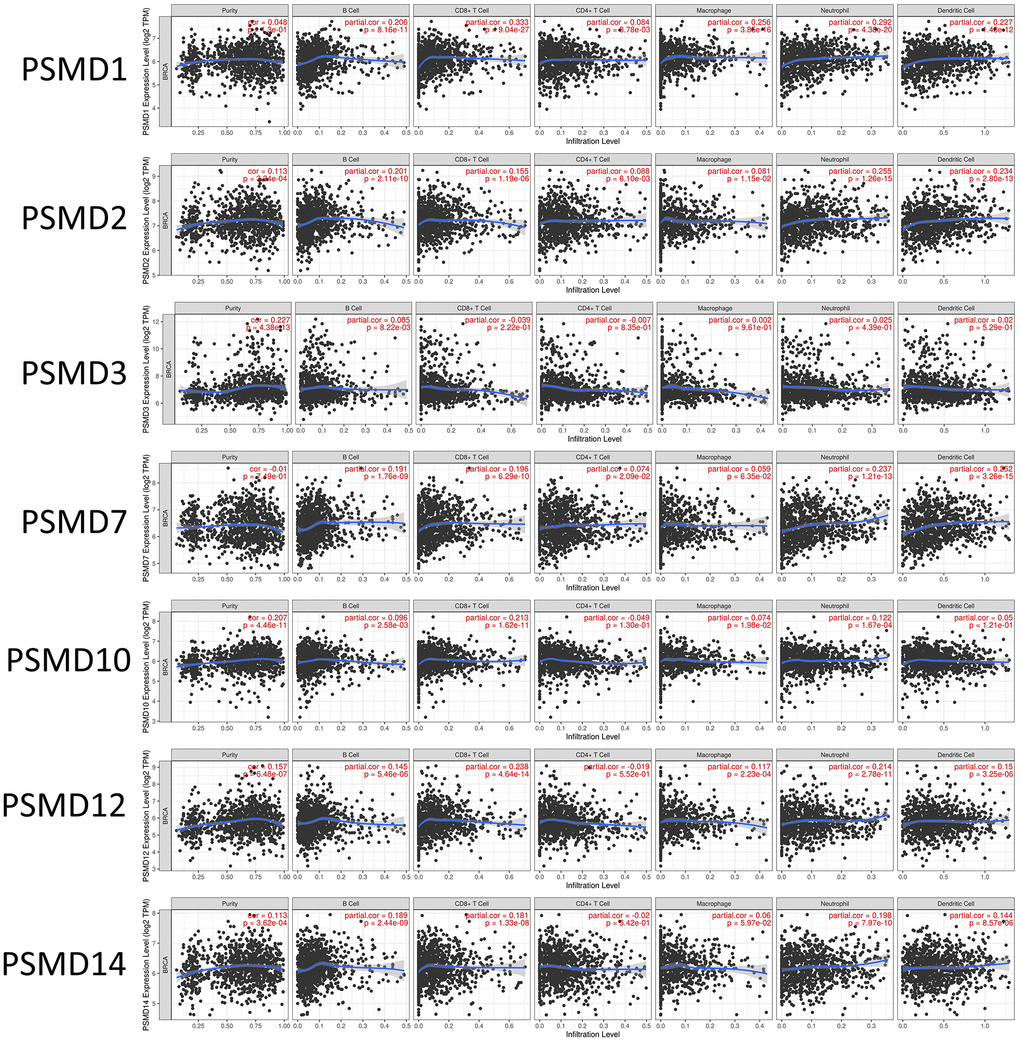
Figure 8. Correlations between expressions of 26S proteasome delta subunit, non-ATPase (PSMD) family members and immune infiltration profiles of breast cancer via the TIMER database. The figure shows correlations between each abnormally expressed gene of the PSMD family and levels of several tumor-infiltrating immune cell markers, such as B cells, cluster of differentiation 8-positive (CD8+) T cells, CD4+ T cells, macrophages, neutrophils, and dendritic cells.
Pathway and network analysis of PSMD family genes
Since some potential information for refining the full picture of regulated pathways available to PSMD family genes is still missing, GeneGo Metacore software was launched to extensively explore downstream networks linked to the aforementioned co-expression patterns of PSMD family genes. We obtained PSMD1 coexpression profiles of BRCA from available datasets from both METABRIC and TCGA. As a result, annotations of biological processes obtained from GeneGo Metacore showed that genes co-expressed with PSMD1 participated in several networks and cell cycle-related pathways such as “Cell cycle_Role of APC in cell cycle regulation”, “Cell cycle_The metaphase checkpoint”, “Cell cycle_Spindle assembly and chromosome separation”, “DNA damage_Intra S-phase checkpoint”, and “Cell cycle_Start of DNA replication in early S phase” (Figure 9 and Supplementary Table 2). PSMD2 was associated with “Cell cycle_Cell cycle (generic schema) Cell cycle_Start of DNA replication in early S phase”, “Cell cycle_Chromosome condensation in prometaphase”, “DNA damage_Intra S-phase checkpoint”, “Cell cycle_Role of SCF complex in cell cycle regulation”, and “Reproduction_Progesterone-mediated oocyte maturation” (Figure 10 and Supplementary Table 3). PSMD3 was involved in “Cell cycle_Role of Nek in cell cycle regulation”, “Transcription_Negative regulation of HIF1A function”, “DNA damage_Intra S-phase checkpoint”, “DNA damage_ATM/ATR regulation of G2/M checkpoint: cytoplasmic signaling”, “Cytoskeleton remodeling_Keratin filaments”, and “Regulation of degradation of deltaF508-CFTR in CF” (Figure 11 and Supplementary Table 4). PSMD7 was involved in “Cell cycle_ESR1 regulation of G1/S transition”, “The role of aberrations in CDKN2 locus and CDK4 in familial melanoma”, “Putative role of estrogen receptor and androgen receptor signaling in the progression of lung cancer”, “Signal transduction_Adenosine A3 receptor signaling pathway”, and “Transport_RAN regulation pathway” (Figure 12 and Supplementary Table 5). PSMD10 was involved in “DNA damage_Nucleotide excision repair”, “CFTR folding and maturation (normal and CF)”, “Immune response_Antigen presentation by MHC class II”, “Regulation of degradation of deltaF508-CFTR in CF”, “Cell cycle_Role of SCF complex in cell cycle regulation”, and “Immune response_BAFF-induced non-canonical NF-kB signaling” (Figure 13 and Supplementary Table 6). PSMD12 was involved in “DNA damage_ATM/ATR regulation of G2/M checkpoint: nuclear signaling”, “Cell cycle_Initiation of mitosis”, “Cell cycle_ESR1 regulation of G1/S transition”, “Cell cycle_Nucleocytoplasmic transport of CDK/cyclins”, and “Mitogenic action of estradiol/ESR1 (nuclear) in breast cancer” (Figure 14 and Supplementary Table 7). PSMD14 was involved in “Cell cycle_The metaphase checkpoint”, “Regulation of degradation of deltaF508-CFTR in CF”, “Cell cycle_Sister chromatid cohesion”, “Oxidative stress_Role of ASK1 under oxidative stress”, and “Transport_RAN regulation pathway” (Figure 15 and Supplementary Table 8). Meanwhile, we obtained similar results from the cBioPortal and the Cytoscape and METABRIC databases, which revealed that these PSMD members were correlated with metabolic pathways and the cancer development-related genes (Supplementary Figure 2).
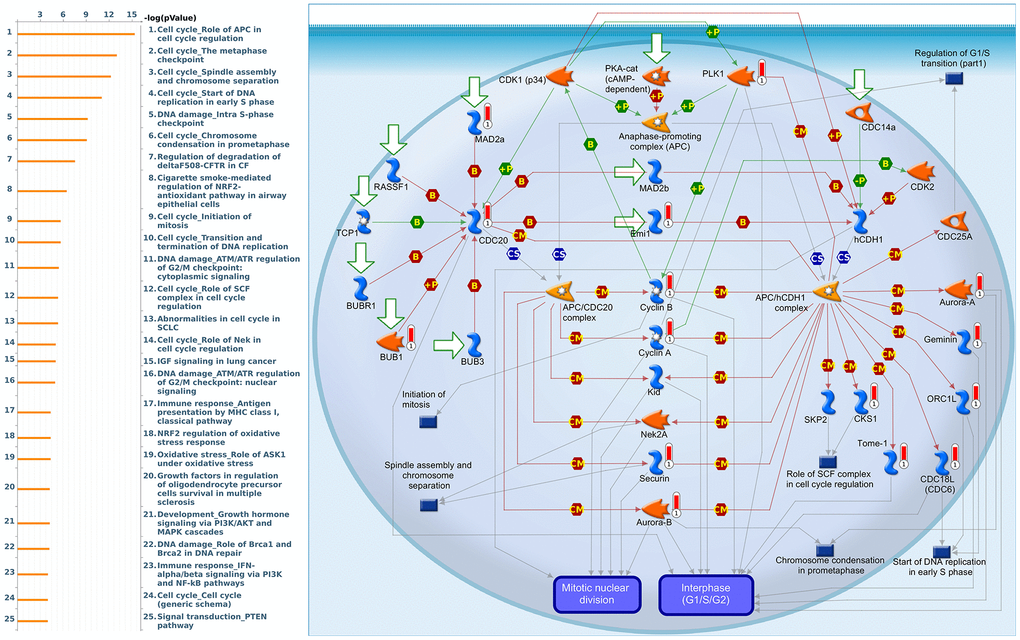
Figure 9. Cell cycle-related networks correlated with the 26S proteasome delta subunit, non-ATPase 1 (PSMD1) family gene in breast cancer (BRCA). MetaCore pathway analysis of biological processes revealed that pathways related to "Cell cycle_Role of APC in cell cycle regulation" were correlated with BRCA development.
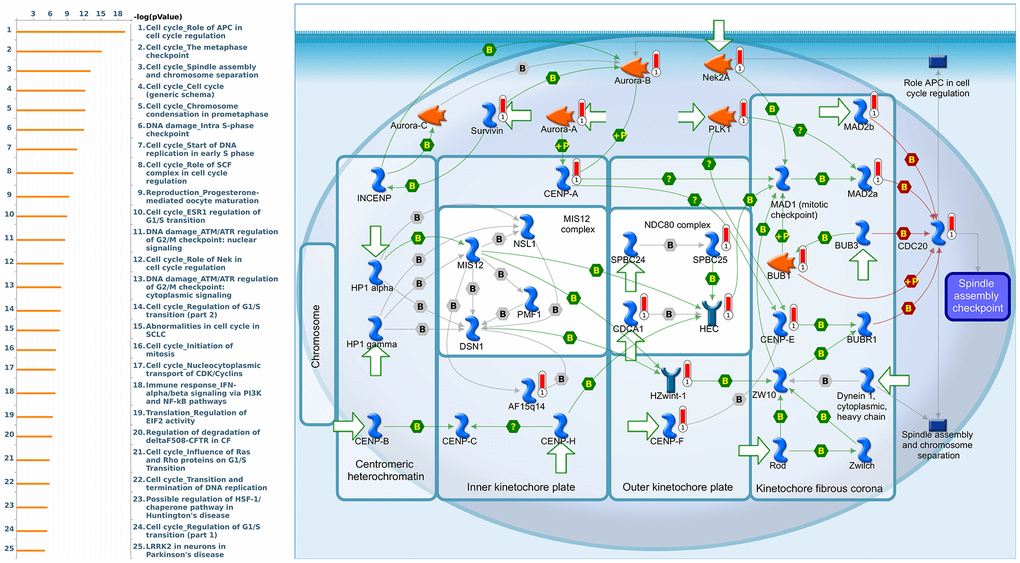
Figure 10. Cell cycle-related networks correlated with the 26S proteasome delta subunit, non-ATPase 2 (PSMD2) family gene in breast cancer (BRCA). MetaCore pathway analysis of biological processes revealed that pathways related to "Cell cycle_The metaphase checkpoint" were significantly associated with BRCA development.
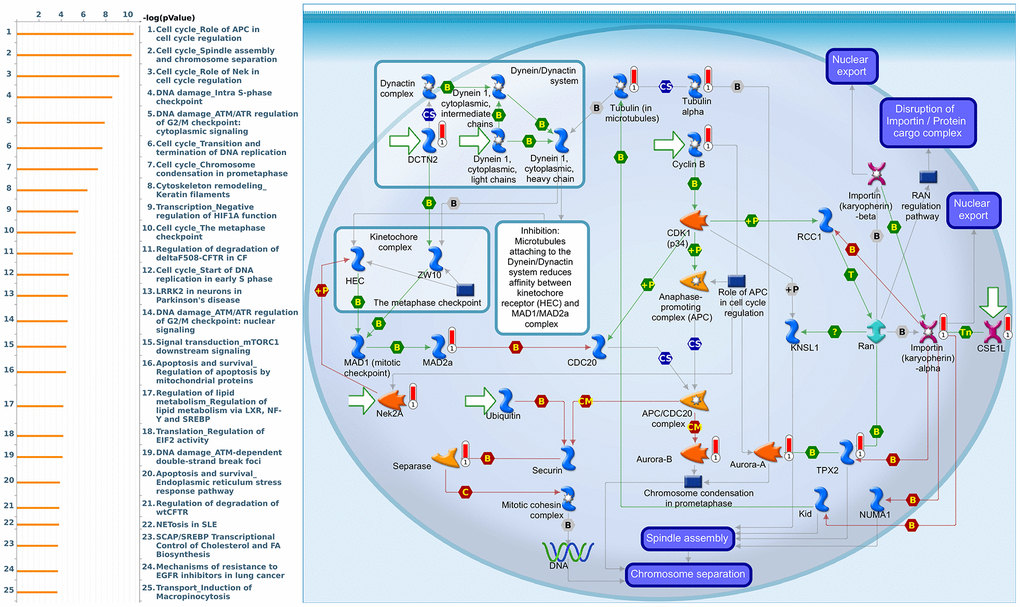
Figure 11. Cell cycle-related networks correlated with the 26S proteasome delta subunit, non-ATPase 3 (PSMD3) family gene in breast cancer (BRCA). MetaCore pathway analysis of biological processes revealed that pathways related to "Cell cycle_Spindle assembly and chromosome separation" were significantly associated with BRCA development.
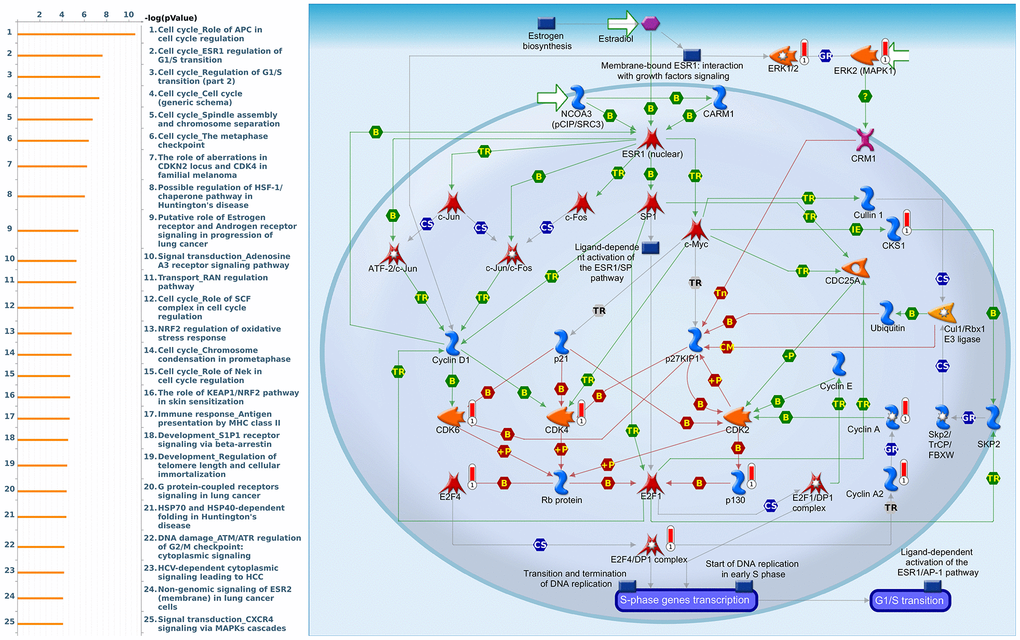
Figure 12. Cell cycle-related networks correlated with the 26S proteasome delta subunit, non-ATPase 7 (PSMD7) family gene in breast cancer (BRCA). MetaCore pathway analysis of biological processes revealed that pathways related to "Cell cycle_ESR1 regulation of G1S transition" were significantly associated with BRCA development.
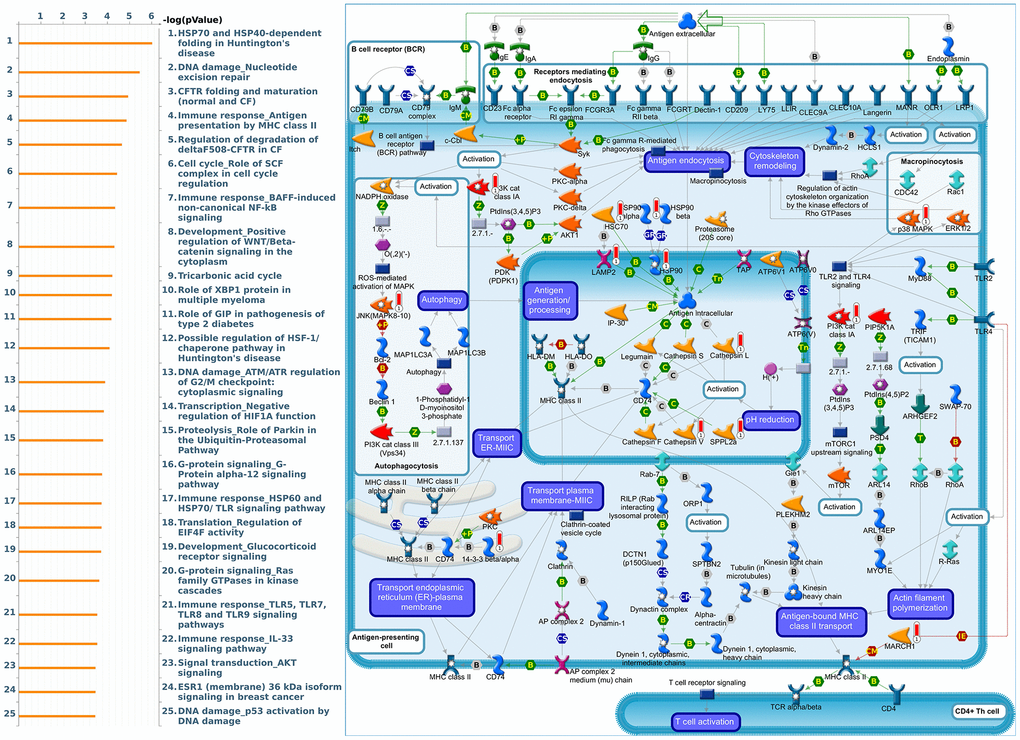
Figure 13. Cell cycle-related networks correlated with the 26S proteasome delta subunit, non-ATPase 10 (PSMD10) family gene in breast cancer (BRCA). MetaCore pathway analysis of biological processes revealed that pathways related to "Immune response_Antigen presentation by MHC class II" were significantly associated with BRCA development.
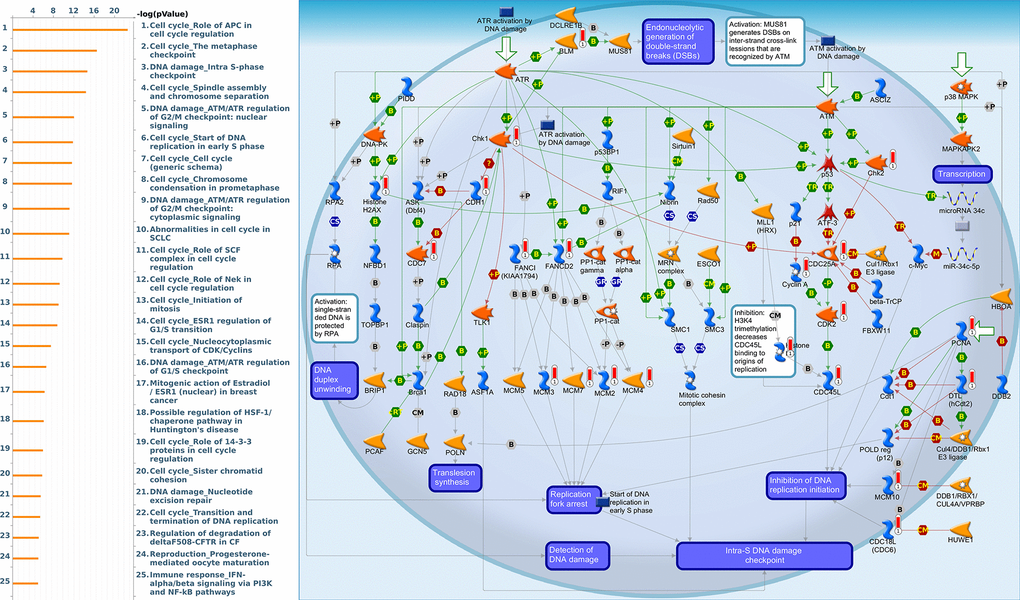
Figure 14. Cell cycle-related networks correlated with the 26S proteasome delta subunit, non-ATPase 12 (PSMD12) family gene in breast cancer (BRCA). MetaCore pathway analysis of biological processes revealed that pathways related to "DNA damage_Intra S-phase checkpoint" were significantly associated with BRCA development.
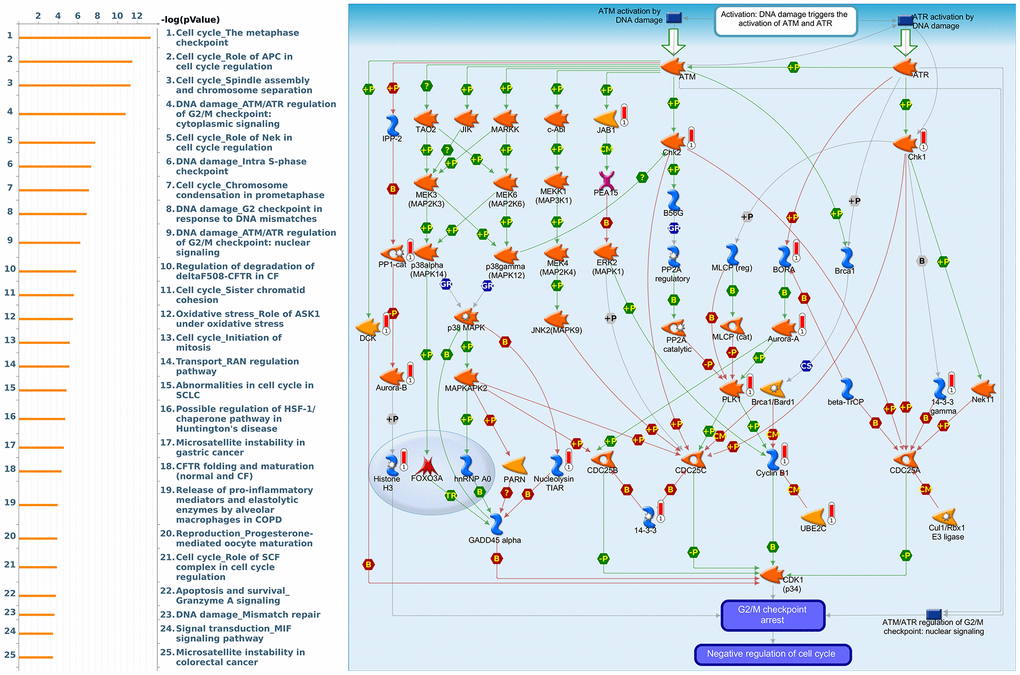
Figure 15. Cell cycle-related networks correlated with the 26S proteasome delta subunit, non-ATPase 14 (PSMD14) family gene in breast cancer (BRCA). MetaCore pathway analysis of biological processes revealed that pathways related to "DNA damage_ATMATR regulation of G2M checkpoint cytoplasmic signaling" were significantly associated with BRCA development.
Discussion
Recent epidemiologic studies indicated that BRCA has been displaced lung cancer in term of the most frequently diagnosed cases among women globally. Despite some improvements having been made in medical and surgical treatments of BRCA, a shortage of detection methods for early screening or diagnosis, accompanied by high risks of metastasis, chemoresistance, endocrine-resistance, and recurrence has resulted in a top ranking in overall mortality for this disease, which still needs to be fully investigated. Therefore, identifying specific key molecular pathways and highly sensitive, reliable biomarkers is urgently needed [48–53]. In recent times, the rapid growth of microarray and high-throughput sequencing data has provided convenient and comprehensive online platforms to elucidate the pathogenesis of tumors, which has allowed us to properly monitor tumor progression and prognoses [22–26].
Based on the results of this study, it suggested that most of the PSMD family are generally dysregulated in hundreds of distinctive types of cancers. On the other hand, expression profiles indicated that this family's genes not only accompany tumor multi-stage progression but are also involved in other tumor-related issues. For instance, upregulation of the PSMD1 gene was mainly enriched alongside a rise in tamoxifen resistance displayed by BRCA cells [55]. The autophagic degradation of 19S proteasomal subunits of both PSMD1 and PSMD2 were mediated by ATG16 [56]. PSMD3 is believed to be involved in stabilizing HER2, a growth-promoting protein on the exterior of all breast cells, from degradation [57]. Upregulation of the PSMD4 gene by hypoxic conditions in prostate cancer cells suggests a novel therapy for treatment [58]. PSMD7 was significantly linked to earlier stimulation of prostate cancer [59]. PSMD10 overexpression was supposed to substantially contribute to the onset of tumors as observed in various cancer types [60]. PSMD11 is a novel biomarker of pancreatic cancer progression [61]. High levels of PSMD12 enhanced both the proliferation and invasion of BRCA and gliomas, one of the fastest-growing and most aggressive brain neoplasms, by upregulating nuclear factor erythroid 2-related factor 2 (Nrf2) [62]. In the case of proteasomal degradation, consistently high levels of PSMD14, which regulates the de-ubiquitination substrate, may lead to a worse prognosis of lung adenocarcinomas [63]. The recent literature indicated that PSMDs play important roles in various cancers, and may represent possible biomarkers for predicting clinical out-comes and precise diagnoses, which provides promising molecular targets for the research and development of drugs and targeted therapies.
Despite extensive efforts having been made to properly understand the roles of each PSMD family member in various clinical diseases and cancer development, there is still limited evidence regarding relationships between all PSMD family genes and BRCA. We therefore conducted this study using available public databases to analyze possible biological regulation of PSMD family genes along with the occurrence and the development of BRCA. The data revealed that higher mRNA and protein levels of PSMD1, PSMD2, PSMD3, PSMD7, PSMD10, PSMD12, and PSMD14 lead to worse prognoses in terms of both DMFS and RFS. Therefore, we chose these PSMD family genes for further bioinformatics analyses. Moreover, the coexpression and pathway analysis also revealed the involvement of these family genes together with cell metabolism, immune responses, cyclin-dependent kinases (CDKs), and other cell-cycle pathways and signaling networks. The current study was consistent with the previous literature; these results credibly suggest that some specific genes of the PSMD family act as oncogenes, whose differential expressions may serve as potential molecular biomarkers in terms of diagnosis, classification, and prognosis for developing BRCA treatments.
Based on our knowledge, this is the first ever report on PSMD family genes expression in relation to patient survival prediction in BRCA. Most of all, since various types of high-throughput databases were integrated and some underlying biological mechanism were revealed that PSMD genes show prognostic and predictive value in BRCA, hence they may possibly serve as novel biomarkers in malignancy screening and/or potential prognosticators in assessing BRCA severity and prognosis.
Materials and Methods
Oncomine and UALCAN analysis
Oncomine, available at (https://www.oncomine.org), is generally recognized as a bioinformatics analytical tool for gene expression microarrays among PSMD family members [64]. Differences in expression between normal tissues and 20 types of cancer counterparts were comprehensively evaluated, under conditions that thresholds of three parameters were adjusted to a multiple of change >2; p<0.0001; and gene ranked in the top 10%; with data type as “all”. Numbers of significant unique analyses that met the selection criteria in BRCA are presented as digits, while overexpressed and under-expressed genes are displayed in red and blue gradients, respectively, in descending order of the gene rank percentile. In the subsequent stage, the ggpubr package in R environment was run to obtain plots of BRCA subtypes as we previously described [65–68].
Transcriptomic expressions of PSMD family members were analyzed in BRCA sample using the UALCAN (http://ualcan.path.uab.edu/) platform. UALCAN collected TCGA level 3 RNA-Seq and clinical data from different cancer types. With genes of interest, UALCAN allows users to perform biomarkers identification to verify gene expressions with multiple clinical factors. A boxplot was drawn of PSMD mRNA expression levels measured in BRCA specimens (red) compared to their normal counterparts (blue) obtained from the UALCAN database. Statistical analysis was performed using Student’s t-test, and p<0.05 was considered statistically significant [69].
Evaluation of differential PSMD expressions in cancer cell lines by a cancer cell line encyclopedia (CCLE) analysis
To further search for individual expression levels of PSMD family genes on a larger scale, the CCLE project (available at https://portals.broadinstitute.org/ccle) was launched [70]. 1000 This web-based tool offers public access to both genetic and pharmacologic characterizations of numerous human cancer models, including over human cancer cell lines and over 130,000 unique datasets. Moreover, the integrated RNA-Seq Aligned Reads tool was applied to 60 independent BRCA cell lines prior to plotting expressions of PSMD family members one at a time [71–73].
Kaplan-Meier (KM) overall survival analysis
The KM database (https://kmplot.com/), an integrated online database well-known for assessing target genes of survivors among 21 cancer types, was subsequently leveraged to further expand some prognosis-related issues. By concurrently integrating mRNA expression levels and clinical data obtained from target genes, the independent prognostic values of PSMD target genes on patients diagnosed with BRCA, including both distant metastasis-free survival (DMFS) and relapse-free survival (RFS), were represented as KM survival plots of two distinct groups of patients. Comparisons of the two patient cohorts were performed with 95% confidence intervals of hazard ratios (HRs) and fixed log-rank p values [74].
Analysis of protein expressions in clinical human specimens
The Human Protein Atlas (HPA, https://www.proteinatlas.org) provides a wealth of information on sequences, pathology, expressions, and distributions in various cancer tissues. The first version of this database contained more than 400,000 high-resolution images corresponding to more than 700 antibodies to human proteins [75]. This study analyzed the differential status of protein expressions and the localization of select PSMD family protein expression in breast tissue.
Functional enrichment analysis of PSMD target genes
To visualize genomics datasets on a large scale, particularly TCGA and METABRIC databases (available at the cBioPortal platform), the InteractiVenn tool (http://www.interactivenn.net/) was chosen to draw a one-way Venn diagram which illustrates the overlap and numbers of genes associated with expressions of PSMD target genes across the two given datasets [76]. The intersection between the two sets was subsequently analyzed for related pathways and involved networks using the online MetaCore platform (https://portal.genego.com/), with p-value of <0.05, as we previously described [77–82].
Tumor immune estimation resource (TIMER) database analysis
TIMER vers. 2.0 (available at http://timer.comp-genomics.org/) is generally known as a trustworthy resource for systematic analysis of host immune infiltrates across multiple cancer types and related diseases. In other words, this webserver can help estimate abundances of six given immune cell types which belong to two separate groups: the lymphoid lineage (B cells, cluster of differentiation 4-positivie (CD4+) T cells, and cluster of differentiation 8-positivie (CD8+) T cells) and myeloid lineage (neutrophils, macrophages, and dendritic cells) in the tumor microenvironment, under the DiffExp module with default parameters. Finally, correlations were illustrated as a scatterplot, while PSMD gene expression levels were represented on the x-axis and related tumor-infiltrating immune cell markers were represented on the y-axis [83, 84].
Author Contributions
Conceptualization, D.T.M.X. and C.C.W.; methodology, D.T.M.X.; software, T.J. K. and M.A.; validation, T.J. K.; formal analysis, H.D.K.T and G.A.; investigation, J.Y.C. and C.C.W.; resources, C.C.C. and V.A.; data curation, Y.F.W. and K.H.L.; writing—original draft preparation, D.T.M.X. and C.C.W.; writing—review and editing, C.Y.W. and J.Y.C.; visualization, H.D.K.T and G.A.; supervision, C.Y.W. and J.Y.C.; project administration, C.Y.W. and J.Y.C.; funding acquisition, J.Y.C. and C.C.W. All authors have read and agreed to the published version of the manuscript.
Acknowledgments
The authors truly appreciate Mr. Daniel P. Chamberlin from the Office of Research and Development at Taipei Medical University for professional English editing. The authors acknowledge the statistical/computational/technical support of the Clinical Data Center, Office of Data Science, Taipei Medical University, Taiwan.
Conflicts of Interest
The authors declare that they have no conflicts of interest.
Funding
This study was supported by a grant from Taipei Medical University Hospital (108TMU-TMUH-07 to C.C.W. and J.Y.C.) and by a grant from the Ministry of Science and Technology (MOST) of Taiwan (MOST 110-2636-B-038-004 to J.Y.C., MOST109-2320-B-038-009-MY2 to C.Y.W., and MOST 110-2320-B-038-017-MY3 to T.J.K.), and from the Ministry of Health and Welfare Surcharge of Education Tobacco Products of Taiwan (Wan-Fang Hospital, Chi-Mei Medical Center, and Hualien Tzu-Chi Hospital Joint Cancer Center Grant—Focus on Colon Cancer Research; DP2-109-21121-03-C-03-03 and MOHW110-TDU-B-212-144020 awarded to K.H.L.), as well as the “TMU Research Center of Cancer Translational Medicine” from The Featured Areas Research Center Program within the framework of the Higher Education Sprout Project by the Ministry of Education (MOE) in Taiwan.
References
- 1. Sung H, Ferlay J, Siegel RL, Laversanne M, Soerjomataram I, Jemal A, Bray F. Global Cancer Statistics 2020: GLOBOCAN Estimates of Incidence and Mortality Worldwide for 36 Cancers in 185 Countries. CA Cancer J Clin. 2021; 71:209–49. https://doi.org/10.3322/caac.21660 [PubMed]
- 2. Ferlay J, Colombet M, Soerjomataram I, Parkin DM, Piñeros M, Znaor A, Bray F. Cancer statistics for the year 2020: An overview. Int J Cancer. 2021. [Epub ahead of print]. https://doi.org/10.1002/ijc.33588 [PubMed]
- 3. Xin L, Liu YH, Martin TA, Jiang WG. The Era of Multigene Panels Comes? The Clinical Utility of Oncotype DX and MammaPrint. World J Oncol. 2017; 8:34–40. https://doi.org/10.14740/wjon1019w [PubMed]
- 4. Li H, Zhu Y, Burnside ES, Drukker K, Hoadley KA, Fan C, Conzen SD, Whitman GJ, Sutton EJ, Net JM, Ganott M, Huang E, Morris EA, et al. MR Imaging Radiomics Signatures for Predicting the Risk of Breast Cancer Recurrence as Given by Research Versions of MammaPrint, Oncotype DX, and PAM50 Gene Assays. Radiology. 2016; 281:382–91. https://doi.org/10.1148/radiol.2016152110 [PubMed]
- 5. Korde LA, Somerfield MR, Carey LA, Crews JR, Denduluri N, Hwang ES, Khan SA, Loibl S, Morris EA, Perez A, Regan MM, Spears PA, Sudheendra PK, et al. Neoadjuvant Chemotherapy, Endocrine Therapy, and Targeted Therapy for Breast Cancer: ASCO Guideline. J Clin Oncol. 2021; 39:1485–505. https://doi.org/10.1200/JCO.20.03399 [PubMed]
- 6. Esteva FJ, Hubbard-Lucey VM, Tang J, Pusztai L. Immunotherapy and targeted therapy combinations in metastatic breast cancer. Lancet Oncol. 2019; 20:e175–86. https://doi.org/10.1016/S1470-2045(19)30026-9 [PubMed]
- 7. Burris HA
3rd . Overcoming acquired resistance to anticancer therapy: focus on the PI3K/AKT/mTOR pathway. Cancer Chemother Pharmacol. 2013; 71:829–42. https://doi.org/10.1007/s00280-012-2043-3 [PubMed] - 8. Lehmann BD, Bauer JA, Chen X, Sanders ME, Chakravarthy AB, Shyr Y, Pietenpol JA. Identification of human triple-negative breast cancer subtypes and preclinical models for selection of targeted therapies. J Clin Invest. 2011; 121:2750–67. https://doi.org/10.1172/JCI45014 [PubMed]
- 9. Burstein HJ, Demetri GD, Mueller E, Sarraf P, Spiegelman BM, Winer EP. Use of the peroxisome proliferator-activated receptor (PPAR) gamma ligand troglitazone as treatment for refractory breast cancer: a phase II study. Breast Cancer Res Treat. 2003; 79:391–97. https://doi.org/10.1023/a:1024038127156 [PubMed]
- 10. Cheung KL. Treatment Strategies and Survival Outcomes in Breast Cancer. Cancers (Basel). 2020; 12:735. https://doi.org/10.3390/cancers12030735 [PubMed]
- 11. Falzone L, Salomone S, Libra M. Evolution of Cancer Pharmacological Treatments at the Turn of the Third Millennium. Front Pharmacol. 2018; 9:1300. https://doi.org/10.3389/fphar.2018.01300 [PubMed]
- 12. Abrams SL, Akula SM, Meher AK, Steelman LS, Gizak A, Duda P, Rakus D, Martelli AM, Ratti S, Cocco L, Montalto G, Cervello M, Ruvolo P, et al. GSK-3β Can Regulate the Sensitivity of MIA-PaCa-2 Pancreatic and MCF-7 Breast Cancer Cells to Chemotherapeutic Drugs, Targeted Therapeutics and Nutraceuticals. Cells. 2021; 10:816. https://doi.org/10.3390/cells10040816 [PubMed]
- 13. Candido S, Tomasello BM, Lavoro A, Falzone L, Gattuso G, Libra M. Novel Insights into Epigenetic Regulation of IL6 Pathway: In Silico Perspective on Inflammation and Cancer Relationship. Int J Mol Sci. 2021; 22:10172. https://doi.org/10.3390/ijms221810172 [PubMed]
- 14. Vivarelli S, Salemi R, Candido S, Falzone L, Santagati M, Stefani S, Torino F, Banna GL, Tonini G, Libra M. Gut Microbiota and Cancer: From Pathogenesis to Therapy. Cancers (Basel). 2019; 11:38. https://doi.org/10.3390/cancers11010038 [PubMed]
- 15. Vivarelli S, Falzone L, Leonardi GC, Salmeri M, Libra M. Novel insights on gut microbiota manipulation and immune checkpoint inhibition in cancer (Review). Int J Oncol. 2021; 59:75. https://doi.org/10.3892/ijo.2021.5255 [PubMed]
- 16. Saleh R, Toor SM, Khalaf S, Elkord E. Breast Cancer Cells and PD-1/PD-L1 Blockade Upregulate the Expression of PD-1, CTLA-4, TIM-3 and LAG-3 Immune Checkpoints in CD4+ T Cells. Vaccines (Basel). 2019; 7:149. https://doi.org/10.3390/vaccines7040149 [PubMed]
- 17. Müller P, Kreuzaler M, Khan T, Thommen DS, Martin K, Glatz K, Savic S, Harbeck N, Nitz U, Gluz O, von Bergwelt-Baildon M, Kreipe H, Reddy S, et al. Trastuzumab emtansine (T-DM1) renders HER2+ breast cancer highly susceptible to CTLA-4/PD-1 blockade. Sci Transl Med. 2015; 7:315ra188. https://doi.org/10.1126/scitranslmed.aac4925 [PubMed]
- 18. Cyprian FS, Akhtar S, Gatalica Z, Vranic S. Targeted immunotherapy with a checkpoint inhibitor in combination with chemotherapy: A new clinical paradigm in the treatment of triple-negative breast cancer. Bosn J Basic Med Sci. 2019; 19:227–33. https://doi.org/10.17305/bjbms.2019.4204 [PubMed]
- 19. Christofi T, Baritaki S, Falzone L, Libra M, Zaravinos A. Current Perspectives in Cancer Immunotherapy. Cancers (Basel). 2019; 11:1472. https://doi.org/10.3390/cancers11101472 [PubMed]
- 20. Ge J, Zuo W, Chen Y, Shao Z, Yu K. The advance of adjuvant treatment for triple-negative breast cancer. Cancer Biol Med. 2021 [Epub ahead of print]. https://doi.org/10.20892/j.issn.2095-3941.2020.0752 [PubMed]
- 21. Chen YY, Ge JY, Ma D, Yu KD. Immune-Activated Regional Lymph Nodes Predict Favorable Survival in Early-Stage Triple-Negative Breast Cancer. Front Oncol. 2020; 10:570981. https://doi.org/10.3389/fonc.2020.570981 [PubMed]
- 22. Thorat MA, Balasubramanian R. Breast cancer prevention in high-risk women. Best Pract Res Clin Obstet Gynaecol. 2020; 65:18–31. https://doi.org/10.1016/j.bpobgyn.2019.11.006 [PubMed]
- 23. Lin CY, Lee CH, Chuang YH, Lee JY, Chiu YY, Wu Lee YH, Jong YJ, Hwang JK, Huang SH, Chen LC, Wu CH, Tu SH, Ho YS, Yang JM. Membrane protein-regulated networks across human cancers. Nat Commun. 2019; 10:3131. https://doi.org/10.1038/s41467-019-10920-8 [PubMed]
- 24. Tsai HT, Huang CS, Tu CC, Liu CY, Huang CJ, Ho YS, Tu SH, Tseng LM, Huang CC. Multi-gene signature of microcalcification and risk prediction among Taiwanese breast cancer. Sci Rep. 2020; 10:18276. https://doi.org/10.1038/s41598-020-74982-1 [PubMed]
- 25. Nguyen HD, Liao YC, Ho YS, Chen LC, Chang HW, Cheng TC, Liu D, Lee WR, Shen SC, Wu CH, Tu SH. The α9 Nicotinic Acetylcholine Receptor Mediates Nicotine-Induced PD-L1 Expression and Regulates Melanoma Cell Proliferation and Migration. Cancers (Basel). 2019; 11:1991. https://doi.org/10.3390/cancers11121991 [PubMed]
- 26. Lee KL, Kuo YC, Ho YS, Huang YH. Triple-Negative Breast Cancer: Current Understanding and Future Therapeutic Breakthrough Targeting Cancer Stemness. Cancers (Basel). 2019; 11:1334. https://doi.org/10.3390/cancers11091334 [PubMed]
- 27. Vivarelli S, Candido S, Caruso G, Falzone L, Libra M. Patient-Derived Tumor Organoids for Drug Repositioning in Cancer Care: A Promising Approach in the Era of Tailored Treatment. Cancers (Basel). 2020; 12:3636. https://doi.org/10.3390/cancers12123636 [PubMed]
- 28. Vivarelli S, Falzone L, Candido S, Bonavida B, Libra M. YY1 Silencing Induces 5-Fluorouracil-Resistance and BCL2L15 Downregulation in Colorectal Cancer Cells: Diagnostic and Prognostic Relevance. Int J Mol Sci. 2021; 22:8481. https://doi.org/10.3390/ijms22168481 [PubMed]
- 29. Kito Y, Matsumoto M, Hatano A, Takami T, Oshikawa K, Matsumoto A, Nakayama KI. Cell cycle-dependent localization of the proteasome to chromatin. Sci Rep. 2020; 10:5801. https://doi.org/10.1038/s41598-020-62697-2 [PubMed]
- 30. Grigoreva TA, Tribulovich VG, Garabadzhiu AV, Melino G, Barlev NA. The 26S proteasome is a multifaceted target for anti-cancer therapies. Oncotarget. 2015; 6:24733–49. https://doi.org/10.18632/oncotarget.4619 [PubMed]
- 31. Owyong M, Chou J, van den Bijgaart RJ, Kong N, Efe G, Maynard C, Talmi-Frank D, Solomonov I, Koopman C, Hadler-Olsen E, Headley M, Lin C, Wang CY, et al. MMP9 modulates the metastatic cascade and immune landscape for breast cancer anti-metastatic therapy. Life Sci Alliance. 2019; 2:e201800226. https://doi.org/10.26508/lsa.201800226 [PubMed]
- 32. Wang CY, Li CY, Hsu HP, Cho CY, Yen MC, Weng TY, Chen WC, Hung YH, Lee KT, Hung JH, Chen YL, Lai MD. PSMB5 plays a dual role in cancer development and immunosuppression. Am J Cancer Res. 2017; 7:2103–20. [PubMed]
- 33. Kao TJ, Wu CC, Phan NN, Liu YH, Ta HD, Anuraga G, Wu YF, Lee KH, Chuang JY, Wang CY. Prognoses and genomic analyses of proteasome 26S subunit, ATPase (PSMC) family genes in clinical breast cancer. Aging (Albany NY). 2021; 13:17970. https://doi.org/10.18632/aging.203345 [PubMed]
- 34. Bencomo-Alvarez AE, Rubio AJ, Olivas IM, Gonzalez MA, Ellwood R, Fiol CR, Eide CA, Lara JJ, Barreto-Vargas C, Jave-Suarez LF, Nteliopoulos G, Reid AG, Milojkovic D, et al. Proteasome 26S subunit, non-ATPases 1 (PSMD1) and 3 (PSMD3), play an oncogenic role in chronic myeloid leukemia by stabilizing nuclear factor-kappa B. Oncogene. 2021; 40:2697–710. https://doi.org/10.1038/s41388-021-01732-6 [PubMed]
- 35. Zhang Z, Li H, Zhao Y, Guo Q, Yu Y, Zhu S, Zhang S, Min L, Li P. Asporin promotes cell proliferation via interacting with PSMD2 in gastric cancer. Front Biosci (Landmark Ed). 2019; 24:1178–89. https://doi.org/10.2741/4774 [PubMed]
- 36. Ma AG, Yu LM, Zhao H, Qin CW, Tian XY, Wang Q. PSMD4 regulates the malignancy of esophageal cancer cells by suppressing endoplasmic reticulum stress. Kaohsiung J Med Sci. 2019; 35:591–97. https://doi.org/10.1002/kjm2.12093 [PubMed]
- 37. Levin A, Minis A, Lalazar G, Rodriguez J, Steller H. PSMD5 Inactivation Promotes 26S Proteasome Assembly during Colorectal Tumor Progression. Cancer Res. 2018; 78:3458–68. https://doi.org/10.1158/0008-5472.CAN-17-2296 [PubMed]
- 38. Zhou C, Li H, Han X, Pang H, Wu M, Tang Y, Luo X. Prognostic Value and Molecular Mechanisms of Proteasome 26S Subunit, Non-ATPase Family Genes for Pancreatic Ductal Adenocarcinoma Patients after Pancreaticoduodenectomy. J Invest Surg. 2021. [Epub ahead of print]. https://doi.org/10.1080/08941939.2020.1863527 [PubMed]
- 39. Rhodes DR, Kalyana-Sundaram S, Mahavisno V, Varambally R, Yu J, Briggs BB, Barrette TR, Anstet MJ, Kincead-Beal C, Kulkarni P, Varambally S, Ghosh D, Chinnaiyan AM. Oncomine 3.0: genes, pathways, and networks in a collection of 18,000 cancer gene expression profiles. Neoplasia. 2007; 9:166–80. https://doi.org/10.1593/neo.07112 [PubMed]
- 40. Huang TC, Lee PT, Wu MH, Huang CC, Ko CY, Lee YC, Lin DY, Cheng YW, Lee KH. Distinct roles and differential expression levels of Wnt5a mRNA isoforms in colorectal cancer cells. PLoS One. 2017; 12:e0181034. https://doi.org/10.1371/journal.pone.0181034 [PubMed]
- 41. Cheng LC, Chao YJ, Overman MJ, Wang CY, Phan NN, Chen YL, Wang TW, Hsu HP, Shan YS, Lai MD. Increased expression of secreted frizzled related protein 1 (SFRP1) predicts ampullary adenocarcinoma recurrence. Sci Rep. 2020; 10:13255. https://doi.org/10.1038/s41598-020-69899-8 [PubMed]
- 42. Hoheisel JD. Microarray technology: beyond transcript profiling and genotype analysis. Nat Rev Genet. 2006; 7:200–10. https://doi.org/10.1038/nrg1809 [PubMed]
- 43. Anuraga G, Tang WC, Phan NN, Ta HD, Liu YH, Wu YF, Lee KH, Wang CY. Comprehensive Analysis of Prognostic and Genetic Signatures for General Transcription Factor III (GTF3) in Clinical Colorectal Cancer Patients Using Bioinformatics Approaches. Curr Issues Mol Biol. 2021; 43:2. https://doi.org/10.3390/cimb43010002 [PubMed]
- 44. Khoa Ta HD, Tang WC, Phan NN, Anuraga G, Hou SY, Chiao CC, Liu YH, Wu YF, Lee KH, Wang CY. Analysis of LAGEs Family Gene Signature and Prognostic Relevance in Breast Cancer. Diagnostics (Basel). 2021; 11:726. https://doi.org/10.3390/diagnostics11040726 [PubMed]
- 45. Wang CY, Chao YJ, Chen YL, Wang TW, Phan NN, Hsu HP, Shan YS, Lai MD. Upregulation of peroxisome proliferator-activated receptor-α and the lipid metabolism pathway promotes carcinogenesis of ampullary cancer. Int J Med Sci. 2021; 18:256–69. https://doi.org/10.7150/ijms.48123 [PubMed]
- 46. Wu PS, Yen JH, Wang CY, Chen PY, Hung JH, Wu MJ. 8-Hydroxydaidzein, an Isoflavone from Fermented Soybean, Induces Autophagy, Apoptosis, Differentiation, and Degradation of Oncoprotein BCR-ABL in K562 Cells. Biomedicines. 2020; 8:506. https://doi.org/10.3390/biomedicines8110506 [PubMed]
- 47. Cheng LC, Chao YJ, Wang CY, Phan NN, Chen YL, Wang TW, Hsu HP, Lin YJ, Shan YS, Lai MD. Cancer-Derived Transforming Growth Factor-β Modulates Tumor-Associated Macrophages in Ampullary Cancer. Onco Targets Ther. 2020; 13:7503–16. https://doi.org/10.2147/OTT.S246714 [PubMed]
- 48. Barrett T, Wilhite SE, Ledoux P, Evangelista C, Kim IF, Tomashevsky M, Marshall KA, Phillippy KH, Sherman PM, Holko M, Yefanov A, Lee H, Zhang N, et al. NCBI GEO: archive for functional genomics data sets--update. Nucleic Acids Res. 2013; 41:D991–95. https://doi.org/10.1093/nar/gks1193 [PubMed]
- 49. Lin JC, Liu TP, Yang PM. CDKN2A-Inactivated Pancreatic Ductal Adenocarcinoma Exhibits Therapeutic Sensitivity to Paclitaxel: A Bioinformatics Study. J Clin Med. 2020; 9:4019. https://doi.org/10.3390/jcm9124019 [PubMed]
- 50. Lin TY, Wang PW, Huang CH, Yang PM, Pan TL. Characterizing the Relapse Potential in Different Luminal Subtypes of Breast Cancers with Functional Proteomics. Int J Mol Sci. 2020; 21:6077. https://doi.org/10.3390/ijms21176077 [PubMed]
- 51. Liu LW, Hsieh YY, Yang PM. Bioinformatics Data Mining Repurposes the JAK2 (Janus Kinase 2) Inhibitor Fedratinib for Treating Pancreatic Ductal Adenocarcinoma by Reversing the KRAS (Kirsten Rat Sarcoma 2 Viral Oncogene Homolog)-Driven Gene Signature. J Pers Med. 2020; 10:130. https://doi.org/10.3390/jpm10030130 [PubMed]
- 52. Yang PM, Hsieh YY, Du JL, Yen SC, Hung CF. Sequential Interferon β-Cisplatin Treatment Enhances the Surface Exposure of Calreticulin in Cancer Cells via an Interferon Regulatory Factor 1-Dependent Manner. Biomolecules. 2020; 10:643. https://doi.org/10.3390/biom10040643 [PubMed]
- 53. Yang PM, Lin LS, Liu TP. Sorafenib Inhibits Ribonucleotide Reductase Regulatory Subunit M2 (RRM2) in Hepatocellular Carcinoma Cells. Biomolecules. 2020; 10:117. https://doi.org/10.3390/biom10010117 [PubMed]
- 54. Sabatier R, Finetti P, Cervera N, Lambaudie E, Esterni B, Mamessier E, Tallet A, Chabannon C, Extra JM, Jacquemier J, Viens P, Birnbaum D, Bertucci F. A gene expression signature identifies two prognostic subgroups of basal breast cancer. Breast Cancer Res Treat. 2011; 126:407–20. https://doi.org/10.1007/s10549-010-0897-9 [PubMed]
- 55. Okumura T, Ikeda K, Ujihira T, Okamoto K, Horie-Inoue K, Takeda S, Inoue S. Proteasome 26S subunit PSMD1 regulates breast cancer cell growth through p53 protein degradation. J Biochem. 2018; 163:19–29. https://doi.org/10.1093/jb/mvx053 [PubMed]
- 56. Xiong Q, Fischer S, Karow M, Müller R, Meßling S, Eichinger L. ATG16 mediates the autophagic degradation of the 19S proteasomal subunits PSMD1 and PSMD2. Eur J Cell Biol. 2018; 97:523–32. https://doi.org/10.1016/j.ejcb.2018.09.002 [PubMed]
- 57. Fararjeh AS, Chen LC, Ho YS, Cheng TC, Liu YR, Chang HL, Chang HW, Wu CH, Tu SH. Proteasome 26S Subunit, non-ATPase 3 (PSMD3) Regulates Breast Cancer by Stabilizing HER2 from Degradation. Cancers (Basel). 2019; 11:527. https://doi.org/10.3390/cancers11040527 [PubMed]
- 58. AydoĞan TÜrkoĞlu S, Dayi G, KÖÇkar F. Upregulation of PSMD4 gene by hypoxia in prostate cancer cells. Turk J Biol. 2020; 44:275–83. https://doi.org/10.3906/biy-2002-71 [PubMed]
- 59. Huang SP, Lin VC, Lee YC, Yu CC, Huang CY, Chang TY, Lee HZ, Juang SH, Lu TL, Bao BY. Genetic variants in nuclear factor-kappa B binding sites are associated with clinical outcomes in prostate cancer patients. Eur J Cancer. 2013; 49:3729–37. https://doi.org/10.1016/j.ejca.2013.07.012 [PubMed]
- 60. Fujita J, Sakurai T. The Oncoprotein Gankyrin/PSMD10 as a Target of Cancer Therapy. Adv Exp Med Biol. 2019; 1164:63–71. https://doi.org/10.1007/978-3-030-22254-3_5 [PubMed]
- 61. Sahni S, Krisp C, Molloy MP, Nahm C, Maloney S, Gillson J, Gill AJ, Samra J, Mittal A. PSMD11, PTPRM and PTPRB as novel biomarkers of pancreatic cancer progression. Biochim Biophys Acta Gen Subj. 2020; 1864:129682. https://doi.org/10.1016/j.bbagen.2020.129682 [PubMed]
- 62. Wang Z, Li Z, Xu H, Liao Y, Sun C, Chen Y, Sheng M, Lan Q, Wang Z. PSMD12 promotes glioma progression by upregulating the expression of Nrf2. Ann Transl Med. 2021; 9:700. https://doi.org/10.21037/atm-21-1481 [PubMed]
- 63. Zhang L, Xu H, Ma C, Zhang J, Zhao Y, Yang X, Wang S, Li D. Upregulation of deubiquitinase PSMD14 in lung adenocarcinoma (LUAD) and its prognostic significance. J Cancer. 2020; 11:2962–71. https://doi.org/10.7150/jca.39539 [PubMed]
- 64. Rhodes DR, Yu J, Shanker K, Deshpande N, Varambally R, Ghosh D, Barrette T, Pandey A, Chinnaiyan AM. ONCOMINE: a cancer microarray database and integrated data-mining platform. Neoplasia. 2004; 6:1–6. https://doi.org/10.1016/s1476-5586(04)80047-2 [PubMed]
- 65. Sun Z, Wang CY, Lawson DA, Kwek S, Velozo HG, Owyong M, Lai MD, Fong L, Wilson M, Su H, Werb Z, Cooke DL. Single-cell RNA sequencing reveals gene expression signatures of breast cancer-associated endothelial cells. Oncotarget. 2017; 9:10945–61. https://doi.org/10.18632/oncotarget.23760 [PubMed]
- 66. Cooke DL, McCoy DB, Halbach VV, Hetts SW, Amans MR, Dowd CF, Higashida RT, Lawson D, Nelson J, Wang CY, Kim H, Werb Z, McCulloch C, et al. Endovascular Biopsy: In Vivo Cerebral Aneurysm Endothelial Cell Sampling and Gene Expression Analysis. Transl Stroke Res. 2018; 9:20–33. https://doi.org/10.1007/s12975-017-0560-4 [PubMed]
- 67. Hung YH, Huang HL, Chen WC, Yen MC, Cho CY, Weng TY, Wang CY, Chen YL, Chen LT, Lai MD. Argininosuccinate lyase interacts with cyclin A2 in cytoplasm and modulates growth of liver tumor cells. Oncol Rep. 2017; 37:969–78. https://doi.org/10.3892/or.2016.5334 [PubMed]
- 68. Wu CC, Ekanem TI, Phan NN, Loan DT, Hou SY, Lee KH, Wang CY. Gene signatures and prognostic analyses of the Tob/BTG pituitary tumor-transforming gene (PTTG) family in clinical breast cancer patients. Int J Med Sci. 2020; 17:3112–24. https://doi.org/10.7150/ijms.49652 [PubMed]
- 69. Chandrashekar DS, Bashel B, Balasubramanya SA, Creighton CJ, Ponce-Rodriguez I, Chakravarthi BV, Varambally S. UALCAN: A Portal for Facilitating Tumor Subgroup Gene Expression and Survival Analyses. Neoplasia. 2017; 19:649–58. https://doi.org/10.1016/j.neo.2017.05.002 [PubMed]
- 70. Barretina J, Caponigro G, Stransky N, Venkatesan K, Margolin AA, Kim S, Wilson CJ, Lehár J, Kryukov GV, Sonkin D, Reddy A, Liu M, Murray L, et al. The Cancer Cell Line Encyclopedia enables predictive modelling of anticancer drug sensitivity. Nature. 2012; 483:603–07. https://doi.org/10.1038/nature11003 [PubMed]
- 71. Allaire J. RStudio. integrated development environment for R. Boston, MA. 2012; 770:394.
- 72. Hsu HP, Wang CY, Hsieh PY, Fang JH, Chen YL. Knockdown of serine/threonine-protein kinase 24 promotes tumorigenesis and myeloid-derived suppressor cell expansion in an orthotopic immunocompetent gastric cancer animal model. J Cancer. 2020; 11:213–28. https://doi.org/10.7150/jca.35821 [PubMed]
- 73. Wang CY, Chang YC, Kuo YL, Lee KT, Chen PS, Cheung CH, Chang CP, Phan NN, Shen MR, Hsu HP. Mutation of the PTCH1 gene predicts recurrence of breast cancer. Sci Rep. 2019; 9:16359. https://doi.org/10.1038/s41598-019-52617-4 [PubMed]
- 74. Györffy B, Lanczky A, Eklund AC, Denkert C, Budczies J, Li Q, Szallasi Z. An online survival analysis tool to rapidly assess the effect of 22,277 genes on breast cancer prognosis using microarray data of 1,809 patients. Breast Cancer Res Treat. 2010; 123:725–31. https://doi.org/10.1007/s10549-009-0674-9 [PubMed]
- 75. Uhlén M, Fagerberg L, Hallström BM, Lindskog C, Oksvold P, Mardinoglu A, Sivertsson Å, Kampf C, Sjöstedt E, Asplund A, Olsson I, Edlund K, Lundberg E, et al. Proteomics. Tissue-based map of the human proteome. Science. 2015; 347:1260419. https://doi.org/10.1126/science.1260419 [PubMed]
- 76. Cerami E, Gao J, Dogrusoz U, Gross BE, Sumer SO, Aksoy BA, Jacobsen A, Byrne CJ, Heuer ML, Larsson E, Antipin Y, Reva B, Goldberg AP, et al. The cBio cancer genomics portal: an open platform for exploring multidimensional cancer genomics data. Cancer Discov. 2012; 2:401–04. https://doi.org/10.1158/2159-8290.CD-12-0095 [PubMed]
- 77. Cho CY, Lee KT, Chen WC, Wang CY, Chang YS, Huang HL, Hsu HP, Yen MC, Lai MZ, Lai MD. MST3 promotes proliferation and tumorigenicity through the VAV2/Rac1 signal axis in breast cancer. Oncotarget. 2016; 7:14586–604. https://doi.org/10.18632/oncotarget.7542 [PubMed]
- 78. Huang HL, Chen WC, Hsu HP, Cho CY, Hung YH, Wang CY, Lai MD. Argininosuccinate lyase is a potential therapeutic target in breast cancer. Oncol Rep. 2015; 34:3131–39. https://doi.org/10.3892/or.2015.4280 [PubMed]
- 79. Phan NN, Wang CY, Lin YC. The novel regulations of MEF2A, CAMKK2, CALM3, and TNNI3 in ventricular hypertrophy induced by arsenic exposure in rats. Toxicology. 2014; 324:123–35. https://doi.org/10.1016/j.tox.2014.07.010 [PubMed]
- 80. Weng TY, Huang SS, Yen MC, Lin CC, Chen YL, Lin CM, Chen WC, Wang CY, Chang JY, Lai MD. A novel cancer therapeutic using thrombospondin 1 in dendritic cells. Mol Ther. 2014; 22:292–302. https://doi.org/10.1038/mt.2013.236 [PubMed]
- 81. Liu HL, Yeh IJ, Phan NN, Wu YH, Yen MC, Hung JH, Chiao CC, Chen CF, Sun Z, Jiang JZ, Hsu HP, Wang CY, Lai MD. Gene signatures of SARS-CoV/SARS-CoV-2-infected ferret lungs in short- and long-term models. Infect Genet Evol. 2020; 85:104438. https://doi.org/10.1016/j.meegid.2020.104438 [PubMed]
- 82. Chen PY, Chao TY, Hsu HJ, Wang CY, Lin CY, Gao WY, Wu MJ, Yen JH. The Lipid-Modulating Effect of Tangeretin on the Inhibition of Angiopoietin-like 3 (ANGPTL3) Gene Expression through Regulation of LXRα Activation in Hepatic Cells. Int J Mol Sci. 2021; 22:9853. https://doi.org/10.3390/ijms22189853 [PubMed]
- 83. Li T, Fan J, Wang B, Traugh N, Chen Q, Liu JS, Li B, Liu XS. TIMER: A Web Server for Comprehensive Analysis of Tumor-Infiltrating Immune Cells. Cancer Res. 2017; 77:e108–10. https://doi.org/10.1158/0008-5472.CAN-17-0307 [PubMed]
- 84. Galon J, Bruni D. Approaches to treat immune hot, altered and cold tumours with combination immunotherapies. Nat Rev Drug Discov. 2019; 18:197–218. https://doi.org/10.1038/s41573-018-0007-y [PubMed]