


Introduction
The major histological type of primary liver cancer (PLC) is hepatocellular carcinoma (HCC), which seriously threatens human health [1] and is the fifth most common malignant tumor covering 700, 000 newly diagnosed cases globally every year [2]. Though the development of surgery and various drug therapies has significantly increased the survival rate of patients with early HCC [3], the overall five-year survival rate of advanced HCC patients has not been exceeding 5% [4]. Moreover, as the pathogenesis of HCC is extremely complex with complicated interactions involving multiple genes at multiple steps [5], most cases of HCC are already at advanced stages at diagnosis due to rapid progression resulting from limited understanding of its mechanism. In addition to high rate of recurrence and metastasis, unsatisfactory efficacy of existing targeted drugs, and complexity of anti-HCC drug resistance [6], the lack of biomarkers that are specific for tumor types or disease stages represents a critical gap in the current understanding and treatment of HCC [7–9]. In particular, HCC is considered a virus-related malignancy in which hepatitis B and C viruses (HBV and HCV) are major etiological factors [10]; while nonalcoholic fatty liver disease (NAFLD) also becomes the fastest growing cause of HCC globally [11]. Both trends are rather important because the gene signature of HCC could be altered by the shifting of etiology mediated by either virus infection or fatty metabolism. Therefore, it is crucial to discover new diagnostic and therapeutic targets for profound HCC research and effective HCC treatment. Considering that researchers have gained valuable evidence from genetic studies [12], it may be possible to identify crucial biomarkers underpinning HCC pathogenesis or therapeutic targets for HCC treatment by screening gene networks for changes related to tumor formation and progression.
GDP dissociation inhibitor 2 (GDI2, Gene ID:2665), located in region from 5,765,223 to 5,842,132 of the reverse strand on Chromosome 10, is a family member of GDP dissociation inhibitors (GDIs) [13]. GDI2 is a ubiquitously expressed gene that encodes proteins to regulate the GDP-GTP exchange reaction of members from the Rab family, or small GTP-binding proteins from the Ras superfamily, and is involved in vesicular trafficking of molecules between cellular organelles. GDIs slow the rate of dissociation of GDP from rab proteins and release GDP from membrane-bound rabs [14].
As a regulator of GDP-GTP exchange reaction, GDI2 was reported to participate in various biological processes of solid tumors, such as breast cancer (BC) [15], pancreatic carcinoma (PC) [16], gastric cancer (GC) [17], and so on. However, the relationship between GDI2 and HCC has not been reported yet. The only report studied in hepatic carcinoma cells HepG2 was to demonstrate that the methanol extract of T. indica fruit pulp altered the release of GDI2 from HepG2 cells, which possibly correlated GDI2 gene to cellular lipid metabolism [18]. Hence, we performed advanced bioinfomatics analyses on the expression and clinical association of GDI2 gene in LIHC project from The Cancer Genome Atlas (TCGA) [19] in order to explore the role of GDI2 in HCC. Our results figured out that the GDI2 could be applied as a potential biomarker for diagnosis and prognosis for HCC patients, thus providing novel target and strategies for HCC treatment.
Results
Clinical characteristics
The clinical characteristics of 371 hepatocellular carcinoma (HCC) patients from TCGA were collected as shown in Table 1, including gender, race, TNM stage, pathologic stage, vascular invasion and tumor status, as well as HCC-specific index as adjacent hepatic tissue inflammation, fibrosis ishak score and Child-Pugh grade. In present study, a total of 121 female patients (54.2%) and 250 male (54.2%) patients were analyzed, including 184 white patients (49.6%) and 175 non-white patients (47.2%; 158 Asian patients and 17 Black or African American patients). The tumor status involved 201 tumor free (54.2%) cases and 151 cases with tumor (40.7%), while 109 with (19.4%) and 206 without (55.6%) vascular invasion. Stage I disease was found in 171 patients (46.1%), and Stage II, III, IV in 85 (22.9%), 85 (22.9%), and 5 (1.3%) patients, respectively. Most tumors were distributed among 48.8% T1 Stage (n=181), 25.3% T2 (n=94), 21.6% T3 (n=80), and 3.5% T4 (n=13). As not all the HCC patients could offer intact clinical data, the censoring values made the total number fail to sum up to 371 cases for each clinical count.
Table 1. Clinical characteristics of HCC patients.
| Characters | Level | Low expression of GDI2 | High expression of GDI2 | P value | |||||||||||||||||||||||||||||||||||||||||||||||||||||||||||||||||||||||||||||||||||||||||||||||
| Number | 186 | 185 | |||||||||||||||||||||||||||||||||||||||||||||||||||||||||||||||||||||||||||||||||||||||||||||||||
| T stage (%) | T1 | 100 (53.8%) | 81 (44.5%) | 0.163 | |||||||||||||||||||||||||||||||||||||||||||||||||||||||||||||||||||||||||||||||||||||||||||||||
| T2 | 47 (25.3%) | 47 (25.8%) | |||||||||||||||||||||||||||||||||||||||||||||||||||||||||||||||||||||||||||||||||||||||||||||||||
| T3 | 35 (18.8%) | 45 (24.7%) | |||||||||||||||||||||||||||||||||||||||||||||||||||||||||||||||||||||||||||||||||||||||||||||||||
| T4 | 4 (2.2%) | 9 (4.9%) | |||||||||||||||||||||||||||||||||||||||||||||||||||||||||||||||||||||||||||||||||||||||||||||||||
| N stage (%) | N0 | 117 (99.2%) | 135 (97.8%) | 0.627 | |||||||||||||||||||||||||||||||||||||||||||||||||||||||||||||||||||||||||||||||||||||||||||||||
| N1 | 1 (0.8%) | 3 (2.2%) | |||||||||||||||||||||||||||||||||||||||||||||||||||||||||||||||||||||||||||||||||||||||||||||||||
| M stage (%) | M0 | 129 (98.5%) | 137 (98.6%) | 1.000 | |||||||||||||||||||||||||||||||||||||||||||||||||||||||||||||||||||||||||||||||||||||||||||||||
| M1 | 2 (1.5%) | 2 (1.4%) | |||||||||||||||||||||||||||||||||||||||||||||||||||||||||||||||||||||||||||||||||||||||||||||||||
| Pathologic stage (%) | Stage I | 94 (53.4%) | 77 (45.0%) | 0.138 | |||||||||||||||||||||||||||||||||||||||||||||||||||||||||||||||||||||||||||||||||||||||||||||||
| Stage II | 45 (25.6%) | 41 (24.0%) | |||||||||||||||||||||||||||||||||||||||||||||||||||||||||||||||||||||||||||||||||||||||||||||||||
| Stage III | 34 (19.3%) | 51 (29.8%) | |||||||||||||||||||||||||||||||||||||||||||||||||||||||||||||||||||||||||||||||||||||||||||||||||
| Stage IV | 3 (1.7%) | 2 (1.2%) | |||||||||||||||||||||||||||||||||||||||||||||||||||||||||||||||||||||||||||||||||||||||||||||||||
| Residual tumor (%) | R0 | 169 (95.5%) | 155 (93.9%) | 0.458 | |||||||||||||||||||||||||||||||||||||||||||||||||||||||||||||||||||||||||||||||||||||||||||||||
| R1 | 7 (4.0%) | 10 (6.1%) | |||||||||||||||||||||||||||||||||||||||||||||||||||||||||||||||||||||||||||||||||||||||||||||||||
| R2 | 1 (0.6%) | 0 (0.0%) | |||||||||||||||||||||||||||||||||||||||||||||||||||||||||||||||||||||||||||||||||||||||||||||||||
| Histologic grade (%) | G1 | 30 (16.2%) | 25 (13.8%) | 0.214 | |||||||||||||||||||||||||||||||||||||||||||||||||||||||||||||||||||||||||||||||||||||||||||||||
| G2 | 97 (52.4%) | 80 (44.2%) | |||||||||||||||||||||||||||||||||||||||||||||||||||||||||||||||||||||||||||||||||||||||||||||||||
| G3 | 53 (28.6%) | 69 (38.1%) | |||||||||||||||||||||||||||||||||||||||||||||||||||||||||||||||||||||||||||||||||||||||||||||||||
| G4 | 5 (2.7%) | 7 (3.9%) | |||||||||||||||||||||||||||||||||||||||||||||||||||||||||||||||||||||||||||||||||||||||||||||||||
| Gender (%) | Female | 53 (28.5%) | 68 (36.8%) | 0.113 | |||||||||||||||||||||||||||||||||||||||||||||||||||||||||||||||||||||||||||||||||||||||||||||||
| Male | 133 (71.5%) | 117 (63.2%) | |||||||||||||||||||||||||||||||||||||||||||||||||||||||||||||||||||||||||||||||||||||||||||||||||
| Race (%) | Asian | 75 (42.1%) | 83 (45.9%) | 0.628 | |||||||||||||||||||||||||||||||||||||||||||||||||||||||||||||||||||||||||||||||||||||||||||||||
| Black or African American | 10 (5.6%) | 7 (3.9%) | |||||||||||||||||||||||||||||||||||||||||||||||||||||||||||||||||||||||||||||||||||||||||||||||||
| White | 93 (52.2%) | 91 (50.3%) | |||||||||||||||||||||||||||||||||||||||||||||||||||||||||||||||||||||||||||||||||||||||||||||||||
| Adjacent hepatic tissue inflammation (%) | Mild | 48 (38.4%) | 51 (46.8%) | 0.351 | |||||||||||||||||||||||||||||||||||||||||||||||||||||||||||||||||||||||||||||||||||||||||||||||
| None | 68 (54.4%) | 49 (45.0%) | |||||||||||||||||||||||||||||||||||||||||||||||||||||||||||||||||||||||||||||||||||||||||||||||||
| Severe | 9 (7.2%) | 9 (8.3%) | |||||||||||||||||||||||||||||||||||||||||||||||||||||||||||||||||||||||||||||||||||||||||||||||||
| Child-Pugh grade (%) | A | 117 (93.6%) | 100 (87.7%) | 0.108 | |||||||||||||||||||||||||||||||||||||||||||||||||||||||||||||||||||||||||||||||||||||||||||||||
| B | 7 (5.6%) | 14 (12.3%) | |||||||||||||||||||||||||||||||||||||||||||||||||||||||||||||||||||||||||||||||||||||||||||||||||
| C | 1 (0.8%) | 0 (0.0%) | |||||||||||||||||||||||||||||||||||||||||||||||||||||||||||||||||||||||||||||||||||||||||||||||||
| Fibrosis ishak score (%) | 0 | 44 (39.3%) | 30 (30.0%) | 0.242 | |||||||||||||||||||||||||||||||||||||||||||||||||||||||||||||||||||||||||||||||||||||||||||||||
| 1/2 | 13 (11.6%) | 18 (18.0%) | |||||||||||||||||||||||||||||||||||||||||||||||||||||||||||||||||||||||||||||||||||||||||||||||||
| 3/4 | 17 (15.2%) | 11 (11.0%) | |||||||||||||||||||||||||||||||||||||||||||||||||||||||||||||||||||||||||||||||||||||||||||||||||
| 5/6 | 38 (33.9%) | 41 (41.0%) | |||||||||||||||||||||||||||||||||||||||||||||||||||||||||||||||||||||||||||||||||||||||||||||||||
| Vascular invasion (%) | No | 107 (67.3%) | 99 (63.5%) | 0.551 | |||||||||||||||||||||||||||||||||||||||||||||||||||||||||||||||||||||||||||||||||||||||||||||||
| Yes | 52 (32.7%) | 57 (36.5%) | |||||||||||||||||||||||||||||||||||||||||||||||||||||||||||||||||||||||||||||||||||||||||||||||||
| Tumor status (%) | Tumor free | 107 (59.8%) | 94 (54.3%) | 0.356 | |||||||||||||||||||||||||||||||||||||||||||||||||||||||||||||||||||||||||||||||||||||||||||||||
| With tumor | 72 (40.2%) | 79 (45.7%) | |||||||||||||||||||||||||||||||||||||||||||||||||||||||||||||||||||||||||||||||||||||||||||||||||
| TP53 status (%) | Mut | 43 (24.3%) | 59 (32.6%) | 0.105 | |||||||||||||||||||||||||||||||||||||||||||||||||||||||||||||||||||||||||||||||||||||||||||||||
| WT | 134 (75.7%) | 122 (67.4%) | |||||||||||||||||||||||||||||||||||||||||||||||||||||||||||||||||||||||||||||||||||||||||||||||||
| Age (median [IQR]) | 62.50 [54.00, 69.00] | 59.00 [50.75, 68.00] | 0.073 | ||||||||||||||||||||||||||||||||||||||||||||||||||||||||||||||||||||||||||||||||||||||||||||||||
| Height (median [IQR]) | 168.00 [160.00, 174.00] | 168.00[163.00, 174.00] | 0.687 | ||||||||||||||||||||||||||||||||||||||||||||||||||||||||||||||||||||||||||||||||||||||||||||||||
| Weight (median [IQR]) | 72.00 [61.00, 87.50] | 68.00 [58.00, 79.00] | 0.035* | ||||||||||||||||||||||||||||||||||||||||||||||||||||||||||||||||||||||||||||||||||||||||||||||||
| BMI (median [IQR]) | 25.15 [22.23, 29.67] | 23.88 [21.21, 27.47] | 0.020* | ||||||||||||||||||||||||||||||||||||||||||||||||||||||||||||||||||||||||||||||||||||||||||||||||
| AFP(ng/ml) (median [IQR]) | 10.00 [3.00, 150.75] | 24.00 [5.00, 548.25] | 0.019* | ||||||||||||||||||||||||||||||||||||||||||||||||||||||||||||||||||||||||||||||||||||||||||||||||
| Albumin(g/dl) (median [IQR]) | 4.00 [3.50, 4.30] | 4.00 [3.50, 4.30] | 0.815 | ||||||||||||||||||||||||||||||||||||||||||||||||||||||||||||||||||||||||||||||||||||||||||||||||
| Prothrombin time (median [IQR]) | 1.10 [1.00, 9.75] | 1.10 [1.00, 5.25] | 0.173 | ||||||||||||||||||||||||||||||||||||||||||||||||||||||||||||||||||||||||||||||||||||||||||||||||
| *P < 0.05; **P < 0.01. | |||||||||||||||||||||||||||||||||||||||||||||||||||||||||||||||||||||||||||||||||||||||||||||||||||
Identification of differentially expressed genes (DEGs) in HCC
To elucidate whether GDI2 was positively correlated with HCC occurrence, the GDI2 expressions were compared between 371 HCC cases and 50 normal tissue cases via RNAseq TMP data from TCGA combined with GTEx, which showed much higher expression of GDI2 in tumor cases than in normal cases (P < 0.001, Figure 1A). Among them, 50 tumor-and-adjacent paired samples were also showed high expression of GDI2 in tumor compared with paired normal tissues (P < 0.001, Figure 1B). To further define the oncogenicity of GDI2, comparison of GDI2 expression between tumor and normal specimens was also made in pan-cancers from TCGA-GTEx database. It was shown that GDI2 significantly expressed in most of the 33 kinds of solid tumors, such as hepatocellular carcinoma (LIHC, HCC), lung adenocarcinoma (LUAD), cholangiocarcinoma (CHOL), breast cancer (BRCA), glioblastoma (GBM), endometrial carcinoma of uterus (UCEC), etc (Figure 1C). Then the differential expression of GDI2 was verified between two normal hepatic cell lines (L02, WRL-68) and seven hepatoma cell lines (Huh7, SK-HEP1, BEL-7402, PLC/PRF/5, SMMC-7721, HepG2, Hep3B) in vitro. Moreover, which transcript exerts effect in these HCC cell lines was also confirmed by designing different primers amplifying certain fragments for different transcripts of GDI2 gene. Both qRT-PCR and western blot assays confirmed that compared with normal hepatic cells L02, GDI2 expression was increased in most of hepatoma cells (Figure 1D, 1E). Although there are three transcripts GDI2 mRNA, Transcript I (NM_001115156.2) and Transcript II (NM_001494.4) are two confirmed mature transcripts, while Transcript III (XM_017016071.2) is a predictive transcript overlapped with Transcript I only with a latter Start Codon (Figure 1F). Correspondingly, PCR amplification displayed that almost both Transcript I and II of GDI2 gene contributed to GDI2 expression in HCC cell lines (Figure 1G). Finally, based on the cut-off criteria (|log2-fold change (FC)|>1, adjusted P-value<0.05) for median value of GDI2 expression, a total of 1225 Differentially Expressed Genes (DEGs) were identified after the analyses of TCGA RNA-seq data between GDI2-high and -low groups, including 654 upregulated and 571 downregulated DEGs illustrated by Volcano Map (Figure 1H), 10 of which were specifically displayed by Heat Map (Figure 1I).
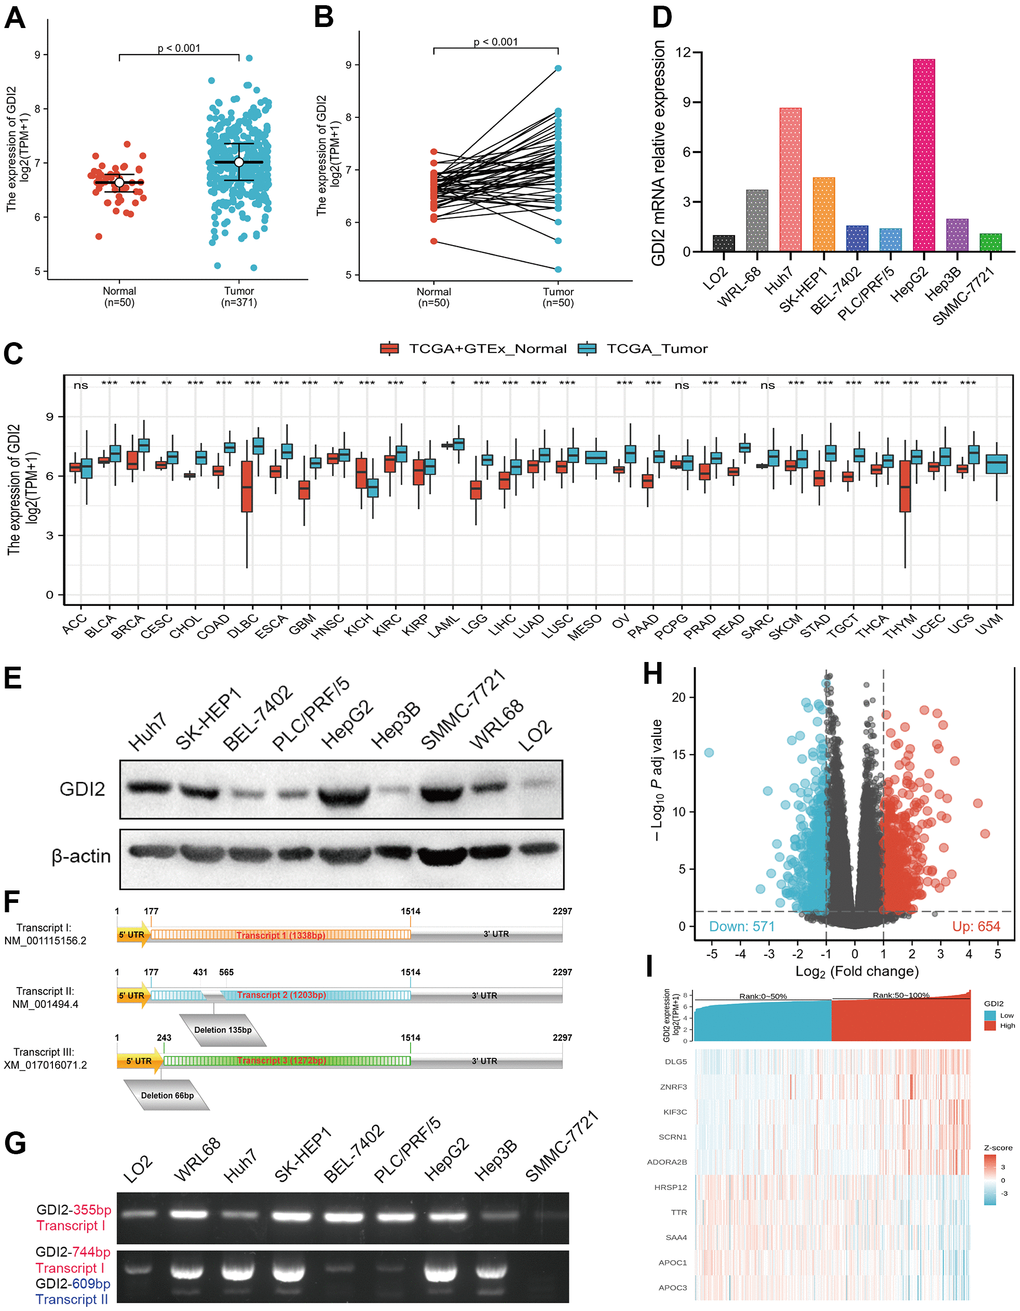
Figure 1. Differentially expressed genes (DEGs) involved in GDI2 expressing cancer groups. (A) Elevated expression of GDI2 between Normal and Tumor tissues of HCC patients. (B) Elevated expression of GDI2 in 50 paired Normal-and-Tumor tissues of HCC patients. (C) Box plot of the differentially expression of GDI2 gene among 33 kinds of pan-cancers. The X-axis represents the pan-cancer types, while the Y-axis denotes the expression of GDI2. (D) qRT-PCR assay confirmed the GDI2 mRNA expressions in two normal hepatic cells and seven hepatoma cells. (E) Western blot assay confirmed the protein levels of GDI2 in two normal hepatic cells and seven hepatoma cells. (F) Structural diagram of Transcript I, II and III of GDI2 gene. (G) Electrophoretogram for expressions of Transcript I, II and III of GDI2 gene based on different fragments of PCR primers in two normal hepatic cells and seven hepatoma cells. (H) Volcano plot of differential gene profiles between GDI2-high and -low groups. In 1225 DEGs, 654 upregulated and 571 downregulated genes were represented by red and blue tones, respectively. (I) Heat map of 10 significantly differentially expressed DEGs between GDI2-high and -low groups. Normalized expression levels are shown in descending order from red to blue. *P < 0.05, **P < 0.01, ***P < 0.001.
Functional enrichment analysis associated with GDI2 by GO, KEGG and GSEA
To better understand the functional implications of GDI2 in HCC, GO and KEGG functional enrichment analyses were performed based on 1225 DEGs between high- and low-GDI2 expression, which indicated that the GDI2-associated genes engaged in 342 GO terms of biological processes (BP), 62 terms of cellular components (CC) and 74 terms of molecular function (MF). Thereinto, massive enrichment of Receptor ligand activity (GO:0048018), Hormone activity (GO:0005179), Metal ion transmembrane transporter activity (GO:0046873) and Extracellular matrix structural constituent (GO:0005201) categorized by MF, Stress response to metal ion (GO:0097501), Extracellular structure organization (GO:0043062), Cell-cell adhesion via plasma-membrane adhesion molecules (GO:0098742) and Second-messenger-mediated signaling (GO:0019932) categorized by BP, Haptoglobin-hemoglobin complex (GO:0031838), Transmembrane transporter complex (GO:1902495), Protein-lipid complex (GO:0032994) and Collagen-containing extracellular matrix (GO:0062023) categorized by CC, were highly associated with the aberrant expression of GDI2 (**P < 0.01; Figure 2A).
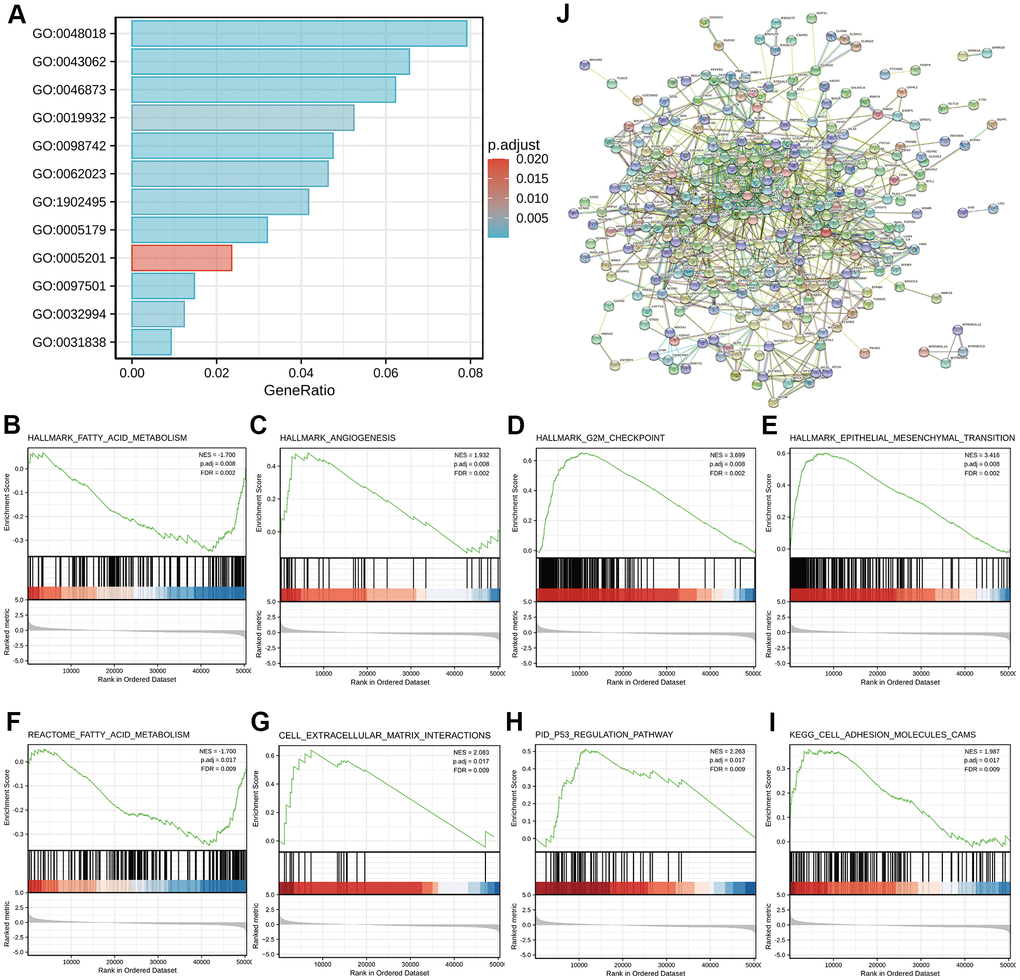
Figure 2. Functional enrichment analyses of DEGs between high- and low-GDI2 expression in TCGA-LIHC patients. (A) Twelve significant GO terms and KEGG pathway enrichment of DEGs between high- and low-GDI2 expression in TCGA-LIHC patients. (B–E) Enrichment plots of (B) Fatty acid metabolism, (C) Angiogenesis, (D) G2M checkpoint, (E) Epithelial mesenchymal transition pathways of Hallmarks symbols by GSEA analysis. *adj.P = 0.008, FDR = 0.002. (F–I) Enrichment plots of (F) Fatty acid metabolism by REACTOME, (G) Cell extracellular matrix interactions by REACTOME, (H) P53 regulation pathway by PID, (I) Cell adhesion molecules CAMS by KEGG of C2_curated symbols by GSEA analysis. adj. **adj.P = 0.017, FDR = 0.009. (J) Visualized protein-protein interaction enrichment of DEGs associated with GDI2 expression by STRING online database (Combined score > 0.7).
As for advanced analysis, gene set enrichment analysis (GSEA) was applied to confirm the key signaling pathways referring to GDI2 expression data sets. Significant differences with normalized enrichment score |NES| > 1.0, adjusted P-value < 0.05, false discovery rate (FDR) < 0.25 in enrichment of the MSigDB Collection h.all.v7.0.symbols [Hallmarks] and c2.cp.v7.0.symbols [curated] were observed in a total of 39 and 690 pathways, respectively. In particular, GDI2 was related to the Fatty acid metabolism, Angiogenesis, G2M checkpoint, Epithelial mesenchymal transition of Hallmarks symbols (adj.P = 0.008, FDR = 0.002; Figure 2B–2E), and similarly, to the Fatty acid metabolism by REACTOME, Cell extracellular matrix interactions by REACTOME, P53 regulation pathway by PID, Cell adhesion molecules CAMS by KEGG of C2_curated symbols (adj. P = 0.017, FDR = 0.009; Figure 2F–2I).
Furthermore, protein-protein interaction (PPI) enrichment analysis was performed to predict co-regulatory protein network of GDI2, and the functional interactions among proteins were illustrated by STRING online database. The interactions with a combined score > 0.7 were considered statistically significant, covering 620 protein network interactions. The resultant protein network illustrated by STRING encompassed the Red Node GDI2 with interactive proteins as multicolor Bubbles, and interaction Edge indicating both functional and physical protein associations (Figure 2J).
Immune infiltration analysis associated with GDI2
The enrichment analyses indicated that the occurrence of HCC was strongly associated with tumor microenvironment (TME) like extracellular matrix (ECM) organization. Therefore, the relative tumor infiltration levels of a list of 509 genes were quantified and the abundance of a diverse set of 24 tumor-infiltrating adaptive and innate immune cell types was predicted in individual tissue sample by single-sample gene set enrichment analysis (ssGSEA) analysis (Figure 3A). Then, Spearman correlation analysis between GDI2 expression and immune cell infiltration level displayed that the GDI2 expression was positively correlated with the abundance of T helper cells (R = 0.287; P < 0.001; Figure 3B), Th2 cells (R = 0.225; P < 0.001; Figure 3C) and Tcm cells (R = 0.271; P < 0.001; Figure 3D); while negatively correlated with Cytotoxic cells (R = -0.290; P < 0.001; Figure 3E), Dendritic cells (DCs) (R = 0.-280; P < 0.001; Figure 3F), Plasmacytoid Dendritic cells (pDCs) (R = -0.291; P < 0.001; Figure 3G), Th17 cells (R = -0.196; P < 0.001; Figure 3H), B cells (R = -0.106; P = 0.041; Figure 3I), and Neutrophils (R = -0.113; P = 0.030; Figure 3J). While other immune cell subsets, including T cells, Treg cells, NK cells, and macrophages were weakly correlated with GDI2 expression (Figure 3A).
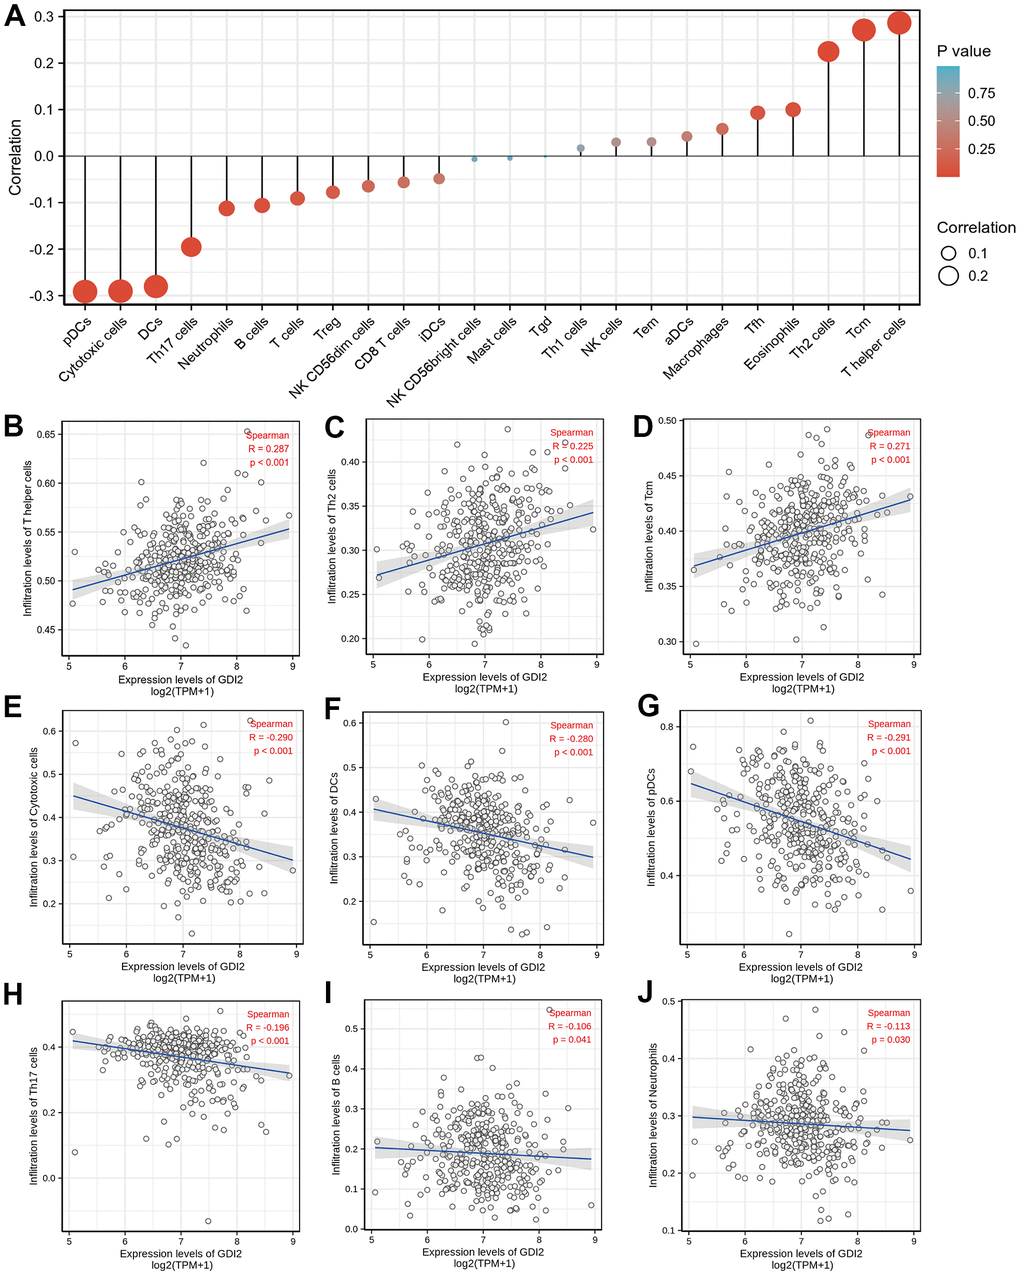
Figure 3. Immune infiltration analysis based on GDI2 expression by ssGSEA. (A) The GDI2 expression level was associated with the relative abundances of 24 immune cell subsets involved in immune infiltration in the tumor microenvironment. (B–J) Correlation between the relative enrichment score of immune cells and the expression level (TPM) of GDI2. The size of dots shows the absolute value of Spearman R. Positive correlations were found in (B) T helper cells; (C) Th2 cells; and (D) Tcm cells, Negative correlations were found in (E) Cytotoxic cells; (F) Dendritic cells (DCs); (G) Plasmacytoid Dendritic cells (pDCs); (H) Th17 cells; (I) B cells; and (J) Neutrophils. *P < 0.05; |R| < 0.40.
Association analyses of GDI2 expression with clinicopathologic variables
To explore the association between GDI2 expression with 11 kinds of clinicopathologic characteristics, GDI2 expression was firstly classified into high- and low-level, and Chi-square test was applied to explore the difference between high and low expression of GDI2 in different clinicopathological characteristics of HCC patients (Table 1). Here, there was significant differences between high and low expressions of GDI2 in HCC patients with clinical index as weight (P = 0.035), BMI (P = 0.020) and AFP (ng/ml) (P = 0.019). Then Logistics regression was applied to explore the clinical risky factors in HCC patients with GDI2 expression on both TPM values and high- and low-classifications (Table 2). It was displayed that high- and low-expression of GDI2 was only associated with histologic grade (OR=1.58(1.03-2.44); P = 0.035) (Table 2; upper); while consecutive TPM values of GDI2 expression were associated with patients under more progressive stage (OR= 1.01(1.00-1.01) for T1 vs. T2/T3/T4, P < 0.001), more advanced pathologic stage (OR=1.01(1.00-1.01) for Stage I vs. Stage II/III/IV, P = 0.001), more serious histologic grade (OR=1.01(1.00-1.01) for G1/G2 vs. G3/G4, P = 0.007), and mutated TP53 status (OR=1.01(1.00-1.01) for WT vs. MUT, P < 0.001) (Table 2; lower). Though the odds ratios were critical (only 1.01(1.00-1.01)), it was indicated that the associations between GDI2 and these four clinical factors were significant (*P < 0.05) but not strongly dependent. Finally, the Wilcoxon rank sum test was further applied and demonstrated that the GDI2 expression was significantly associated with clinicopathologic features as T stage (T1-2 vs. T3-4; P = 0.004), Pathologic stage (PI-II vs. PIII-IV; P = 0.001), Histologic grade (G1-2 vs. G3-4; P = 0.004), AFP (ng/ml) level (AFP<=400 vs. >400; P = 0.009), TP53 status (WT vs. Mut; P = 0.007) and tumor status (Tumor free vs. With tumor; P = 0.047) (Figure 4A–4F); and consistently associated with personal physical index as Age (age<=60 vs. >60; P = 0.040), Weight (weight<=70 vs. >70; P = 0.006) and BMI (BMI<=25 vs. >25; P = 0.002) (Figure 4G–4I). Those association analyses suggested that GDI2 expression was probably an independent risky factor for HCC patients, and significantly associated with clinicopathologic characteristics as T stage, pathologic stage, histologic grade and TP53 status.
Table 2. Association of clinicopathological characteristics with GDI2 expression.
| Characteristics with high- and low-GDI2 expression | Odds ratio (OR) | P value | |||||||||||||||||||||||||||||||||||||||||||||||||||||||||||||||||||||||||||||||||||||||||||||||||
| T stage (T2&T3&T4 vs. T1) | 1.45 (0.96-2.19) | 0.076 | |||||||||||||||||||||||||||||||||||||||||||||||||||||||||||||||||||||||||||||||||||||||||||||||||
| N stage (N1 vs. N0) | 2.60 (0.33-52.95) | 0.411 | |||||||||||||||||||||||||||||||||||||||||||||||||||||||||||||||||||||||||||||||||||||||||||||||||
| M stage (M1 vs. M0) | 0.94 (0.11-7.94) | 0.952 | |||||||||||||||||||||||||||||||||||||||||||||||||||||||||||||||||||||||||||||||||||||||||||||||||
| Pathologic stage (Stage II&Stage III&Stage IV vs. Stage I) | 1.40 (0.92-2.14) | 0.119 | |||||||||||||||||||||||||||||||||||||||||||||||||||||||||||||||||||||||||||||||||||||||||||||||||
| Histologic grade (G3&G4 vs. G1&G2) | 1.58 (1.03-2.44) | 0.035* | |||||||||||||||||||||||||||||||||||||||||||||||||||||||||||||||||||||||||||||||||||||||||||||||||
| Residual tumor (R1&R2 vs. R0) | 1.36 (0.52-3.65) | 0.525 | |||||||||||||||||||||||||||||||||||||||||||||||||||||||||||||||||||||||||||||||||||||||||||||||||
| Child-Pugh grade (B&C vs. A) | 2.05 (0.84-5.31) | 0.122 | |||||||||||||||||||||||||||||||||||||||||||||||||||||||||||||||||||||||||||||||||||||||||||||||||
| Fibrosis ishak score (1/2&3/4&5/6 vs. 0) | 1.51 (0.86-2.69) | 0.158 | |||||||||||||||||||||||||||||||||||||||||||||||||||||||||||||||||||||||||||||||||||||||||||||||||
| Adjacent hepatic tissue inflammation (Mild&Severe vs. None) | 1.46 (0.87-2.45) | 0.150 | |||||||||||||||||||||||||||||||||||||||||||||||||||||||||||||||||||||||||||||||||||||||||||||||||
| Vascular invasion (Yes vs. No) | 1.18 (0.74-1.89) | 0.475 | |||||||||||||||||||||||||||||||||||||||||||||||||||||||||||||||||||||||||||||||||||||||||||||||||
| Tumor status (With tumor vs. Tumor free) | 1.25 (0.82-1.91) | 0.303 | |||||||||||||||||||||||||||||||||||||||||||||||||||||||||||||||||||||||||||||||||||||||||||||||||
| TP53 status (Mut vs. WT) | 1.51 (0.95-2.40) | 0.083 | |||||||||||||||||||||||||||||||||||||||||||||||||||||||||||||||||||||||||||||||||||||||||||||||||
| Characteristics with GDI2 expression (TPM value) | Odds ratio (OR) | P value | |||||||||||||||||||||||||||||||||||||||||||||||||||||||||||||||||||||||||||||||||||||||||||||||||
| T stage (T2&T3&T4 vs. T1) | 1.01 (1.00-1.01) | <0.001** | |||||||||||||||||||||||||||||||||||||||||||||||||||||||||||||||||||||||||||||||||||||||||||||||||
| N stage (N1 vs. N0) | 1.01 (0.99-1.02) | 0.309 | |||||||||||||||||||||||||||||||||||||||||||||||||||||||||||||||||||||||||||||||||||||||||||||||||
| M stage (M1 vs. M0) | 1.00 (0.98-1.01) | 0.755 | |||||||||||||||||||||||||||||||||||||||||||||||||||||||||||||||||||||||||||||||||||||||||||||||||
| Pathologic stage (Stage II&Stage III&Stage IV vs. Stage I) | 1.01 (1.00-1.01) | 0.001** | |||||||||||||||||||||||||||||||||||||||||||||||||||||||||||||||||||||||||||||||||||||||||||||||||
| Histologic grade (G3&G4 vs. G1&G2) | 1.01 (1.00-1.01) | 0.007** | |||||||||||||||||||||||||||||||||||||||||||||||||||||||||||||||||||||||||||||||||||||||||||||||||
| Residual tumor (R1&R2 vs. R0) | 1.00 (1.00-1.01) | 0.236 | |||||||||||||||||||||||||||||||||||||||||||||||||||||||||||||||||||||||||||||||||||||||||||||||||
| Child-Pugh grade (B&C vs. A) | 1.01 (1.00-1.01) | 0.130 | |||||||||||||||||||||||||||||||||||||||||||||||||||||||||||||||||||||||||||||||||||||||||||||||||
| Fibrosis ishak score (1/2&3/4&5/6 vs. 0) | 1.00 (1.00-1.01) | 0.112 | |||||||||||||||||||||||||||||||||||||||||||||||||||||||||||||||||||||||||||||||||||||||||||||||||
| Adjacent hepatic tissue inflammation (Mild&Severe vs. None) | 1.01 (1.00-1.01) | 0.051 | |||||||||||||||||||||||||||||||||||||||||||||||||||||||||||||||||||||||||||||||||||||||||||||||||
| Vascular invasion (Yes vs. No) | 1.00 (1.00-1.01) | 0.094 | |||||||||||||||||||||||||||||||||||||||||||||||||||||||||||||||||||||||||||||||||||||||||||||||||
| Tumor status (With tumor vs. Tumor free) | 1.00 (1.00-1.01) | 0.065 | |||||||||||||||||||||||||||||||||||||||||||||||||||||||||||||||||||||||||||||||||||||||||||||||||
| TP53 status (Mut vs. WT) | 1.01 (1.00-1.01) | <0.001** | |||||||||||||||||||||||||||||||||||||||||||||||||||||||||||||||||||||||||||||||||||||||||||||||||
| *P < 0.05; **P < 0.01. | |||||||||||||||||||||||||||||||||||||||||||||||||||||||||||||||||||||||||||||||||||||||||||||||||||
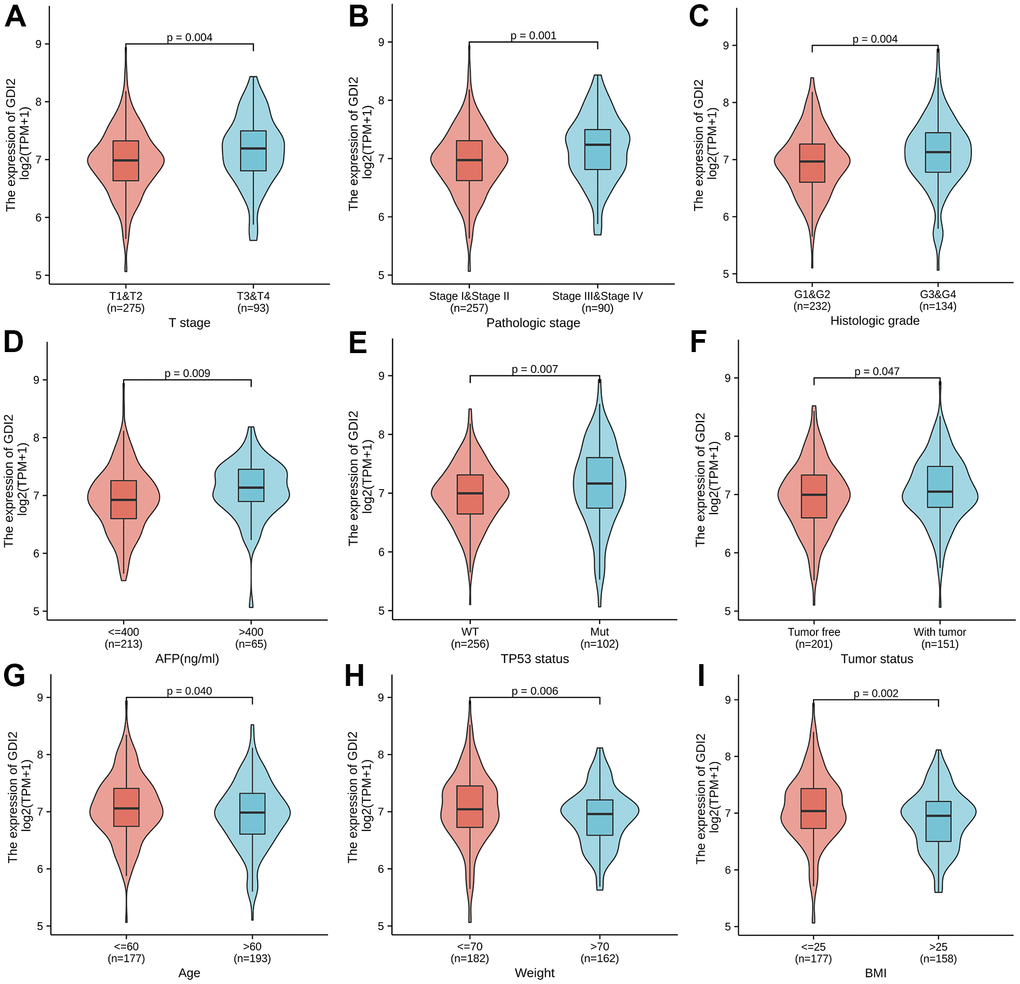
Figure 4. Association between GDI2 expression and clinical characteristics. (A–I) Violin images for clinicopathologic characteristics as (A) T stage; (B) Pathologic stage; (C) Histologic grade, (D) AFP(ng/ml); (E) TP53 status; and (F) tumor status, as well as Physical index as (G) Age; (H) Weight; (I) BMI, demonstrated significant association with GDI2 expression by Wilcoxon rank sum test. *P < 0.05,**P < 0.01.
Prognostic analysis and model construction for GDI2 expression in HCC patients
To explore the risky factors associated with patients’ prognosis, the Univariate Cox regression analysis was performed to figure out the hazard clinicopathologic indicators for HCC survival based on high- and low-GDI2 expression, from which the significant variables (P < 0.1) as T stage (P < 0.001, hazard ratio (95% confidence interval) [HR (95%CI)] = 2.109 (1.469-3.028)), M stage (P = 0.018, HR (95%CI) = 4.032 (1.267-12.831)), pathologic stage (P < 0.001, HR (95%CI) = 2.074 (1.418-3.032)), tumor status (P < 0.001, HR (95%CI) = 2.361 (1.620-3.441)), and GDI2 expression (P < 0.001, HR (95%CI) = 1.844 (1.298-2.620)), were put into the Multivariate Cox regression analysis for further investigation. The results confirmed that tumor status (P = 0.003, HR (95%CI) = 2.145 (1.300-3.539)) and GDI2 (P = 0.014, HR (95%CI) = 1.836 (1.130-2.983)) were independent prognostic factors for HCC patients’ survival (*P < 0.05) (Table 3).
Table 3. Prognostic correlation between GDI2 expression and clinical characteristics.
| Characteristics | Total (N) | HR (95% CI) univariate analysis | P value univariate analysis | HR (95% CI) multivariate analysis | P value multivariate analysis | ||||||||||||||||||||||||||||||||||||||||||||||||||||||||||||||||||||||||||||||||||||||||||||||
| T stage (T2&T3&T4 vs. T1) | 367 | 2.109 (1.469-3.028) | <0.001** | 0.857 (0.116-6.338) | 0.880 | ||||||||||||||||||||||||||||||||||||||||||||||||||||||||||||||||||||||||||||||||||||||||||||||
| N stage (N1 vs. N0) | 256 | 2.004 (0.491-8.181) | 0.333 | ||||||||||||||||||||||||||||||||||||||||||||||||||||||||||||||||||||||||||||||||||||||||||||||||
| M stage (M1 vs. M0) | 270 | 4.032 (1.267-12.831) | 0.018 | 1.774 (0.423-7.445) | 0.433 | ||||||||||||||||||||||||||||||||||||||||||||||||||||||||||||||||||||||||||||||||||||||||||||||
| Pathologic stage (Stage II&Stage III&Stage IV vs. Stage I) | 346 | 2.074 (1.418-3.032) | <0.001** | 2.652 (0.346-20.308) | 0.348 | ||||||||||||||||||||||||||||||||||||||||||||||||||||||||||||||||||||||||||||||||||||||||||||||
| Histologic grade (G3&G4 vs. G1&G2) | 365 | 1.120 (0.781-1.606) | 0.539 | ||||||||||||||||||||||||||||||||||||||||||||||||||||||||||||||||||||||||||||||||||||||||||||||||
| Residual tumor (R1&R2 vs. R0) | 341 | 1.571 (0.795-3.104) | 0.194 | ||||||||||||||||||||||||||||||||||||||||||||||||||||||||||||||||||||||||||||||||||||||||||||||||
| Age (>60 vs. <=60) | 370 | 1.248 (0.880-1.768) | 0.214 | ||||||||||||||||||||||||||||||||||||||||||||||||||||||||||||||||||||||||||||||||||||||||||||||||
| Gender (Male vs. Female) | 370 | 0.816 (0.573-1.163) | 0.260 | ||||||||||||||||||||||||||||||||||||||||||||||||||||||||||||||||||||||||||||||||||||||||||||||||
| Weight (>70 vs. <=70) | 343 | 0.916 (0.640-1.312) | 0.634 | ||||||||||||||||||||||||||||||||||||||||||||||||||||||||||||||||||||||||||||||||||||||||||||||||
| Height (>=170 vs. < 170) | 338 | 1.208 (0.833-1.753) | 0.319 | ||||||||||||||||||||||||||||||||||||||||||||||||||||||||||||||||||||||||||||||||||||||||||||||||
| BMI (>25 vs. <=25) | 334 | 0.818 (0.563-1.186) | 0.289 | ||||||||||||||||||||||||||||||||||||||||||||||||||||||||||||||||||||||||||||||||||||||||||||||||
| Race (White vs. Asian&Black or African American) | 358 | 1.245 (0.867-1.789) | 0.235 | ||||||||||||||||||||||||||||||||||||||||||||||||||||||||||||||||||||||||||||||||||||||||||||||||
| Child-Pugh grade (B&C vs. A) | 238 | 1.616 (0.797-3.275) | 0.183 | ||||||||||||||||||||||||||||||||||||||||||||||||||||||||||||||||||||||||||||||||||||||||||||||||
| AFP(ng/ml) (>400 vs. <=400) | 277 | 1.056 (0.646-1.727) | 0.827 | ||||||||||||||||||||||||||||||||||||||||||||||||||||||||||||||||||||||||||||||||||||||||||||||||
| Albumin(g/dl) (>=3.5 vs. <3.5) | 296 | 0.921 (0.565-1.503) | 0.743 | ||||||||||||||||||||||||||||||||||||||||||||||||||||||||||||||||||||||||||||||||||||||||||||||||
| Prothrombin time (>4 vs. <=4) | 293 | 1.330 (0.877-2.015) | 0.179 | ||||||||||||||||||||||||||||||||||||||||||||||||||||||||||||||||||||||||||||||||||||||||||||||||
| Fibrosis ishak score (1/2&3/4&5/6 vs. 0) | 211 | 0.779 (0.470-1.293) | 0.334 | ||||||||||||||||||||||||||||||||||||||||||||||||||||||||||||||||||||||||||||||||||||||||||||||||
| Adjacent hepatic tissue inflammation (Mild&Severe vs. None) | 233 | 1.228 (0.755-1.997) | 0.409 | ||||||||||||||||||||||||||||||||||||||||||||||||||||||||||||||||||||||||||||||||||||||||||||||||
| Vascular invasion (Yes vs. No) | 314 | 1.348 (0.890-2.042) | 0.159 | ||||||||||||||||||||||||||||||||||||||||||||||||||||||||||||||||||||||||||||||||||||||||||||||||
| Tumor status (With tumor vs. Tumor free) | 351 | 2.361 (1.620-3.441) | <0.001** | 2.145 (1.300-3.539) | 0.003** | ||||||||||||||||||||||||||||||||||||||||||||||||||||||||||||||||||||||||||||||||||||||||||||||
| TP53 status (Mut vs. WT) | 357 | 1.434 (0.972-2.115) | 0.069 | 1.602 (0.961-2.671) | 0.071 | ||||||||||||||||||||||||||||||||||||||||||||||||||||||||||||||||||||||||||||||||||||||||||||||
| GDI2 (High vs. Low) | 370 | 1.844 (1.298-2.620) | <0.001** | 1.836 (1.130-2.983) | 0.014* | ||||||||||||||||||||||||||||||||||||||||||||||||||||||||||||||||||||||||||||||||||||||||||||||
| *P < 0.05; **P < 0.01. | |||||||||||||||||||||||||||||||||||||||||||||||||||||||||||||||||||||||||||||||||||||||||||||||||||
To validate whether the model construction was effective, receiver operating characteristic (ROC) curve was displayed to measure the discrimination value of GDI2. The calculated area under curve (AUC) of GDI2 was 0.748, indicating that GDI2 owned an efficient ability to discriminate hepatic carcinoma from normal liver and might be a potential diagnostic biomarker (Figure 5A). Then to provide clinicians with a quantitative approach to predicting the prognosis of HCC patients, a nomogram integrating GDI2 and tumor status was constructed based on multivariate Cox analysis. We compared the predictive accuracy of this nomogram with that of GDI2 and tumor status, obtaining the nomogram performance (C-index: 0.599 (0.573-0.626)) between predicted values 0.5 and 1.0. In addition, HCC patients with tumor (100 points) and high GDI2 level (77 points) could receive a total point score of 177 in this nomogram. Then the probabilities of 1-, 3-, 5-year survival were determined by drawing a vertical line from the total point axis at a value of 177 straight downward to the outcome axis, respectively (Figure 5B).
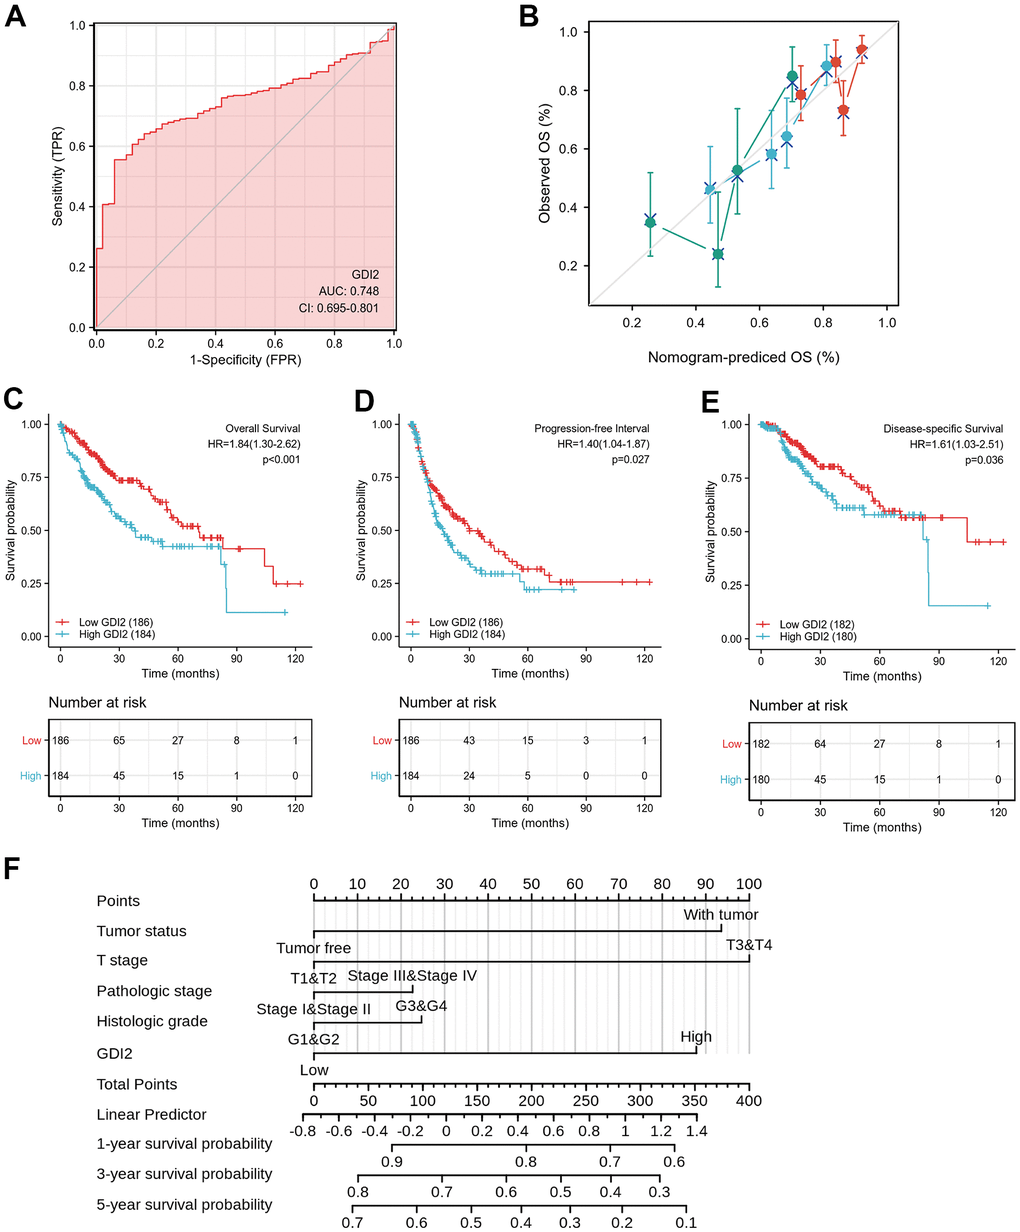
Figure 5. Effective nomogram model for prognostic evaluation of GDI2. (A) ROC analysis of GDI2 showing a high ability to discriminate controls from liver samples validated in TCGA. The X-axis represents False Positive Rate (FPR), while the Y-axis denotes True Positive Rate (TPR). AUC is plotted as sensitivity% vs 100-specifificity%. (B) Nomogram to predict survival probability at 1, 2, and 3 years of OS for HCC patients. (C–E) High GDI2 expression was associated with poor outcomes on (C) overall survival (OS), (D) progression-free interval (PFI), and (E) disease-specific survival (DSS) in HCC patients of a TCGA cohort. Blue: high GDI2 (n=184); Red: low GDI2 (n=186). *P < 0.05; **P < 0.01. (F) Calibration curve with Hosmer-Lemeshow test of the nomogram-predicted OS (%) in the TCGA-LIHC cohort relating to GDI2 expression and tumor status, as well as T Stage, Pathologic Stage and Histologic Grade. The X-axis represents Prognostic Probability (0-100%), while the Y-axis denotes Observed OS (0-100%). Gray line: ideal line.
Next, the Kaplan-Meier survival analysis was performed in 184 HCC patients with GDI2-high expression and 186 cases with GDI2-low expression to evaluate the relationship between GDI2 expression and survival status of HCC patients in TCGA cohort. It showed that high GDI2 expression was strongly associated with a worse overall survival (OS) (P < 0.001, HR (95%CI) = 1.84 (1.30-2.62); Figure 5C), a worse progression-free interval (PFI) (P=0.027, HR (95%CI) = 1.40 (1.04-1.87); Figure 5D), as well as a worse disease-specific survival (DSS) (P = 0.036, HR (95%CI) = 1.61 (1.03-2.51); Figure 5E) than that of low GDI2 expression. In survival prediction nomogram for OS, the calibration curve conformed well to observations in all patients, integrating GDI2 and tumor status index, as well as T stage, pathologic stage and histologic grade with a Hosmer-Lemeshow test, implied no departure from perfect fit (Figure 5F). These validations suggested that the models based on GDI2 expression were effective for predicting short-term or long-term survival in HCC patients.
As for the subtypes of clinicopathological features associated with prognosis, the K-M survival analysis for sub-population displayed that GDI2 expression significantly impacted the OS rate in HCC patients with certain clinical index as: Age>60 (HR=2.08(1.31-3.28); P = 0.002; Figure 6A), BMI>25 (HR=2.10(1.21-3.66); P = 0.009; Figure 6B), and AFP(ng/ml)<=400 (HR=2.01(1.21-3.35); P = 0.007; Figure 6C). Meanwhile, HCC patients with low GDI2 expression could improve their prognosis when they were with clinicopathological subtypes as: T1 Stage (N=49, P = 0.010; HR (95%CI) = 2.18 (1.21-3.94); Figure 6D), negative lymph nodes (N=252, P < 0.001; HR (95%CI) = 2.252 (1.427-3.555); Figure 6E), without metastasis (N=266, P = 0.004; HR (95%CI) = 1.919 (1.232-2.990); Figure 6F), with fibrosis ishak score-1/2&3/4&5/6 (HR=2.56(1.24-5.25); P=0.011; Figure 6G); early pathologic stage I&II (HR=1.66(1.03-2.68); P=0.037; Figure 6H), and no vascular invasion (HR=2.23(1.32-3.76); P=0.003; Figure 6I). Then significant subtypes with prognostic impact were together intuitively illustrated by Forest Map (Figure 6J). These results suggested that GDI2 could be applied as a prognostic indicator in early stage of HCC.
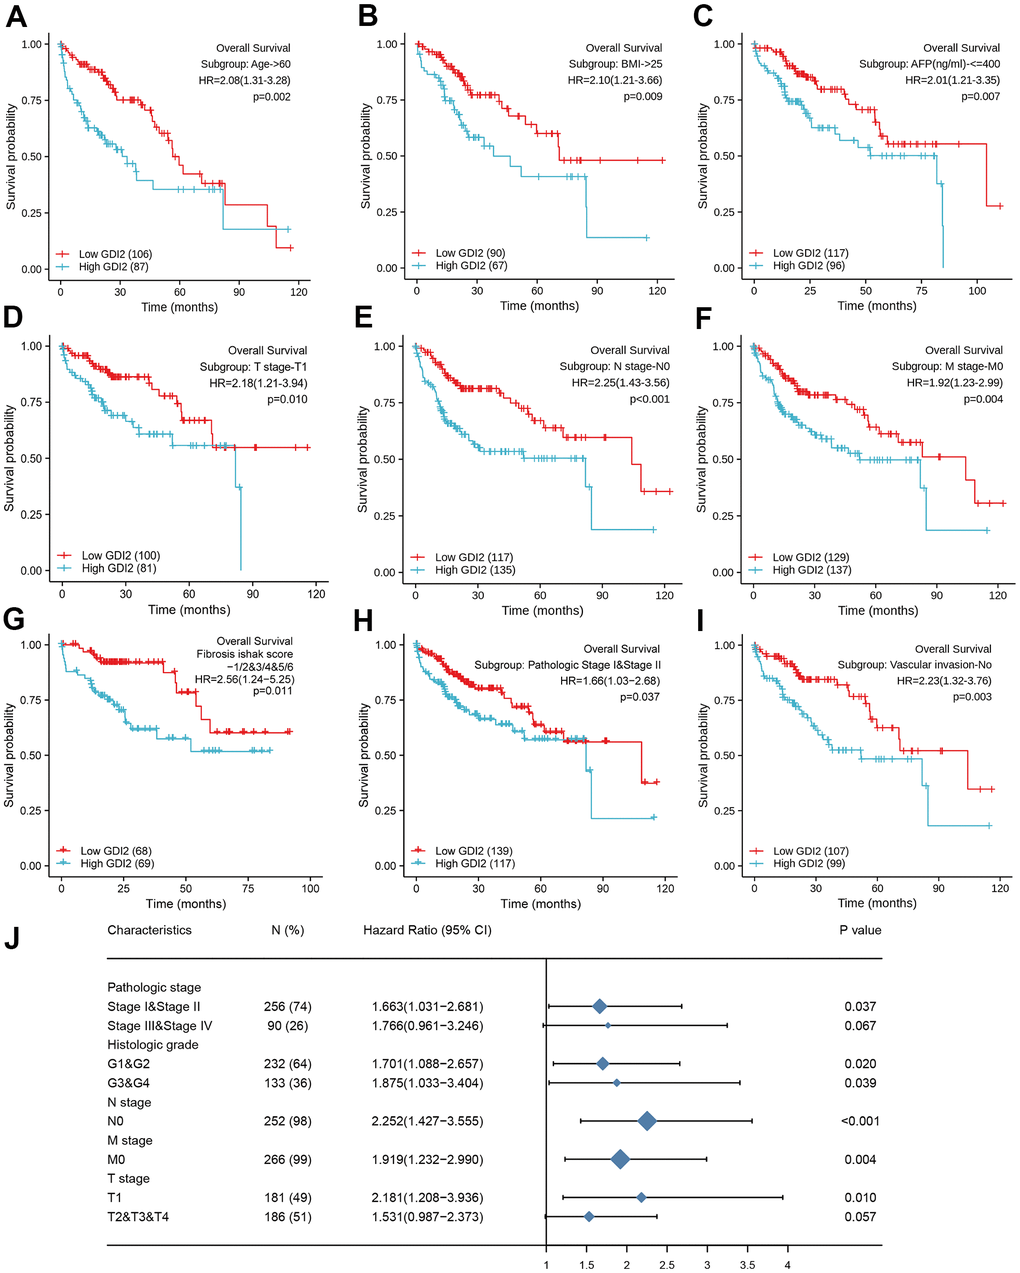
Figure 6. Prognostic impact of clinical subtypes associated with GDI2 expression in HCC patients. (A–I) High GDI2 expression was associated with poor outcomes on overall survival (OS) in HCC patients of a TCGA cohort with clinicopathological indicators as: (A) Age>60; (B) BMI>25; (C) AFP(ng/ml)<=400; (D) T1 Stage; (E) N0 Stage; (F) M0 Stage; (G) Fibrosis ishak score-1/2&3/4&5/6; (H) Pathologic Stage I&II; and (I) No Vascular invasion. Blue: high GDI2; Red: low GDI2. *P < 0.05,**P < 0.01. (J) Forest map illustrated subtypes of clinicopathological features associated with GDI2 expression for HCC prognosis. *P < 0.05,**P < 0.01.
Discussion
Based on the specific bioinformatics analyses on GDI2 based on The Cancer Genome Atlas (TCGA)-LIHC database, our results figured out that the GDI2 significantly over-expressed in tumor tissues of HCC patients compared with normal tissues (Figure 1), acting as a tumor booster in HCC progression. Especially, in terms of that GDI2 was positively correlated with the abundance of T helper cells, Tcm cells and Th2 cells, while negatively correlated with Cytotoxic cells and Dendritic cells (Figure 2), it could be speculated that the poor cytotoxic effect of immune cells might pave the way for tumor progression mediated by GDI2. As a result, high expression of GDI2 turned out to be correlated with advanced tumor status (Figure 4) and poor prognosis (Figure 5).
As regulators of GDP-GTP exchange reaction of members of the Rab family, small GTP-binding proteins of the Ras superfamily, GDIs involve in many energy-related biological processes. There are two isoforms of Rab-GDIs, GDI1 and GDI2 genes. Anyway, it was reported that mutations in GDI1 have been mainly linked to X-linked nonspecific cognitive disability [20], while more studies indicated that GDI2 has been correlated with the energy-required tumors, yet leaving HCC uninvolved up to now. To be specific, the latest study in prostate cancer (PC) found that GDI2 was a target of paclitaxel that affects tumorigenesis via p75NTR signaling pathway [21]. In human ovarian cancer (OC), paclitaxel-resistance [22] and tumor cell-induced fibroblasts were associated with GDI2 up-regulation in OC cells [23]. While in breast cancer (BC), GDI2 was found to contribute to EGFR endocytosis and thus enhance EGFR signaling and metastasis formation [15]. In human pancreatic adenocarcinoma (PAAD), GDI2 was over expressed [16] and co-localized with Hsp90, together with family member Rab-GDI-1, they regulated agonist-induced amylase release in AR42J cells [24]. Likewise, GDI2 was upregulated in anaplastic thyroid cancers (ATC) [25] and might be a genetic driver of metastatic dissemination in sonic hedgehog medulloblastoma [26]. Moreover, GDI2 was differentially expressed in the secretome of esophageal squamous cell carcinoma (ESCC) [27] as well as in gastric cancer (GC) [17]. Gratifyingly, our findings were generally consistent with the reported studies mentioned above and showed that the GDI2 gene was significantly over-expressed in most of the 33 types of cancers, such as lung adenocarcinoma (LUAD), Cholangiocarcinoma (CHOL), Breast Cancer (BRCA), Glioblastoma (GBM), endometrial carcinoma of uterus (UCEC), etc. In addition, our study explored for the first time that GDI2 significantly over-expresses in tumor tissues of HCC patients compared with normal tissues, making it reasonable that GDI2 could be considered as a tumor activator in future researches (Figure 1).
As for the GDI2-related pathways, the GO and KEGG, even GSEA enrichment analysis all indicated that GDI2-associated genes engaged in biological signaling mainly involving fatty acid metabolism and extracellular matrix (ECM) organization (Figure 2). This finding was generally consistent with Guzman-ruiz R’s study [28] that in obesity-associated insulin resistance (IR), GDI2 altered lipid storage in adipocytes via dysregulation of both adipose tissue extracellular matrix organization and intracellular trafficking processes. Elsewhere, it was reported that 126kDa-GDI2 interaction altered vesicle trafficking to enhance the establishment of a Tobacco mosaic virus (TMV) infection [29], which was accorded with transmembrane transporter enrichment. Considering that many HCC patients were originated from hepatitis B virus (HBV) infection, it could be assumed that GDI2 might regulate the HBV-antigen vesicles trafficking to hepatocytes, similarly. Furthermore, since that HCC was mainly progressed from hepatic fibrosis (HF) till liver cirrhosis (LC), the GDI2 might also participate in hepatic disease progression, similar to its role in multiple sclerosis (MS) [30]. Therefore, the GDI2-involved dominant pathways, not only Extracellular Structure Organization by GO and KEGG enrichment as BP_GO:0043062, MF_GO:0005201, CC_GO:0062023, and REACTOME_Cell extracellular matrix interactions by GSEA; but also ECM-related cell adhesion pathways, were of great instructive significance. Besides, as NAFLD is already the fastest growing cause of HCC globally [31–34], the lipid-related enrichments might put forward an inspiring direction for researchers to connect GDI2-mediates fatty acid metabolism with HCC. Notably, the GSEA analysis defined that the REACTOME_Rho GTPases Activate Formins (NES = 3.028, adj.P = 0.017, FDR = 0.009) pathway, and REACTOME_Immunoregulatory Interactions A Lymphoid and Non-lymphoid Cell (NES = 2.086, adj.P = 0.017, FDR = 0.009) pathway were also significantly enriched in our GDI2 study (data not shown). In view of the immune infiltration analysis that GDI2 expression was utmost positively correlated with T helper cells but utmost negatively with plasmacytoid Dendritic cells (pDC) (Figure 3), it could be speculated that GDI2 might play an role in immune tumor microenvironment for HCC progression, which definitely requires profound and comprehensive researches for further confirmation.
In terms of physiological correlation, there were many biological functions associated with GDI2 should be taken into consideration. For one thing, as the GDI2 expression was related to Weight and BMI (**P < 0.01), energy-required and metabolism-related biological functions of GDI2 could be emphasized. For another thing, the GDI2 expression was significantly associated with the serum AFP(ng/ml) level and TP53 mutated status (**P < 0.01). Since that AFP is an indicator for HCC diagnosis, the co-expression of GDI2 might tender it for a co-indicator in HCC diagnosis. While TP53, encoded by the typical antioncogene P53, is recently reported to be involved in the HIF1alpha/USP2/TP53 axis to promote hypoxia-induced HCC stemness [35], in the MiR-30e-3p/MDM2/TP53 axis to influence Sorafenib resistance in HCC [36], and a TP53-associated immune prognostic model for HCC has been developed and validated [37]. In view of that PID_P53 Regulation Pathway was enriched in GDI2-based GSEA analysis in our study (Figure 2H), the association of this novel protein GDI2 with transcriptional factor TP53 should be attached great importance to, as well as their interactive mechanism in HCC tumorigenesis should be studied for further confirmation. As for the clinicopathological correlation for HCC patients, it was found that the expression of GDI2 was increased as the disease progressed, especially for the HCC patients in late T stage, advanced pathologic stage, poor histologic grade, and with bad tumor status (*P < 0.05) (Figure 4). Since there was no reports demonstrating the clinicopathological correlation of GDI2 with HCC, our study figured out that upregulation of GDI2 might be applied as a diagnostic indicator for HCC progression for the first time.
What’s more, GDI2 could also act as a prognostic biomarker to correlate HCC patients with high GDI2 expression to poor prognosis, including poor overall survival (OS), poor progression-free interval (PFI), and poor disease-specific survival (DSS) (*P < 0.05) (Figure 5). On the contrary, HCC patients with low GDI2 expression could strongly improve their OS rate especially when they were in clinicopathological subtypes as T1 Stage, pathologic Stage I/II, retarded fibrosis with negative lymph nodes, without metastasis and vascular invasion (*P < 0.05) (Figure 6).
Definitely, even though the multiple bioinformatic analyses in our study elucidate the significant correlation of GDI2 gene with HCC for the first time, there were still a few limitations. Firstly, our results were mainly obtained from the TCGA database, lacking of comparisons among several databases made them not so comprehensive. Secondly, the sample size of HCC patients from TCGA with 371 cases was not large enough to acquire a convincing analytic result. Thirdly, the TCGA-LIHC samples of 371 patients were kinda of limited [38]: 1) There were three ethnic groups so that the genetic background and etiology of HCC among them could differ significantly; 2) The LIHC samples contain relatively few patients in T4 Stage, yet the clinical reality is that most HCC patients are with advanced disease and extremely poor prognosis when firstly diagnosed; 3) The transcriptome sequencing for RNAseq data can detect only static mutations at nucleic acid level, rather than directly provide information on expression or activity of proteins. Hence, follow-up studies and further confirmation should be carried out to fulfill these questions using molecular biology techniques. Anyway, considering that the clinical evaluation models, both Calibration discrimination and Nomogram evaluation were well-established; the results obtained in this study were basically creditable and instructive.
In conclusion, GDI2 expression was explored to be elevated in HCC tumor tissues and associated with poor prognosis in HCC patients from our TCGA study for the first time. After further confirmation verifying the biological functions of GDI2 and mechanisms of GDI2-related pathways, the relationship between GDI2 and HCC could be fully elucidated. We believe that GDI2 could be applied as a potential biomarker for diagnosis and prognosis for HCC patients, thus providing novel target and strategies for HCC treatment.
Materials and Methods
Data collection for bioinformatics analysis from TCGA data repository
We downloaded level 3 HTSeq - FPKM formatted RNAseq data and clinical information from LIHC-hepatocellular carcinoma project from the website: https://portal.gdc.cancer.gov/ of The Cancer Genome Atlas (TCGA). A total of 371 cases with gene expression data and clinical information were collected by discarding those RNAseq data without clinical information [39]. Meanwhile, 50 normal control cases from GTEx database were downloaded from UCSC XENA (https://xenabrowser.net/datapages/) and unified handled by Toil procedure [40]. Level 3 RNAseq data formatted as HTSeq-FPKM (Fregments Per Kilobase per Million) from TCGA and GTEx were transformed into TPM (transcripts per million reads) for subsequent analyses. This study was in accordance with the publication guidelines provided by TCGA (https://cancergenome.nih.gov/publications/publicationguidelines). All data used in this study were obtained from TCGA without containing any human participants or animals performed by any of the authors, and hence ethics approval and informed consent were not required.
Analysis of immune infiltration characteristics by ssGSEA
The ssGSEA (single-sample Gene Set Enrichment Analysis) method classifies marker gene sets in a single sample with common biological functions, chromosomal localization, and physiological regulation [41]. Normalized HCC gene expression profiles from formatted TPM data of single sample were compared with the immunocyte signatures using GSVA (R package) [42]. We quantified the relative tumor infiltration levels of immunocyte signature genes, including a total of 509 genes predicting the abundance of 24 tumor-infiltrating adaptive and innate immune cell types in individual tissue sample [43].
The following 24 types of immune cells were obtained: B cells; T cells, Helper T cells (Th), Cytotoxic T cells (Tc), CD4+ T cells, CD8+ T cells, type-1 T helper cells (Th1), type-2 T helper cells (Th2), type-17 T helper cells (Th17), Regulatory T cells (Treg), gamma delta T cells (γδT), central memory T cells (Tcm), effector memory T cells(Tem), follicular helper T cells(Tfh); Dendritic cells (DCs), activated Dendritic cells (aDCs), immature Dendritic cells (iDCs), plasmacytoid Dendritic cells (pDCs); natural killer (NK) cells, CD56 bright natural killer cellsr (CD56+NK), CD56 dim natural killer cells (CD56-NK); eosinophils, mast cells, neutrophils and macrophages. The correlation between GDI2 and these immune cells was analyzed by Spearman correlation, and Wilcoxon rank sum test was adopted to explore the association of the infiltration levels of immune cells between the high- and low- expression groups of GDI2 gene.
DEGs analysis between high and low GDI2 expression groups
We firstly used Wilcoxon Rank Sum Test to compare the expression of GDI2 gene between tumor and normal specimens from TCGA combined with GTEx database in pan-cancers, referring to 33 kinds of solid tumors. Then in LIHC, GDI2 expression was compared in both paired and unpaired normal-versus-tumor tissues. Finally, the GDI2expression profiles (HTSeq-counts) were compared between the divided high and low GDI2 expression groups to identify differentially expressed genes (DEGs) by using DESeq2 R package [44]. |log2-fold change (FC)|>1 and adjusted P-value<0.05 were considered as threshold values for the DEGs.
GO, KEGG and GSEA enrichment analysis
Gene Ontology (GO) functional analysis, including cellular component (CC), molecular function (MF), and biological process (BP), as well as Kyoto Encyclopedia of Genes and Genomes (KEGG) pathway analysis, were performed on the DEGs based on high and low GDI2 expression levels by using the ClusterProfiler package (http://www.bioconductor.org/) [45] with P value adjusted by Benjamini and Hochberg method, from which adjusted P-value of <0.05 was considered as significance for GO function and KEGG pathway.
Gene Set Enrichment Analysis (GSEA; http://software.broadinstitute.org/gsea/index.jsp) is a computational method that determines whether prior defined functions or pathway sets of genes show statistical significance, concordant differences between two biological states [46]. Thus in this study, GSEA was applied to generate an ordered list of all genes according to their correlation with GDI2 expression, then carried out by R package to elucidate the significant differences observed between high- and low- GDI2 expression. The datasets h.all.v7.0.symbols.gmt [Hallmarks] (https://www.gsea-msigdb.org/gsea/msigdb/collections.jsp#H) and c2.cp.v7.0.symbols.gmt [Curated] (https://www.gsea-msigdb.org/gsea/msigdb/collections.jsp#C2) from MSigDB Collections were chosen as reference gene sets, and the expression level of GDI2 was regarded as a phenotype. Gene set permutations were performed 1000 times for each analysis. A function or pathway term with adjusted P-value <0.05 and false discovery rate (FDR) <0.25 was considered to be statistically significant enrichment.
Protein-protein interaction (PPI) network
Search Tool for the Retrieval of Interacting Genes (STRING; http://string-db.org) (version 11.0) online database was used to predict PPI network co-regulated by GDI2 gene and exploring the functional interactions between co-regulatory proteins [47]. An interaction with a combined score > 0.7 was considered statistically significant.
Clinical association and prognostic analysis
Wilcoxon rank sum test and t. test were utilized to evaluate the clinical index (age, gender, weight, BMI, AFP(ng/ml), etc.) in non-paired samples and paired samples with different expression levels of GDI2 (the Fisher exact test was used when needed) [48]. The association of GDI2 expression with clinicopathological features, such as TNM stage (TNM stage is a way of staging tumors, in which T represents the range of primary tumors, N represents the presence and extent of regional lymph node metastasis and its scope, M represents the presence or absence of a distant transfer), pathologic stage, histologic grade, and TP53 status, was evaluated by Chi-square test, and Logistics regression was performed on both continuous TPM values and high- and low-classifications of GDI2 expression.
Clinical prognosis correlating GDI2 to Overall Survival (OS), Progression-Free Interval (PFI) and Disease-Specific Survival (DSS) of HCC patients, was assessed using Survminer package [49]. Survival curves were constructed using the Kaplan-Meier method, and the differences between the survival curves were examined by the log-rank test [50]. Clinicopathological risky factors were evaluated by Cox regression analyses. Univariate Cox proportional hazards regressions were applied to estimate the individual hazard ratio (HR) with GDI2 gene expression for HCC survival. The significant variables from the univariate analyses (P < 0.1) were then put into the multivariate analysis [51]. Multivariate Cox analysis was used to compare the influence of GDI2 expression on survival along with other clinical characteristics in order to find independent variables. The HR with 95% confidence interval (CI) was measured to estimate the hazard risk of individual factors. Prognostic analyses were performed in both main-group and sub-group of clinicopathological indicators with GDI2 expression, respectively.
Nomogram evaluation
Calibration and discrimination are the most commonly used methods for evaluating the performance of models [52]. In this study, the Calibration curves were graphically assessed by mapping the nomogram-predicted probabilities against the observed rates, and the 45° line represented the best predictive values. A concordance index (C-index) was used to determine the discrimination of the nomogram, and it was calculated by a bootstrap approach with 1000 resamples [53]. The predictive accuracies of the nomogram and separate prognostic factors were compared using both the C-index and ROC (receiver operating characteristic) analysis. As the frequently-used method for binary assessment, ROC analysis was performed by pROC package [54] to assess the effectiveness of the transcriptional expression of GDI2. The computed area under the curve (AUC) value ranging from 0.5 to 1.0 indicates the discrimination ability from 50 to 100%.
Cell lines and cell culture
The human normal hepatic cell line L02 and hepatic embryonic cell line WRL-68 were the kind gifts from Infection Department of First People’s Hospital of Yunnan Province. Seven human hepatoma cell lines: Huh7, SK-HEP1, BEL-7402, PLC/PRF/5, SMMC-7721, HepG2, Hep3B were purchased from Tongpai Biotechnology Company (Shanghai, China). All the cell lines were cultured in DMEM/high-glucose medium (Gibco, USA) supplemented with 10% fetal bovine serum (Gibco, USA) and 1% Penicillin-Streptomycin, and performed STR authentication [55].
RNA isolation and qRT-PCR analysis
Total RNA from HCC cell lines was isolated using RNAprep FastPure Animal/Cell Total RNA Extraction Kit (TSINGKE, Beijing, China) according to manufacturer's protocols. Then approximately 2μg of RNA were reverse transcribed using the Goldenstar™ RT6 cDNA Synthesis kit (TSINGKE, Beijing, China). For GDI2 detection, qRT-PCR labeled by SYBR green master mix (TSINGKE, Beijing, China) was performed on a LightCycler 480 system (Roche, USA). To confirm the expression from different transcripts of GDI2, primers indicating different transcripts and common primers of GDI2 for qRT-PCR are listed as below: GDI2: Forward: 5’ATTCCACAGAACCAAGTCAATCGA 3’; Reverse: 5’CTTCTCAGGCTCCTTGGTTTCC 3’; GDI2-Transcript I: Forward: 5'GGGCACCGGCCTGACGGAATGTA 3'; Reverse: 5'TGCCAGGGCTTCTGCTTCAGTGG 3'; GDI2-Transcript II: Forward: 5'CCACCCGAGTCAATGGGGAGAGG 3'; Reverse: 5'CTTGATGGGGTGGCTGAGGATGC 3'. ACTB was used as an internal reference: Forward: 5’CACCATTGGCAATGAGCGGTTCA 3’; Reverse: 5’AGGTCTTTGCGGATGTCCACGT 3’.
Western blot
Cultured cells were collected and washed twice with ice-cold PBS, then lysed in RIPA lysis mixed with PSMF (Beyotime, China) buffer on ice for 30 minutes. Cell lysates were collected immediately according to the manufacturer’s instructions and subjected to bicinchoninic acid (BCA) protein assay (Beyotime, China) for concentration determination. Equal amounts of proteins in each lane were separated by SDS-PAGE and subsequently transferred onto polyvinylidene fluoride (PVDF) membranes (Millipore, USA). The membranes were blocked with 3% (w/v) skim milk and then incubated with specific primary antibody at dilution of 1:5000 (anti-GDI2; Invitrogen, USA) overnight followed by incubation with horseradish peroxidase (HRP)-conjugated secondary antibody at dilution of 1:10000 (anti-rabbit-HRP; Cell Signaling Technology, USA). β-actin was used as an internal control at dilution of 1:10000 (anti-beta Actin; Cell Signaling Technology, USA). An enhanced chemiluminescence (ECL) chemiluminescence kit (ABclonal, China) was used to detect immunoreactive protein bands using a Gel Doc XR imaging system (Bio-Rad, USA).
Statistical analysis
All statistical analysis and plots referring to phenotype and expression profiles in 371 HCC patients from TCGA-LIHC were conducted using R package (v.3.5.1) (http://cran.r-project.org/web/packages/rms/index.html). In gene expression analysis, the median GDI2 expression was regarded as the cut-off value. All hypothetical tests were two-tailed and all reported P values < 0.05 were considered significant, marked as *P< 0.05; **P < 0.01. The statistical analysis was carried out using Graphpad Prism 8.0 and SPSS version 22.0.
Author Contributions
All the authors from different hospitals have worked together to carry out the study. For the contributions to this work, YXM and SZW were in charge of the design and analystic guide of this research; LZJ and XSL carried out downloading data from TCGA and GTEx database; YL and GZY carried out the gene enrichment analyses, while LL and TH completed survival analyses of HCC patients; ZW and GQ mainly sponsored this study and ZW was in charge of experimental verification in vitro and manuscript writing. All of the authors engaged much in the analyzing and writing work of this study, who are to be appreciated.
Conflicts of Interest
The authors declare that they have no conflicts of interest.
Funding
The research was supported by different funds of the first author without conflicts with other authors. The funds were applied for researching and publishing as following: Applied basic research program of Joint special of Science and Technology hall of Yunnan Province and Kunming Medical University [Number: 2017FE468(-104)]; Yunnan Provincial Key Laboratory of Clinical Virology [202005AG070062-013]; and Yunnan Digestive Endoscopy Clinical Medical Center Foundation for Health Commission of Yunnan Province [2020LCZXKF-XH06] and [2021LCZXXF-XH07] of [2X2019-01-02].
References
- 1. Forner A, Reig M, Bruix J. Hepatocellular carcinoma. Lancet. 2018; 391:1301–14. https://doi.org/10.1016/S0140-6736(18)30010-2 [PubMed]
- 2. Siegel RL, Miller KD, Jemal A. Cancer statistics, 2019. CA Cancer J Clin. 2019; 69:7–34. https://doi.org/10.3322/caac.21551 [PubMed]
- 3. Bray F, Ferlay J, Soerjomataram I, Siegel RL, Torre LA, Jemal A. Global cancer statistics 2018: GLOBOCAN estimates of incidence and mortality worldwide for 36 cancers in 185 countries. CA Cancer J Clin. 2018; 68:394–424. https://doi.org/10.3322/caac.21492 [PubMed]
- 4. Louafi S, Boige V, Ducreux M, Bonyhay L, Mansourbakht T, de Baere T, Asnacios A, Hannoun L, Poynard T, Taïeb J. Gemcitabine plus oxaliplatin (GEMOX) in patients with advanced hepatocellular carcinoma (HCC): results of a phase II study. Cancer. 2007; 109:1384–90. https://doi.org/10.1002/cncr.22532 [PubMed]
- 5. Levrero M, Zucman-Rossi J. Mechanisms of HBV-induced hepatocellular carcinoma. J Hepatol. 2016; 64:S84–101. https://doi.org/10.1016/j.jhep.2016.02.021 [PubMed]
- 6. Lohitesh K, Chowdhury R, Mukherjee S. Resistance a major hindrance to chemotherapy in hepatocellular carcinoma: an insight. Cancer Cell Int. 2018; 18:44. https://doi.org/10.1186/s12935-018-0538-7 [PubMed]
- 7. Nault JC, Villanueva A. Biomarkers for Hepatobiliary Cancers. Hepatology. 2021 (Suppl 1); 73:115–27. https://doi.org/10.1002/hep.31175 [PubMed]
- 8. Thietart S, Rautou PE. Extracellular vesicles as biomarkers in liver diseases: A clinician’s point of view. J Hepatol. 2020; 73:1507–25. https://doi.org/10.1016/j.jhep.2020.07.014 [PubMed]
- 9. Wang X, He Y, Mackowiak B, Gao B. MicroRNAs as regulators, biomarkers and therapeutic targets in liver diseases. Gut. 2021; 70:784–95. https://doi.org/10.1136/gutjnl-2020-322526 [PubMed]
- 10. Liu J, Tang W, Budhu A, Forgues M, Hernandez MO, Candia J, Kim Y, Bowman ED, Ambs S, Zhao Y, Tran B, Wu X, Koh C, et al. A Viral Exposure Signature Defines Early Onset of Hepatocellular Carcinoma. Cell. 2020; 182:317–28.e10. https://doi.org/10.1016/j.cell.2020.05.038 [PubMed]
- 11. Huang DQ, El-Serag HB, Loomba R. Global epidemiology of NAFLD-related HCC: trends, predictions, risk factors and prevention. Nat Rev Gastroenterol Hepatol. 2021; 18:223–38. https://doi.org/10.1038/s41575-020-00381-6 [PubMed]
- 12. Wei Z, Liu Y, Qiao S, Li X, Li Q, Zhao J, Hu J, Wei Z, Shan A, Sun X, Xu B. Identification of the potential therapeutic target gene UBE2C in human hepatocellular carcinoma: An investigation based on GEO and TCGA databases. Oncol Lett. 2019; 17:5409–18. https://doi.org/10.3892/ol.2019.10232 [PubMed]
- 13. Aldenhoven J, Chen Y, Backofen B, Moran C. Improving the comparative map of porcine chromosome 10 with respect to human chromosomes 1, 9 and 10. Cytogenet Genome Res. 2003; 102:121–27. https://doi.org/10.1159/000075736 [PubMed]
- 14. Shisheva A, Chinni SR, DeMarco C. General role of GDP dissociation inhibitor 2 in membrane release of Rab proteins: modulations of its functional interactions by in vitro and in vivo structural modifications. Biochemistry. 1999; 38:11711–21. https://doi.org/10.1021/bi990200r [PubMed]
- 15. de Graauw M, Cao L, Winkel L, van Miltenburg MH, le Dévédec SE, Klop M, Yan K, Pont C, Rogkoti VM, Tijsma A, Chaudhuri A, Lalai R, Price L, et al. Annexin A2 depletion delays EGFR endocytic trafficking via cofilin activation and enhances EGFR signaling and metastasis formation. Oncogene. 2014; 33:2610–19. https://doi.org/10.1038/onc.2013.219 [PubMed]
- 16. Sun ZL, Zhu Y, Wang FQ, Chen R, Peng T, Fan ZN, Xu ZK, Miao Y. Serum proteomic-based analysis of pancreatic carcinoma for the identification of potential cancer biomarkers. Biochim Biophys Acta. 2007; 1774:764–71. https://doi.org/10.1016/j.bbapap.2007.04.001 [PubMed]
- 17. Bai Z, Ye Y, Liang B, Xu F, Zhang H, Zhang Y, Peng J, Shen D, Cui Z, Zhang Z, Wang S. Proteomics-based identification of a group of apoptosis-related proteins and biomarkers in gastric cancer. Int J Oncol. 2011; 38:375–83. https://doi.org/10.3892/ijo.2010.873 [PubMed]
- 18. Chong UR, Abdul-Rahman PS, Abdul-Aziz A, Hashim OH, Junit SM. Tamarindus indica extract alters release of alpha enolase, apolipoprotein A-I, transthyretin and Rab GDP dissociation inhibitor beta from HepG2 cells. PLoS One. 2012; 7:e39476. https://doi.org/10.1371/journal.pone.0039476 [PubMed]
- 19. Weinstein JN, Collisson EA, Mills GB, Shaw KR, Ozenberger BA, Ellrott K, Shmulevich I, Sander C, Stuart JM, and Cancer Genome Atlas Research Network. The Cancer Genome Atlas Pan-Cancer analysis project. Nat Genet. 2013; 45:1113–20. https://doi.org/10.1038/ng.2764 [PubMed]
- 20. Morè L, Künnecke B, Yekhlef L, Bruns A, Marte A, Fedele E, Bianchi V, Taverna S, Gatti S, D’Adamo P. Altered fronto-striatal functions in the Gdi1-null mouse model of X-linked Intellectual Disability. Neuroscience. 2017; 344:346–59. https://doi.org/10.1016/j.neuroscience.2016.12.043 [PubMed]
- 21. Liu C, Wang W, Lin P, Xie H, Jiang S, Jia H, Li R, Wang N, Yu X. GDI2 is a target of paclitaxel that affects tumorigenesis of prostate cancer via the p75NTR signaling pathway. Biochem Biophys Res Commun. 2021; 562:119–26. https://doi.org/10.1016/j.bbrc.2021.05.015 [PubMed]
- 22. Lee DH, Chung K, Song JA, Kim TH, Kang H, Huh JH, Jung SG, Ko JJ, An HJ. Proteomic identification of paclitaxel-resistance associated hnRNP A2 and GDI 2 proteins in human ovarian cancer cells. J Proteome Res. 2010; 9:5668–76. https://doi.org/10.1021/pr100478u [PubMed]
- 23. Zhang XY, Hong SS, Zhang M, Cai QQ, Zhang MX, Xu CJ. Proteomic alterations of fibroblasts induced by ovarian cancer cells reveal potential cancer targets. Neoplasma. 2018; 65:104–12. https://doi.org/10.4149/neo_2018_101 [PubMed]
- 24. Raffaniello R, Fedorova D, Ip D, Rafiq S. Hsp90 Co-localizes with Rab-GDI-1 and regulates agonist-induced amylase release in AR42J cells. Cell Physiol Biochem. 2009; 24:369–78. https://doi.org/10.1159/000257429 [PubMed]
- 25. Onda M, Emi M, Yoshida A, Miyamoto S, Akaishi J, Asaka S, Mizutani K, Shimizu K, Nagahama M, Ito K, Tanaka T, Tsunoda T. Comprehensive gene expression profiling of anaplastic thyroid cancers with cDNA microarray of 25 344 genes. Endocr Relat Cancer. 2004; 11:843–54. https://doi.org/10.1677/erc.1.00818 [PubMed]
- 26. Jenkins NC, Kalra RR, Dubuc A, Sivakumar W, Pedone CA, Wu X, Taylor MD, Fults DW. Genetic drivers of metastatic dissemination in sonic hedgehog medulloblastoma. Acta Neuropathol Commun. 2014; 2:85. https://doi.org/10.1186/s40478-014-0085-y [PubMed]
- 27. Kashyap MK, Harsha HC, Renuse S, Pawar H, Sahasrabuddhe NA, Kim MS, Marimuthu A, Keerthikumar S, Muthusamy B, Kandasamy K, Subbannayya Y, Prasad TS, Mahmood R, et al. SILAC-based quantitative proteomic approach to identify potential biomarkers from the esophageal squamous cell carcinoma secretome. Cancer Biol Ther. 2010; 10:796–810. https://doi.org/10.4161/cbt.10.8.12914 [PubMed]
- 28. Guzmán-Ruiz R, Tercero-Alcázar C, Rabanal-Ruiz Y, Díaz-Ruiz A, El Bekay R, Rangel-Zuñiga OA, Navarro-Ruiz MC, Molero L, Membrives A, Ruiz-Rabelo JF, Pandit A, López-Miranda J, Tinahones FJ, Malagón MM. Adipose tissue depot-specific intracellular and extracellular cues contributing to insulin resistance in obese individuals. FASEB J. 2020; 34:7520–39. https://doi.org/10.1096/fj.201902703R [PubMed]
- 29. Kramer SR, Goregaoker SP, Culver JN. Association of the Tobacco mosaic virus 126kDa replication protein with a GDI protein affects host susceptibility. Virology. 2011; 414:110–18. https://doi.org/10.1016/j.virol.2010.12.030 [PubMed]
- 30. De Masi R, Pasca S, Scarpello R, Idolo A, De Donno A. The clinical potential of blood-proteomics in multiple sclerosis. BMC Neurol. 2013; 13:45. https://doi.org/10.1186/1471-2377-13-45 [PubMed]
- 31. Yang JD, Ahmed F, Mara KC, Addissie BD, Allen AM, Gores GJ, Roberts LR. Diabetes Is Associated With Increased Risk of Hepatocellular Carcinoma in Patients With Cirrhosis From Nonalcoholic Fatty Liver Disease. Hepatology. 2020; 71:907–16. https://doi.org/10.1002/hep.30858 [PubMed]
- 32. Ponziani FR, Bhoori S, Castelli C, Putignani L, Rivoltini L, Del Chierico F, Sanguinetti M, Morelli D, Paroni Sterbini F, Petito V, Reddel S, Calvani R, Camisaschi C, et al. Hepatocellular Carcinoma Is Associated With Gut Microbiota Profile and Inflammation in Nonalcoholic Fatty Liver Disease. Hepatology. 2019; 69:107–20. https://doi.org/10.1002/hep.30036 [PubMed]
- 33. Kim D, Li AA, Perumpail BJ, Gadiparthi C, Kim W, Cholankeril G, Glenn JS, Harrison SA, Younossi ZM, Ahmed A. Changing Trends in Etiology-Based and Ethnicity-Based Annual Mortality Rates of Cirrhosis and Hepatocellular Carcinoma in the United States. Hepatology. 2019; 69:1064–74. https://doi.org/10.1002/hep.30161 [PubMed]
- 34. Dhanasekaran R, Felsher DW. A Tale of Two Complications of Obesity: NASH and Hepatocellular Carcinoma. Hepatology. 2019; 70:1056–58. https://doi.org/10.1002/hep.30649 [PubMed]
- 35. Ling S, Shan Q, Zhan Q, Ye Q, Liu P, Xu S, He X, Ma J, Xiang J, Jiang G, Wen X, Feng Z, Wu Y, et al. USP22 promotes hypoxia-induced hepatocellular carcinoma stemness by a HIF1α/USP22 positive feedback loop upon TP53 inactivation. Gut. 2020; 69:1322–34. https://doi.org/10.1136/gutjnl-2019-319616 [PubMed]
- 36. Gramantieri L, Pollutri D, Gagliardi M, Giovannini C, Quarta S, Ferracin M, Casadei-Gardini A, Callegari E, De Carolis S, Marinelli S, Benevento F, Vasuri F, Ravaioli M, et al. MiR-30e-3p Influences Tumor Phenotype through MDM2/ TP53 Axis and Predicts Sorafenib Resistance in Hepatocellular Carcinoma. Cancer Res. 2020; 80:1720–34. https://doi.org/10.1158/0008-5472.CAN-19-0472 [PubMed]
- 37. Long J, Wang A, Bai Y, Lin J, Yang X, Wang D, Yang X, Jiang Y, Zhao H. Development and validation of a TP53-associated immune prognostic model for hepatocellular carcinoma. EBioMedicine. 2019; 42:363–74. https://doi.org/10.1016/j.ebiom.2019.03.022 [PubMed]
- 38. Lin Y, Liang R, Qiu Y, Lv Y, Zhang J, Qin G, Yuan C, Liu Z, Li Y, Zou D, Mao Y. Expression and gene regulation network of RBM8A in hepatocellular carcinoma based on data mining. Aging (Albany NY). 2019; 11:423–47. https://doi.org/10.18632/aging.101749 [PubMed]
- 39. Wang J, Huang R, Huang Y, Chen Y, Chen F. Overexpression of NOP58 as a Prognostic Marker in Hepatocellular Carcinoma: A TCGA Data-Based Analysis. Adv Ther. 2021; 38:3342–61. https://doi.org/10.1007/s12325-021-01762-2 [PubMed]
- 40. Vivian J, Rao AA, Nothaft FA, Ketchum C, Armstrong J, Novak A, Pfeil J, Narkizian J, Deran AD, Musselman-Brown A, Schmidt H, Amstutz P, Craft B, et al. Toil enables reproducible, open source, big biomedical data analyses. Nat Biotechnol. 2017; 35:314–16. https://doi.org/10.1038/nbt.3772 [PubMed]
- 41. Kobayashi Y, Kushihara Y, Saito N, Yamaguchi S, Kakimi K. A novel scoring method based on RNA-Seq immunograms describing individual cancer-immunity interactions. Cancer Sci. 2020; 111:4031–40. https://doi.org/10.1111/cas.14621 [PubMed]
- 42. Hänzelmann S, Castelo R, Guinney J. GSVA: gene set variation analysis for microarray and RNA-seq data. BMC Bioinformatics. 2013; 14:7. https://doi.org/10.1186/1471-2105-14-7 [PubMed]
- 43. Bindea G, Mlecnik B, Tosolini M, Kirilovsky A, Waldner M, Obenauf AC, Angell H, Fredriksen T, Lafontaine L, Berger A, Bruneval P, Fridman WH, Becker C, et al. Spatiotemporal dynamics of intratumoral immune cells reveal the immune landscape in human cancer. Immunity. 2013; 39:782–95. https://doi.org/10.1016/j.immuni.2013.10.003 [PubMed]
- 44. Love MI, Huber W, Anders S. Moderated estimation of fold change and dispersion for RNA-seq data with DESeq2. Genome Biol. 2014; 15:550. https://doi.org/10.1186/s13059-014-0550-8 [PubMed]
- 45. Yu G, Wang LG, Han Y, He QY. clusterProfiler: an R package for comparing biological themes among gene clusters. OMICS. 2012; 16:284–87. https://doi.org/10.1089/omi.2011.0118 [PubMed]
- 46. Subramanian A, Tamayo P, Mootha VK, Mukherjee S, Ebert BL, Gillette MA, Paulovich A, Pomeroy SL, Golub TR, Lander ES, Mesirov JP. Gene set enrichment analysis: a knowledge-based approach for interpreting genome-wide expression profiles. Proc Natl Acad Sci USA. 2005; 102:15545–50. https://doi.org/10.1073/pnas.0506580102 [PubMed]
- 47. Szklarczyk D, Gable AL, Lyon D, Junge A, Wyder S, Huerta-Cepas J, Simonovic M, Doncheva NT, Morris JH, Bork P, Jensen LJ, Mering CV. STRING v11: protein-protein association networks with increased coverage, supporting functional discovery in genome-wide experimental datasets. Nucleic Acids Res. 2019; 47:D607–13. https://doi.org/10.1093/nar/gky1131 [PubMed]
- 48. Liu Y, Yang Y, Luo Y, Wang J, Lu X, Yang Z, Yang J. Prognostic potential of PRPF3 in hepatocellular carcinoma. Aging (Albany NY). 2020; 12:912–30. https://doi.org/10.18632/aging.102665 [PubMed]
- 49. Liu J, Lichtenberg T, Hoadley KA, Poisson LM, Lazar AJ, Cherniack AD, Kovatich AJ, Benz CC, Levine DA, Lee AV, Omberg L, Wolf DM, Shriver CD, et al, and Cancer Genome Atlas Research Network. An Integrated TCGA Pan-Cancer Clinical Data Resource to Drive High-Quality Survival Outcome Analytics. Cell. 2018; 173:400–16.e11. https://doi.org/10.1016/j.cell.2018.02.052 [PubMed]
- 50. Zeng L, Fan X, Wang X, Deng H, Zhang K, Zhang X, He S, Li N, Han Q, Liu Z. Bioinformatics Analysis based on Multiple Databases Identifies Hub Genes Associated with Hepatocellular Carcinoma. Curr Genomics. 2019; 20:349–61. https://doi.org/10.2174/1389202920666191011092410 [PubMed]
- 51. Liu J, Li W, Zhao H. CFHR3 is a potential novel biomarker for hepatocellular carcinoma. J Cell Biochem. 2020; 121:2970–80. https://doi.org/10.1002/jcb.29551 [PubMed]
- 52. Stulberg JJ, Huang R, Kreutzer L, Ban K, Champagne BJ, Steele SR, Johnson JK, Holl JL, Greenberg CC, Bilimoria KY. Association Between Surgeon Technical Skills and Patient Outcomes. JAMA Surg. 2020; 155:960–68. https://doi.org/10.1001/jamasurg.2020.3007 [PubMed]
- 53. Lin S, Mo H, Li Y, Guan X, Chen Y, Wang Z, Yuan P, Wang J, Luo Y, Fan Y, Cai R, Li Q, Chen S, et al. Development and validation of a nomogram for predicting survival of advanced breast cancer patients in China. Breast. 2020; 53:172–80. https://doi.org/10.1016/j.breast.2020.08.004 [PubMed]
- 54. Robin X, Turck N, Hainard A, Tiberti N, Lisacek F, Sanchez JC, Müller M. pROC: an open-source package for R and S+ to analyze and compare ROC curves. BMC Bioinformatics. 2011; 12:77. https://doi.org/10.1186/1471-2105-12-77 [PubMed]
- 55. Robin T, Capes-Davis A, Bairoch A. CLASTR: The Cellosaurus STR similarity search tool - A precious help for cell line authentication. Int J Cancer. 2020; 146:1299–306. https://doi.org/10.1002/ijc.32639 [PubMed]