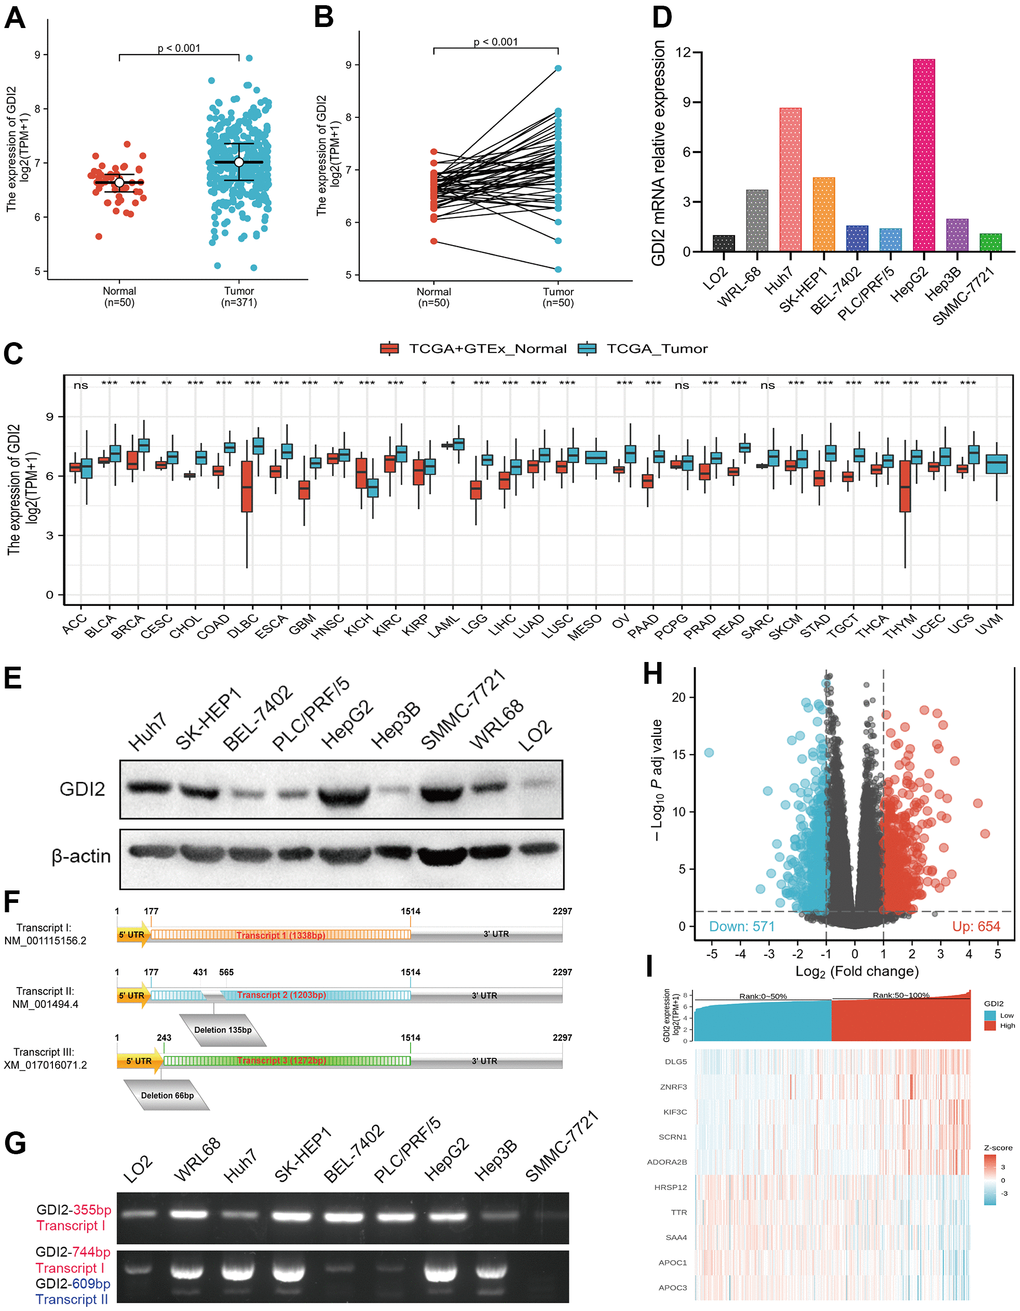
Figure 1.Differentially expressed genes (DEGs) involved in GDI2 expressing cancer groups. (A) Elevated expression of GDI2 between Normal and Tumor tissues of HCC patients. (B) Elevated expression of GDI2 in 50 paired Normal-and-Tumor tissues of HCC patients. (C) Box plot of the differentially expression of GDI2 gene among 33 kinds of pan-cancers. The X-axis represents the pan-cancer types, while the Y-axis denotes the expression of GDI2. (D) qRT-PCR assay confirmed the GDI2 mRNA expressions in two normal hepatic cells and seven hepatoma cells. (E) Western blot assay confirmed the protein levels of GDI2 in two normal hepatic cells and seven hepatoma cells. (F) Structural diagram of Transcript I, II and III of GDI2 gene. (G) Electrophoretogram for expressions of Transcript I, II and III of GDI2 gene based on different fragments of PCR primers in two normal hepatic cells and seven hepatoma cells. (H) Volcano plot of differential gene profiles between GDI2-high and -low groups. In 1225 DEGs, 654 upregulated and 571 downregulated genes were represented by red and blue tones, respectively. (I) Heat map of 10 significantly differentially expressed DEGs between GDI2-high and -low groups. Normalized expression levels are shown in descending order from red to blue. *P < 0.05, **P < 0.01, ***P < 0.001.