


Introduction
The exact cause of the eye disease age-related macular degeneration (AMD) is unknown, but the most significant risk factor is aging [1]. A study estimates that nearly 200 million people globally have AMD. These numbers are expected to rise to nearly 300 million by 2040 due to increased life expectancy [2]. AMD is a debilitating disease affecting central visual acuity and complicates everyday activities such as reading, driving, and recognizing faces. There is an urgent need for a better understanding of the condition and better treatment options.
Age-related macular degeneration is divided into early-, intermediate- and late AMD. Late-stage AMD can take two forms: the fast-developing neovascular AMD (nAMD) and the more slowly progressing atrophic form, geographic atrophy (GA).
A characteristic of all stages of AMD is the presence of small deposits of lipids and proteins (drusen) lying below or above the retinal pigment epithelium (RPE) of the retina [3]. Why we develop drusen is not entirely understood, but they occur with increasing age in most people, and the risk of developing late AMD increase with the number and size of drusen [4, 5]. The buildup of cellular damage characterizes the aging process, and the declining functions of the repair mechanisms can lead to the buildup of cellular defects or debris [6]. The current understanding of drusen pathophysiology is a process initiated locally and starts with the accumulation of debris in Bruch’s membrane (BM) and the following thickening of this layer. The debris buildup occurs partly by accumulating waste products from the visual cycle and nutrients and waste products from the bidirectional transport between the choroid, BM, RPE, and photoreceptors. With age, the thickening of the BM seems to decrease the function of the bidirectional flow, and an accumulation of lipids is seen, resulting in drusen formation. The RPE cells are suspected of contributing to this process and the subsequent complement activation and induction of reactive oxygen species (ROS) [7, 8]. In a proposed two-level hypothesis, this random accumulation of debris is the “first step,” and the systemic inflammatory response to this damage is the second. Both steps are thought to be necessary to develop AMD [8].
Our recent work investigated AMD in patients with Philadelphia chromosome-negative myeloproliferative neoplasms (MPN) [9]. The MPNs are a group of closely related hematological cancers named essential thrombocythemia (ET), polycythemia vera (PV), and primary myelofibrosis (PMF). They are thought to evolve in a biological continuum from early-stage ET to PV to PMF [10, 11]. The diseases are characterized by acquired driver mutations in the JAK2, MPL, and CALR genes, resulting in excessive production of myeloid cells, overproduction of inflammatory markers, and a massive symptom burden [12].
The rationale for investigating patients with MPNs is that we have found an increased prevalence of AMD, including an increased prevalence of drusen in these patients [13, 14]. The MPNs do not only have a higher prevalence of drusen and AMD, but drusen also show up earlier, and significantly more younger people have drusen than the background population [14]. We have also shown that the drusen prevalence in MPNs was associated with an increased level of chronic low-grade inflammation (CLI), and we also found evidence of a dysregulated complement system. In this recent work, we proposed to use MPNs as a “Human Inflammation Model” of drusen development. The CLI triggers drusen formation, leading to more CLI, creating a self-perpetuating vicious cycle, increasing the risk of developing late AMD. This idea challenges the current theory of drusen pathophysiology happening at least initially locally.
Both CLI and AMD are associated with aging. In AMD, retinal aging is observed, and in peripheral blood of these patients, accelerated T cell differentiation and elevated aging markers have been found [15], but we do not know the role of the aging peripheral immune system on AMD. Patients with MPNs provide a unique opportunity to investigate immune aging in patients with and without drusen and evaluate if patients with MPNs also show signs of accelerated immune aging.
Numerous studies of the normal aging process have identified changes in the immune system with age. These changes are often termed “immunosenescence,” and one of the most notable changes is that the proportion of naïve CD8 T cells decreases. In contrast, the memory T cell pool increase, altering the cytokine profile since the different T cells secrete various cytokines, which alter functions of T cells such as cytokine production and T cell proliferation. Studies indicate that senescent T cells are synonymous with effector T cells [16–18], and therefore, senescent T cells accumulate with age [19–21].
The CD4 T cell compartment shows smaller age-related changes than the CD8 compartment [19, 20]. Other recognized changes with age are the loss of the co-receptors for T cell stimulation CD27 and CD28 [21], the upregulation of cytolytic activity, and an increase in markers commonly associated with natural killer cells (NKRs) [22–25]. Also, a chronic pro-inflammatory milieu is associated with aging, often termed “inflammaging” [26].
With this study, we wanted to investigate markers of immunosenescence in patients with MPN and MPN subtypes. We specifically evaluated CD4+ and CD8+ T cell differentiation (naïve, central memory (CM), effector memory (EM), and effector memory CD45Ra+ cells (EMRA) – Figure 1 [16, 17, 27]). Additionally, we assessed the loss of the costimulatory markers CD27 and CD28 and the expression of an NKR CD56+ used as a marker for T cell aging. We also wanted to compare patients with MPNs and drusen (MPNd) with patients with MPNs and normal retinas (MPNn) and finally to compare these results with patients having AMD. The purpose was to identify differences between patients with and without drusen and how these patients resemble patients with AMD. This may reveal information that could be relevant for the pathogenesis of AMD.
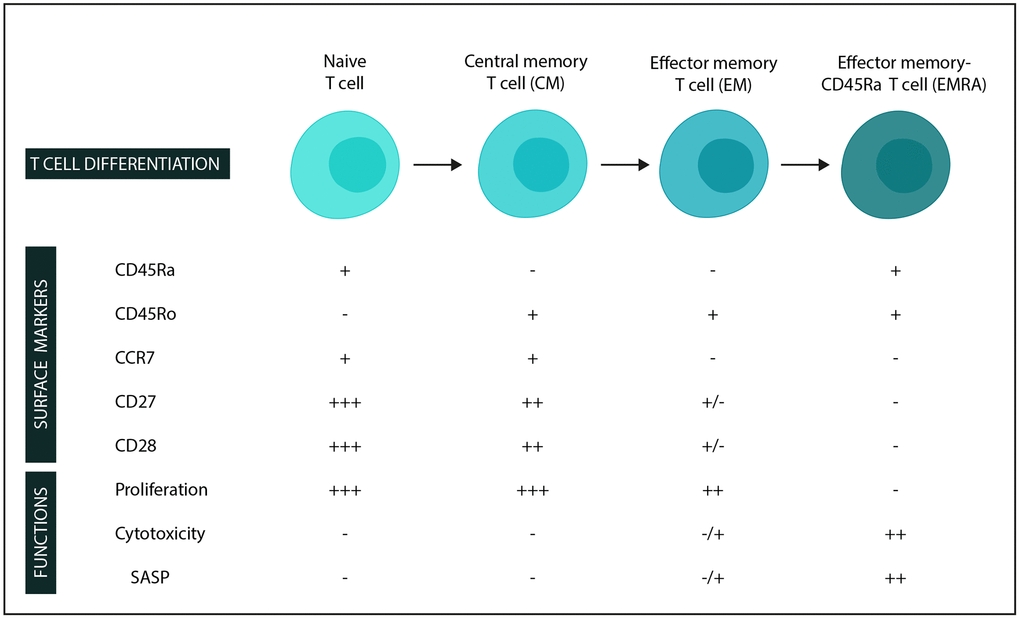
Figure 1. Surface markers and functions in stages of T-cell differentiation (in the CD4 and CD8 compartments). −: low expression/not expressed/function not present. +: expressed/function present, and additional +’s: higher expression/function. Abbreviation: SASP: Senescence-associated secretory phenotype.
Results
Study population
We included 123 patients in the study. Four patients were excluded post hoc. One patient because of a high CRP, implying an ongoing acute immune response, two patients because they fulfilled the criteria of having GA; and one was excluded because the flow cytometric analyses failed. The result was 119 included patients: 29 nAMD, 28 iAMD, 35 MPNd, and 27 MPNn. The patients are the same as in our previous work, and patient characteristics (Table 1) are therefore identical [9].
Table 1. Patient characteristics.
| nAMD (n = 29) | iAMD (n = 28) | MPNd (n = 35) | MPNn (n = 27) | p-value | |||||||||||||||||||||||||||||||||||||||||||||||||||||||||||||||||||||||||||||||||||||||||||||||
| Demographics | |||||||||||||||||||||||||||||||||||||||||||||||||||||||||||||||||||||||||||||||||||||||||||||||||||
| Age, years, median (IQR) | 77 (71–82) | 73 (68–76) | 72 (65–76) | 69 (62–74) | <0.001a | ||||||||||||||||||||||||||||||||||||||||||||||||||||||||||||||||||||||||||||||||||||||||||||||
| Sex | 0.28b | ||||||||||||||||||||||||||||||||||||||||||||||||||||||||||||||||||||||||||||||||||||||||||||||||||
| Males, n (%) | 12 (41) | 10 (36) | 20 (57) | 10 (37) | |||||||||||||||||||||||||||||||||||||||||||||||||||||||||||||||||||||||||||||||||||||||||||||||
| Females, n (%) | 17 (59) | 18 (64) | 15 (43) | 17 (63) | |||||||||||||||||||||||||||||||||||||||||||||||||||||||||||||||||||||||||||||||||||||||||||||||
| Lifestyle factors | |||||||||||||||||||||||||||||||||||||||||||||||||||||||||||||||||||||||||||||||||||||||||||||||||||
| Smoking, n (%) | 0.83c | ||||||||||||||||||||||||||||||||||||||||||||||||||||||||||||||||||||||||||||||||||||||||||||||||||
| Never | 12 (41) | 12 (43) | 16 (46) | 11 (41) | |||||||||||||||||||||||||||||||||||||||||||||||||||||||||||||||||||||||||||||||||||||||||||||||
| Former | 13 (45) | 13 (46) | 18 (51) | 14 (52) | |||||||||||||||||||||||||||||||||||||||||||||||||||||||||||||||||||||||||||||||||||||||||||||||
| Current | 4 (14) | 3 (11) | 1 (3) | 2 (7) | |||||||||||||||||||||||||||||||||||||||||||||||||||||||||||||||||||||||||||||||||||||||||||||||
| Body mass index, mean (95%CI) | 26 (24–27) | 25 (24–27) | 25 (24–27) | 27 (25–29) | 0.48d | ||||||||||||||||||||||||||||||||||||||||||||||||||||||||||||||||||||||||||||||||||||||||||||||
| Alcohol consumption, units per week, median (IQR) | 2 (0–7) | 3 (0–7) | 7 (2–14) | 2 (0–8) | 0.0036a | ||||||||||||||||||||||||||||||||||||||||||||||||||||||||||||||||||||||||||||||||||||||||||||||
| Comorbidities | |||||||||||||||||||||||||||||||||||||||||||||||||||||||||||||||||||||||||||||||||||||||||||||||||||
| Cardiovascular disease, n (%) | 4 (14) | 5 (18) | 6 (17) | 6 (22) | 0.89c | ||||||||||||||||||||||||||||||||||||||||||||||||||||||||||||||||||||||||||||||||||||||||||||||
| Hypertension, n (%) | 13 (45) | 8 (29) | 18 (51) | 17 (63) | 0.075b | ||||||||||||||||||||||||||||||||||||||||||||||||||||||||||||||||||||||||||||||||||||||||||||||
| Hypercholesterolemia, n (%) | 4 (14) | 2 (7) | 3 (9) | 2 (7) | 0.82c | ||||||||||||||||||||||||||||||||||||||||||||||||||||||||||||||||||||||||||||||||||||||||||||||
| Type 2 diabetes, n (%) | 2 (7) | 1 (4) | 2 (6) | 0 (0) | 0.76c | ||||||||||||||||||||||||||||||||||||||||||||||||||||||||||||||||||||||||||||||||||||||||||||||
| MPN diagnosis (MPN patients only) | 0.082b | ||||||||||||||||||||||||||||||||||||||||||||||||||||||||||||||||||||||||||||||||||||||||||||||||||
| Essential thrombocythemia, n (%) | − | − | 6 (17) | 11 (41) | |||||||||||||||||||||||||||||||||||||||||||||||||||||||||||||||||||||||||||||||||||||||||||||||
| Polycythemia vera, n (%) | − | − | 26 (74) | 13 (48) | |||||||||||||||||||||||||||||||||||||||||||||||||||||||||||||||||||||||||||||||||||||||||||||||
| Pre-PMF, n (%) | − | − | 0 (0) | 1 (4) | |||||||||||||||||||||||||||||||||||||||||||||||||||||||||||||||||||||||||||||||||||||||||||||||
| Primary myelofibrosis, n (%) | − | − | 3 (9) | 2 (7) | |||||||||||||||||||||||||||||||||||||||||||||||||||||||||||||||||||||||||||||||||||||||||||||||
| Mutation status (MPN patients only) | − | − | 0.43c | ||||||||||||||||||||||||||||||||||||||||||||||||||||||||||||||||||||||||||||||||||||||||||||||||
| JAK2V617F, n (%) | − | − | 31 (91) | 22 (82) | |||||||||||||||||||||||||||||||||||||||||||||||||||||||||||||||||||||||||||||||||||||||||||||||
| CALR mutation, n (%) | − | − | 1 (3) | 3 (11) | |||||||||||||||||||||||||||||||||||||||||||||||||||||||||||||||||||||||||||||||||||||||||||||||
| MPL mutation, n (%) | − | − | 1 (3) | 0 (0) | |||||||||||||||||||||||||||||||||||||||||||||||||||||||||||||||||||||||||||||||||||||||||||||||
| Triple-Negative, n (%) | − | − | 1 (3) | 2 (7) | |||||||||||||||||||||||||||||||||||||||||||||||||||||||||||||||||||||||||||||||||||||||||||||||
| Significant p-values are shown in bold. Statistical comparisons between groups: aKruskal Wallis test, bPearson's Chi-squared test, cFischer’s exact test, dOne-way ANOVA. Abbreviations: AMD: age-related macular degeneration; nAMD: neovascular AMD; iAMD: intermediate AMD; MPN: myeloproliferative neoplasms; MPNd: Patients with MPN and drusen; MPNn: patients with MPN and normal retinas; IQR: interquartile range; PV: polycythemia vera; ET: essential thrombocythemia; PreMF: pre-myelofibrosis; PMF: primary myelofibrosis; JAK2V617F: mutation in the JAK2 gene; CALR: calreticulin gene; MPL: MPL gene; the gene encoding the thrombopoietin receptor. | |||||||||||||||||||||||||||||||||||||||||||||||||||||||||||||||||||||||||||||||||||||||||||||||||||
Patients with nAMD had a median age of 77 (IQR: 71–82) years, significantly older than iAMD (73 years, IQR: 68–76, p = 0.034) MPNd (72 years, IQR: 65–76, p = 0.0040) and MPNn (69 years, IQR: 62–74, p < 0.001). No differences were found between the groups regarding sex, smoking habits, body mass index, and comorbidities. The MPNd group had a higher median alcohol consumption of 7 units per week than nAMD (2, IQR: 0–7, p < 0.001), iAMD (3, IQR: 0–7, p = 0.019), and MPNn (2, IQR: 0–8, p0.021). We found no influence of alcohol consumption on outcomes reported in the following sections. The distribution of subtypes of MPNs was 39 PV-, 17 ET-, and six PMF patients. Most patients with MPN had the JAK2V617F-mutation (82%), fewer CALR (6.2%), and MPL (1.5%). We detected no difference in JAK2V617F allele burden between the two MPN groups (p = 0.088), but it seemed that MPNn had a lower allele burden of 17% compared to 33% for MPNd. We also subdivided allele burden into four groups of 0–25%, >25–50%, >50%–75%, and >75%, and no difference in distribution between the two groups was seen (p = 0.61). There were no differences between the MPN groups regarding treatment with hydroxyurea (HU) (p = 0.99). All received acetylsalicylic acid or other anticoagulant therapy. The distribution of patients receiving statins was similar across all groups (p-value = 0.58).
CD4+ and CD8+ T cells
Patients with iAMD had a lymphocyte percentage of 15% (CI: 13–18), significantly higher than 11% (CI: 8.8–13) in AMD (p = 0.0050), 8.8% (CI: 7.3–10) in MPNd (p < 0.001) and 9.9% (CI: 8.6–11) in MPNn (p < 0.001). No difference was found in the CD4+ T cell percentage between the groups (p = 0.86), but AMD and iAMD had a statistically significant higher percentage of CD8+ T cells (30% (IQR: 22–34) and 28% (IQR: 21–33)) than the MPNd and MPNn groups (23% (IQR: 17–28) and 22% (IQR: 16–28)) (nAMD- MPNd: p = 0.0010, nAMD-MPNn: p = 0.0040, iAMD-MPNd: p = 0.050, iAMD-MPNn: p = 0.038) (Figure 2B). We did not find any differences between groups in CD4/CD8 ratio or the CD4+CD8+ double-positive cells percentage (p = 0.68 and p = 0.44) (data not shown).
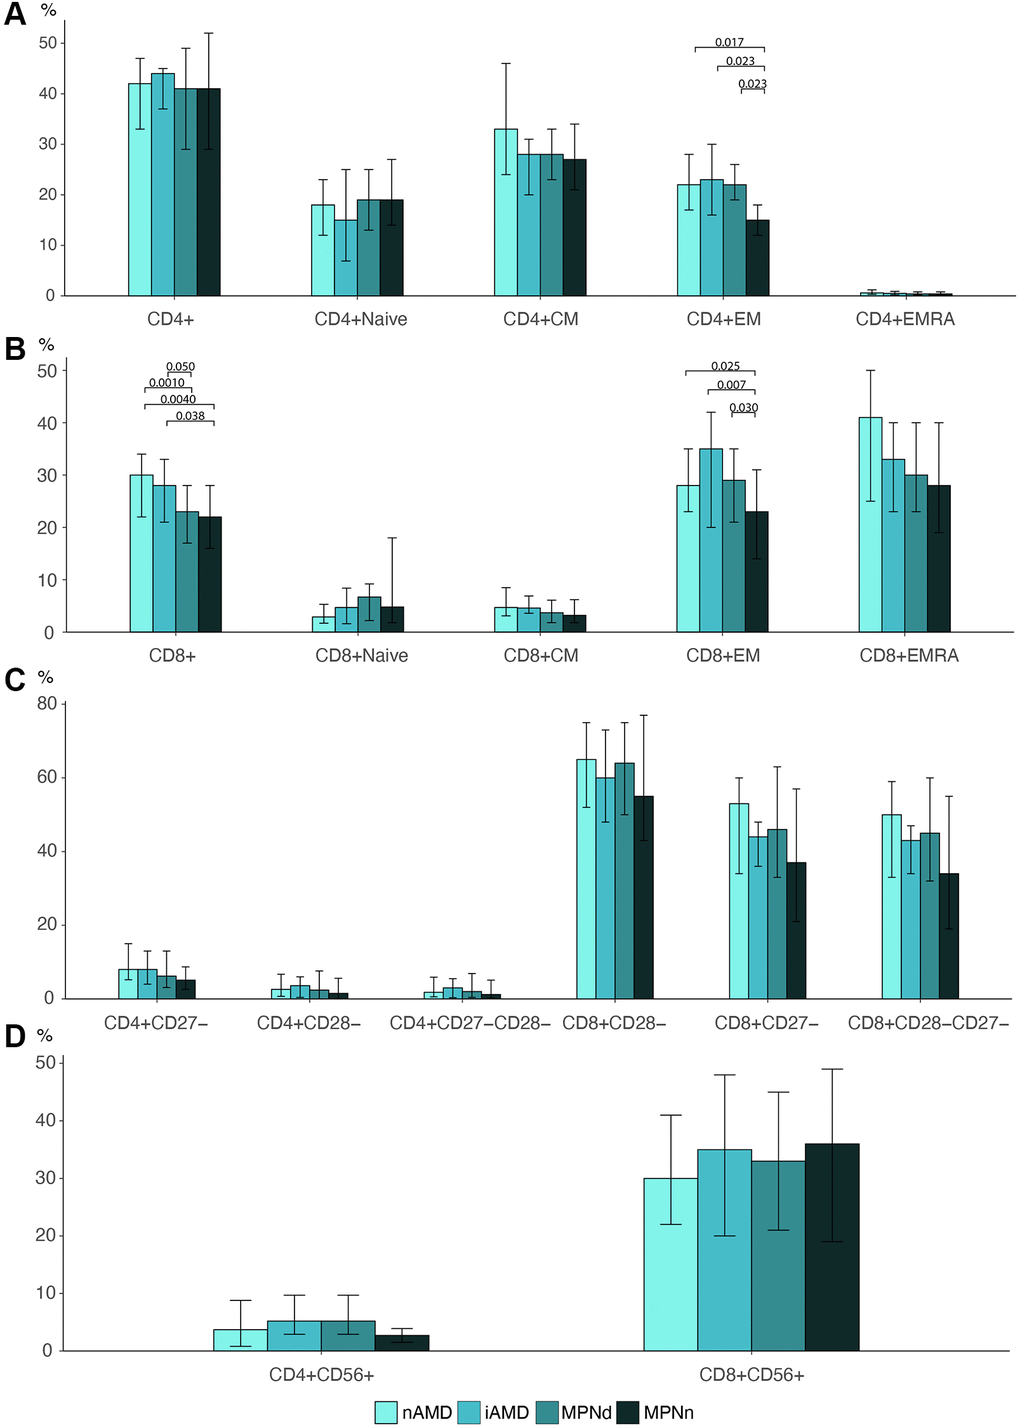
Figure 2. Barplots of (A) CD4 T cell differentiation profile. (B) CD8 T cell differentiation profile. (C) Loss of costimulatory markers in CD4 and CD8 T cells. (D) CD56 expression in CD4 and CD8 cells Statistically significant p-values are shown above bar plots. Statistical comparisons between groups: Kruskal Wallis test or robust linear regression if the outcome were age-dependent and Wilcoxon rank-sum test for multiple comparisons. Abbreviations: nAMD: neovascular AMD; iAMD: intermediate AMD; MPN: myeloproliferative neoplasms; MPNd: Patients with MPN and drusen; MPNn: patients with MPN and normal retinas; Naïve: naïve T cells; CM: central memory T cells; EM: effector memory T cells; EMRA: effector memory CD45Ra+ T cells.
T cell differentiation
We investigated the T cell differentiation profile (Naïve-, CM, EM, and EMRA T cells) in all groups (Figure 2A and 2B). We found a statistically significant difference in the distribution of EM T cells in both the CD4 and CD8 T cell compartment. In MPNn patients, EM cells accounted for 15% (IQR: 12–18) of the total CD4+ cells, significantly lower than 22% (IQR: 19–26) in MPNd (p = 0.023), 23% (IQR: 16–30) in iAMD (p = 0.023), and 22% (IQR: 17–28) in nAMD patients (p = 0.017). The same was observed for CD8 T cells where EM cells comprised 23% (IQR: 14–31) of CD8 T cells in MPNn compared to 29% (IQR: 21–35) in MPNd (p = 0.030) 35% (IQR: 20–42) in iAMD (p = 0.0070) and 28% (IQR: 23–35) in nAMD patients (p = 0.025).
Costimulatory markers CD27 and CD28 and CD56+ expression
Although there was a tendency for MPNn patients to lose less of the differentiation markers CD27 and CD28 compared to the other groups, the differences were not statistically significant (Figure 2C).
We did not observe any differences in the expression of the aging marker CD56 between any of the groups (Figure 2D).
MPN biological continuum
We investigated differences in the biological continuum in MPNs from ET to PV to PMF (Figure 3).
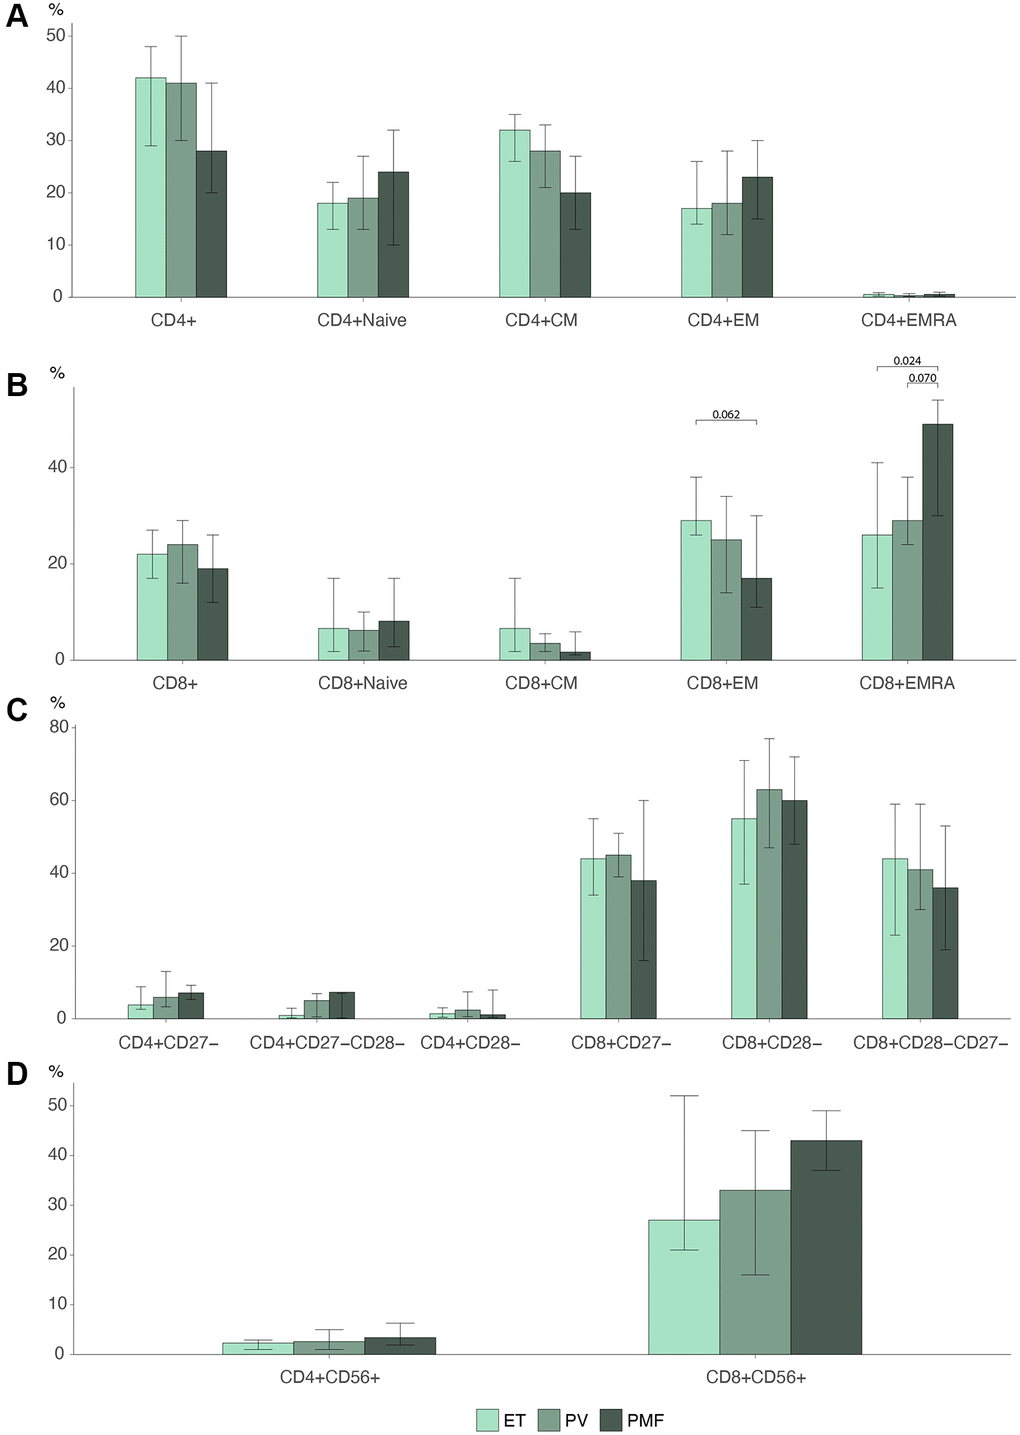
Figure 3. Barplots MPN subtypes of (A) CD4 T cell differentiation profile (B) CD8 T cell differentiation profile. (C) Loss of costimulatory markers in CD4 and CD8 T cells. (D) CD56 expression in CD4 and CD8 cells Statistically significant p-values are shown above bar plots. Statistical comparisons between groups: Kruskal Wallis test or robust linear regression if the outcome were age-dependent and Wilcoxon rank-sum test for multiple comparisons. Abbreviations: ET: essential thrombocythemia; PV: polycythemia vera; PMF: primary myelofibrosis; Naïve: naïve T cells; CM: central memory T cells; EM: effector memory T cells; EMRA: effector memory CD45Ra+ T cells.
The lymphocyte percentage decreased over the biological continuum. ET patients had 11% (CI: 9.4–13) lymphocytes compared to 8.9% (CI: 7.6–10) in PV patients (p = 0.043) and 6.7% (CI: 4.4–10) in PMF patients (p = 0.022) (data not shown). PMF patients had a percentage of terminally differentiated EMRA cells in the CD8 compartment of 49% (IQR: 30–54), significantly higher than 26% (IQR: 15–41) in ET patients (p = 0.024) and near significantly higher than 29% (IQR: 24–38) in PV patients (p = 0.070) (Figure 3B). We found no significant differences in the CD4 compartment (Figure 3A). PMF patients correspondingly seemed to have a lower percentage of EM cells, 17% (IQR: 11–30), than PV 25% (IQR: 14–34) (p = 0.22) and ET 26% (IQR: 26–38) (p = 0.062), but this was not statistically significant.
The expression of CD56 seemed to rise over the biological continuum (Figure 3D), but this was not statistically significant (CD4 p = 0.38, CD8 p = 0.19). There were no differences between the groups in the loss of differentiation markers CD27 and CD28 (Figure 3C).
Immunosenescence plots
To visualize our results, we created radar plots of the different T cell subsets and differentiation markers to evaluate the resemblance among groups further. MPNn patients stood out in most plots compared to the other groups (Figure 4). The MPNd, AMD, and iAMD patients seemed to have a more senescent profile, with more loss of costimulatory markers, higher CD56 expression, and more terminally differentiated T cells. In Figure 5, we compare MPN subtypes. ET and PV patients looked more alike with minor shape changes, but PMF patients stood out with a more senescent profile.
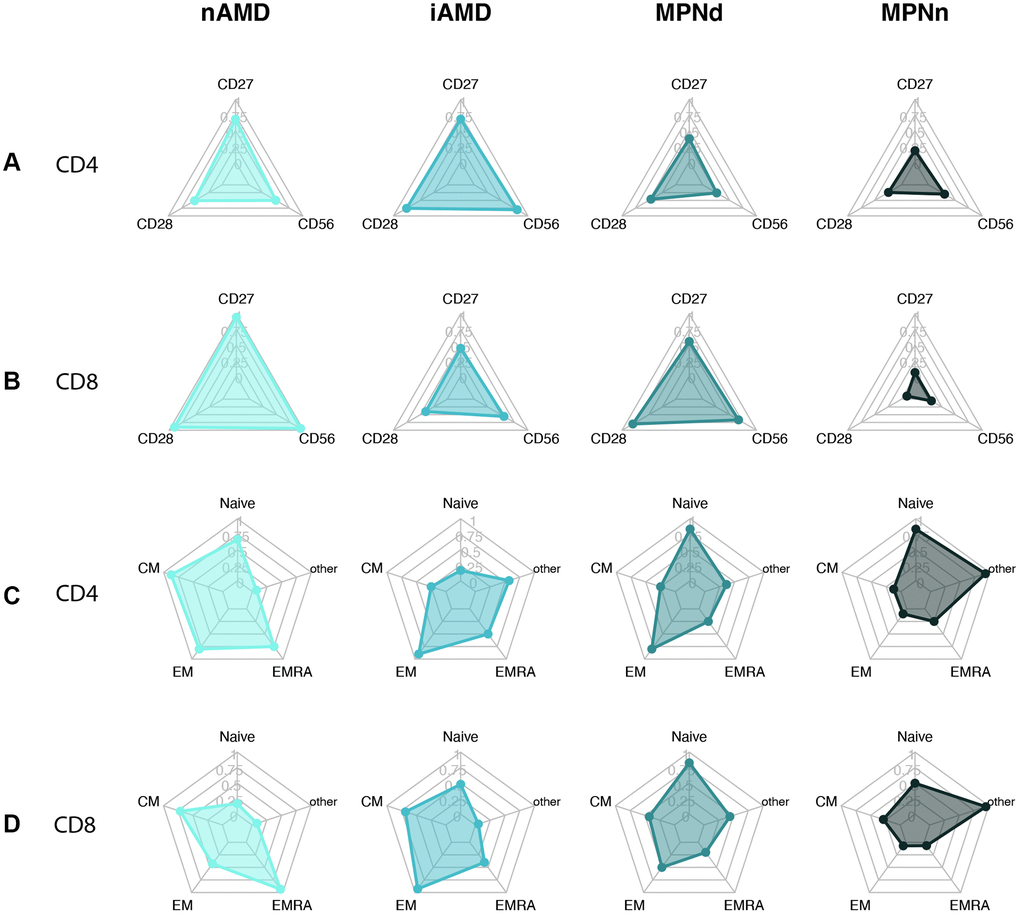
Figure 4. Radarplots of (A) CD4+ T cell with loss of CD27 and CD28 and CD56 expression. (B) CD8+ T cell with loss of CD27 and CD28 and CD56 expression. (C) CD4+ T cell differentiation profile. (D) CD8+ T cell differentiation profile. A more senescent profile is characterized by loss of CD27 and CD28, more CD56, and more terminally differentiated cells (EM and EMRA). Abbreviations: nAMD: neovascular AMD; iAMD: intermediate AMD; MPN: myeloproliferative neoplasms; MPNd: Patients with MPN and drusen; MPNn: patients with MPN and normal retinas Naïve: naïve T-cells; CM: central memory T cells; EM: effector memory T cells; EMRA: effector memory CD45Ra positive T cells; other: includes intermediate subsets of T cells not belonging to Naïve, CM, EM, or EMRA.
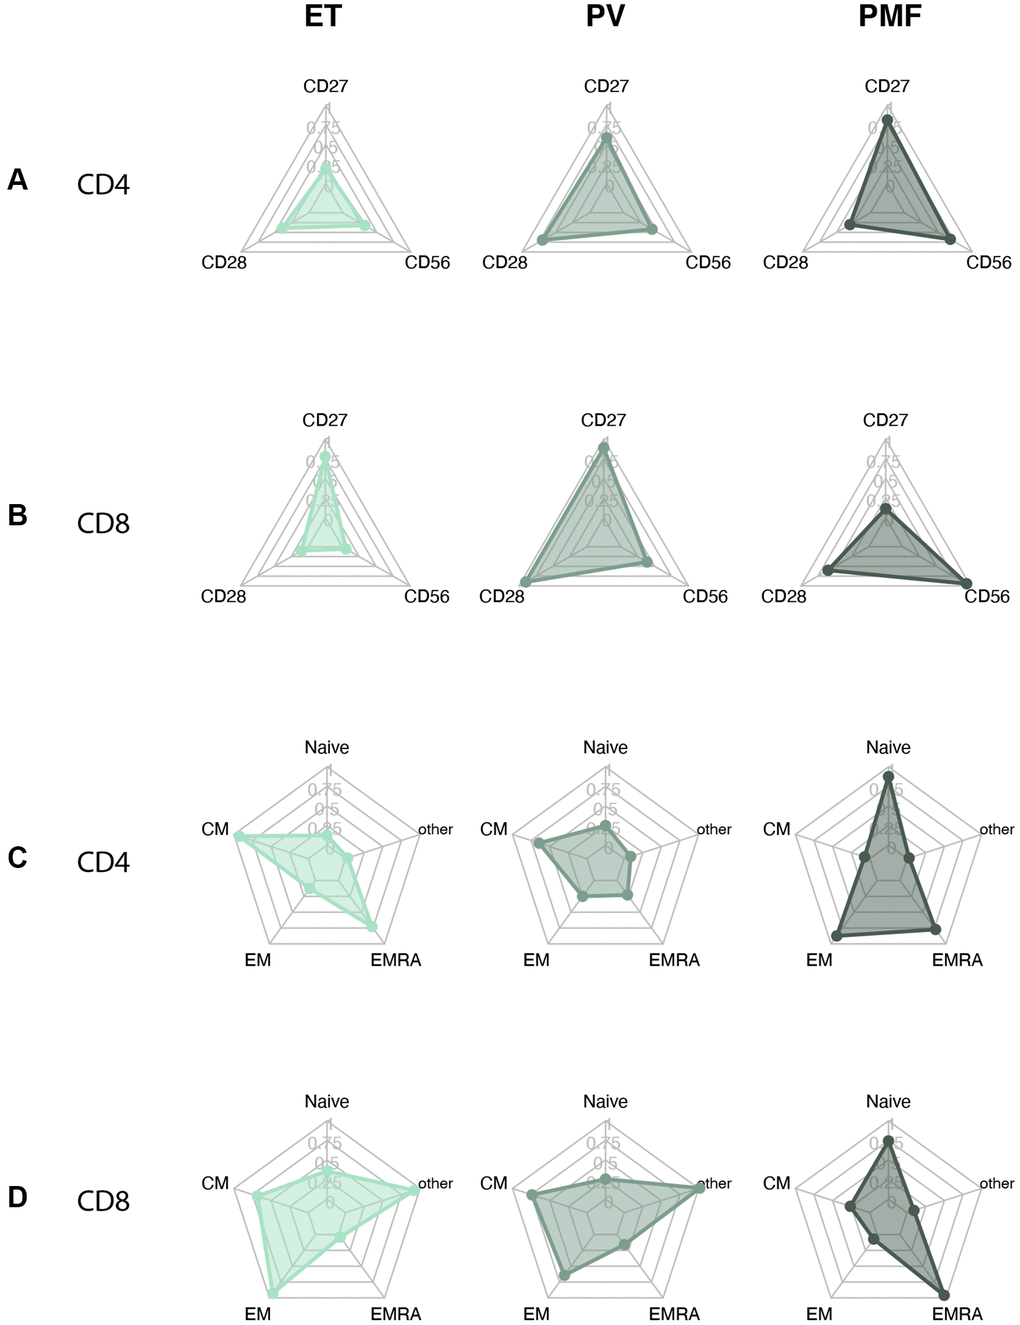
Figure 5. Radarplots MPN subtypes of (A) CD4+ T cell with loss of CD27 and CD28 and CD56 expression. (B) CD8+ T cell with loss of CD27 and CD28 and CD56 expression. (C) CD4+ T cell differentiation profile. (D) CD8+ T cell differentiation profile. A more senescent profile is characterized by loss of CD27 and CD28, more CD56, and more terminally differentiated cells (EM and EMRA). Abbreviations: ET: essential thrombocythemia; PV: polycythemia vera; PMF: primary myelofibrosis. Naïve: naïve T-cells; CM: central memory T cells; EM: effector memory T cells; EMRA: effector memory CD45Ra positive T cells; other: includes intermediate subsets of T cells not belonging to Naïve, CM, EM, or EMRA.
Discussion
Age-related macular degeneration is a common and debilitating disease affecting millions worldwide. Today treatment for nAMD is regular anti-vascular endothelial growth factor eye injections, which may slow the disease and prevent further vision loss. We have no treatment options for the early- or intermediate stages of AMD or the late atrophic form, GA. A better understanding of the underlying disease mechanisms can lead us to new target areas aiding the development of new therapies. Especially information on drusen pathophysiology would be of great importance and may eventually lead to treatment options for the disease in earlier stages.
We have investigated the immune systems of patients with MPNs because they have an increased prevalence of drusen and late AMD [14]. We have published several differences between MPN patients with and without drusen. The MPNd have a higher level of CLI and signs of a dysregulated complement system [9]. In this study, we investigated immunosenescence markers, and the results suggest that MPNd have accelerated T cell differentiation with more effector T cells than MPNn and a similar differentiation profile to AMD and iAMD patients. We observed a tendency for a smaller loss of costimulatory markers in MPNn, but the results were not statistically significant. The CD56 expression on CD28 negative cells has previously been found to be increased in patients with AMD compared to healthy individuals [28]. We found no difference in the expression of the NKR CD56 between the groups. However, the increase in CD56 expression plateaus in the seventh decade of life. All the groups’ median ages were at the end of the seventh- or in the eighth decade and could explain the similar CD56 expression [22]. Finally, we also observed a smaller percentage of CD8 T cells in patients with MPN than AMD patients, which may reflect accelerated immune aging in these patients, since the overall CD8 T cell reservoir decreases with age [29].
One of the most notable and recognized changes with age is the depletion of the CD8 naïve T cell pool while the memory T cell pool increase [19]. After thymic involution around puberty, the thymic output of naïve T cells progressively declines, and the cells are hereafter maintained primarily by proliferation from the existing pool [20, 30]. The naïve CD4 T cell pool number remains relatively stable during adulthood, but a similar accumulation of memory and effector cells occurs for these cells too, although later in life than for the CD8 compartment [20, 21].
Naïve T cells are activated and differentiate to become central memory or effector memory cells. We define the differentiated cells according to their markers (CD45Ra, CD45Ro, and CCR7) [21, 31, 32] and function (Figure 1). Differentiated cells also gradually lose the costimulatory molecules CD27 and CD28, which play an important part in T cell activation, such as cytokine production and stimulating cell proliferation [21, 27, 33, 34]. The CD8 cells lose CD28 first and then CD27, while the opposite is the case for CD4 cells, which lose CD27 first, followed by CD28 loss [21]. Further, the upregulation of cytolytic activity and markers commonly associated with NK cells are seen, giving the cells a cytotoxic capability. One example is CD56, as investigated in this study, one of the best-described markers of T cell aging [22–25].
Evidence indicates that senescent T cells are synonymous with effector T cells [16–18]. So, with age, senescent T cells accumulate [19–21]. DNA damage due to stress factors as oxidative- and replicative stress and the following repair mechanisms can induce senescence [35, 36]. Also, infection and inflammation drive T cells to senescence [37], and CLI is associated with progressive T cell differentiation [21]. An example of an infection that drives CD8 senescent cells to accumulate is cytomegalovirus (CMV) [38], and seropositivity for CMV is interestingly also associated with an increased risk of AMD [39].
Senescent cells do not proliferate but are active and secrete cytokines, chemokines, and cytotoxic granules referred to as the senescence-associated secretory phenotype (SASP) initially established in fibroblast but also shown in other cells, including T cells [16, 40, 41]. The SASP is thought to play a role in driving inflammaging [42]. The cells acquiring SASP may also be beneficial in preventing, for instance, cancer but can also become dysregulated and accelerate inflammaging [43]. The characteristics of senescent T cells are highly inflammatory and cytotoxic cells that secrete cytotoxic mediators and may damage healthy tissue [27]. Senescent cell accumulation may underlie many age-related diseases such as cardiovascular- [44–46], autoimmune- [47], and neurodegenerative diseases [48, 49].
Interestingly, lymphocytes, including CD8 T cells, have been observed in the choroid of eyes from AMD patients [50–52], and CD8 positive cells are more abundant in the macular choroid of patients with drusen [50]. In this study, the finding of increased effector cells in MPNd could be supportive of a role of CD8 T cells in the drusen/AMD pathogenesis. We do not know, though, if the increase in CD8+ T effector cells preceded the appearance of drusen or is a result of drusen presence. Either way, the presence of CD8 effector cells could potentially harm the choroid and, hereafter, the BM, RPE, and photoreceptors. Previous studies have shown that activated T-cells can modify the chemokine profile [53] and upregulate complement factor expression [54] of the RPE. The RPE constitutes the outer layer of the blood-retina barrier and plays an essential role in ocular immune regulation and retinal homeostasis. This T cell-mediated modification could lead to different effects, for example, chemotaxis, adhesion, and activation of different cells, such as monocytes and resident ocular microglia.
A hypothesis could be that the combined effect of inflammation and T cell differentiation (accelerated immune aging) initiate drusen. T cells are attracted to the site of tissue damage, inducing further secretion of cytotoxic and pro-inflammatory molecules generating a self-maintaining positive feedback loop. The results in our study indicate that the patients with drusen are the ones with the higher CLI and are the ones with the most accelerated immune aging. These findings could indicate that CLI, accelerated immune aging, or both factors combined could trigger drusen formation or speed the accumulation of debris in the BM.
In a previous study, we found that the RPE-BM complex was significantly thicker in patients with MPNs than an older healthy control group, indicating that the MPN patients accumulated debris and BM thickening earlier, which could be due to their elevated CLI and/or accelerated immune aging. Other factors that induce a pro-inflammatory milieu such as smoking or atherosclerosis and cardiovascular disease also increase the risk of AMD and could therefore be supportive of systemic inflammation being able to initiate drusen formation [1, 55]. The accumulation of chronic inflammatory episodes during a lifetime and how the host’s immune system can control the inflammatory processes may explain why some people develop AMD. The MPN patients show massive inflammation over a longer period and may, as a result, develop drusen.
We also evaluated the MPN biological continuum from early cancer stage ET, over PV, to the advanced PMF stage. In the CD8 compartment, patients with PMF had a significantly higher percentage of terminally differentiated EMRA cells compared to both ET and near significant compared to PV, indicating an increasing senescent profile over the continuum. This fits well with our previous finding of increasing CLI over the continuum [9]. We also observed a tendency to lose costimulatory markers and increased CD56 expression over the continuum, but the results were not statistically significant. This tendency was also observed in the radar plots of the biological continuum, and the PMF patient plots stood more out compared to especially ET patients but also PV patients in some of the plots. Better powered studies could investigate this.
For the MPNs, a concept considers CLI as a trigger and driver of disease development and progression and substantiates the need for early treatment intervention to dampen CLI [56]. This dampening of inflammation may be beneficial as a treatment for AMD patients, potentially decreasing the possible inflammation-driven drusen development and T cell differentiation.
Being an observational study, we can only guess on causality, and further studies using experimental methods are needed.
In conclusion, this and our previous studies suggest that MPNd patients show signs of altered innate immunity (elevated CLI and complement dysregulation) as well as adaptive immunity (accelerated T cell differentiation – more effector T cells/senescent T-cells). These findings may implicate that CLI and senescent T cells play a role in AMD pathogenesis by triggering drusen formation.
Methods
Study design and participants
The participants in this cross-sectional study consisted of the same participants as in our recent work, and the description of the methods in this study will be very similar [9]. We included 29 patients with nAMD, 28 with intermediate AMD (iAMD) [57], and 65 patients with MPNs [58] between July 2018 and November 2020. The MPN participants consisted of two groups, 35 MPNd patients (with drusen corresponding to early or intermediate AMD) and 27 with MPNn. Each participant provided written and oral informed consent after thorough information about the study. The Ethics Committee in Region Zealand, Denmark approved the study, and we adhered to the Helsinki declaration’s tenets. We carried out the study at Zealand University Hospital (ZUH) in Roskilde, and we included and examined patients at the ophthalmology and hematology departments.
The exclusion criteria consisted of patients with other active cancer, inflammatory- or autoimmune diseases, patients receiving immunomodulating treatment (Ruxolitinib, interferon-α), CRP levels >15, and VEGF inhibition therapy within the last eight weeks.
Retinal imaging and clinical data
The patients had their pupils dilated with tropicamide 1% before obtaining a stereoscopic 45°C color fundus photograph centered on the macula (model TRG-NW8, Topcon). The digital color images were used to identify drusen and determine the patients’ AMD status, using a simplified version of the Wisconsin age-related maculopathy grading system (WARMGS) [14, 59]. Each participant answered a questionnaire about their health status, medication, and lifestyle.
Blood sampling and flow cytometry
For flow cytometric analyses, we collected venous blood from antecubital veins in ethylenediaminetetraacetic-acid-coated (EDTA) tubes. The same investigator (C.L.) collected blood samples from all patients and performed flow cytometry- cell preparation and analysis within four hours. Leukocyte count was obtained with a Sysmex KX-21NTM (Sysmex Corporation). We obtained 1.0 × 10⁶ leukocytes in the test tube and lysed erythrocytes with a 1% lysis buffer (Nordic BioSite AB). We washed and centrifuged (5 min at 500 × g) the leukocytes three times with BD FACS Flow isotonic buffer (BD Biosciences), and cells were resuspended in isotonic buffer. Hereafter, monoclonal antibodies were added, and cells were incubated for 20 min in the dark at room temperature. Antibodies and fluorochrome-matched negative isotype controls were from R&D Systems; Peridinin-chlorophyll-protein (PerCP) CD4 IgG2a (FAB3791C), Fluorescein Isothiocyanate (FITC) IgG2a (IC0041F); From BioLegend; Phycoerythrin(PE)/Cyanine7(Cy7) CD8a IgG1 κ (300914), Brilliant Violet V510 CCR7 IgG2a (353232), Allophycocyanin (APC) CD56 IgG1 κ (318332), Pacific Blue CD45Ra IgG2b (304123), APC CD28 IgG1 (302912), PE CD27 IgG1 (356406), Brilliant Violet V510 IgG2a (400268), PE/Cy7 IgG1 (400126), APC/Cy7 IgG1 (400128), Pacific Blue IgG2b (400331), APC IgG1 (400120), PerCP IgG2a κ (400250); From Bio-Rad FITC CD45Ro IgG2a (MCA461FT); From BD Biosciences PE IgG1 κ (555749). The fluorochrome-matched negative isotype controls were used for each antibody to identify unspecific binding and were set to a threshold of 1%. In the last step, we washed the stained cells, resuspended them in isotonic buffer, and immediately analyzed them on a flow cytometer (BD FACSCanto II; BD Biosciences). The gating size was 100,000 singlet leukocytes. We used Kaluza Analysis (Kaluza Analysis v. 2.1; Beckman Coulter) to analyze flow data and estimated singlet leukocytes with forward scatter cell height vs. area. We used forward/side scatter area plots to gate lymphocytes and the markers CD4 and CD8 to differentiate CD4+ T cells and CD8+ T cells. Finally, we used the CD45Ra, CD45Ro, CCR7, CD27, CD28, and CD56 expressions and the Boolean function in Kaluza to analyze T cell differentiation, loss of differentiation markers, and CD56 expression.
Statistical analysis
For data analysis, we used RStudio version 4.1.1. Normally distributed data are shown as mean and 95% confidence interval (CI), non-normal data as median and interquartile range (IQR). We assessed data for normality with histograms and QQ-plots, and we used linear regression or robust linear regression to assess if outcomes were age-dependent. Group comparisons were analyzed for continuous variables with the independent samples t-test, Wilcoxon’s rank-sum test, One-way analysis of variance (ANOVA), or Kruskal Wallis test. For categorical values, we used the Chi-squared test or Fisher’s Exact test. Power calculations were based on previous similar immunologic studies of patients with nAMD, with an alpha level of 0.05, a power of 80%, and an effect size of 20%, resulting in a sample size of a minimum of 26 in each group [60, 61]. P-values less than 0.05 were considered statistically significant.
Author Contributions
Conceptualization, C.L., T.L.S., H.C.H., V.S., and L.S.; Methodology, C.L., T.L.S., and H.C.H.; Investigation, C.L. with help from V.S., L.S. (mutant allele burden data); Formal Analysis, C.L.; Visualization, C.L.; Writing – Original Draft: C.L.; Writing – Review and Editing, C.L., T.L.S., H.C.H., V.S., and L.S.; Funding Acquisition, C.L. with help from T.L.S.; Resources, C.L.; Supervision, T.L.S. and H.C.H.
Acknowledgments
The first author CL is a Ph.D. candidate at the University of Copenhagen (UCPH) and would like to thank “Fight for Sight, Denmark” and Region Zealand’s Research Promotion Fund for funding her Ph.D. This work submitted is a partial requirement for a Ph.D. at UCPH. The sponsors are public and non-profit organizations. They had no role in the study's design and conduct; collection, analysis, and interpretation of the data; preparation, review, or approval of the manuscript; or the decision to submit the manuscript for publication. HCH reports grants from Novartis, outside the submitted work.
Conflicts of Interest
The authors declare no conflicts of interest related to this study.
Funding
The corresponding author’s Ph.D., including this work, was funded by Fight for Sight, Denmark, and Region Zealand’s research promotion fund. The sponsors are public and non-profit organizations. They had no role in the study's design and conduct; collection, analysis, and interpretation of the data; preparation, review, or approval of the manuscript; or the decision to submit the manuscript for publication.
References
- 1. Chakravarthy U, Wong TY, Fletcher A, Piault E, Evans C, Zlateva G, Buggage R, Pleil A, Mitchell P. Clinical risk factors for age-related macular degeneration: a systematic review and meta-analysis. BMC Ophthalmol. 2010; 10:31. https://doi.org/10.1186/1471-2415-10-31 [PubMed]
- 2. Wong WL, Su X, Li X, Cheung CM, Klein R, Cheng CY, Wong TY. Global prevalence of age-related macular degeneration and disease burden projection for 2020 and 2040: a systematic review and meta-analysis. Lancet Glob Health. 2014; 2:e106–16. https://doi.org/10.1016/S2214-109X(13)70145-1 [PubMed]
- 3. Mitchell P, Liew G, Gopinath B, Wong TY. Age-related macular degeneration. Lancet. 2018; 392:1147–59. https://doi.org/10.1016/S0140-6736(18)31550-2 [PubMed]
- 4. Abdelfattah NS, Zhang H, Boyer DS, Rosenfeld PJ, Feuer WJ, Gregori G, Sadda SR. Drusen Volume as a Predictor of Disease Progression in Patients With Late Age-Related Macular Degeneration in the Fellow Eye. Invest Ophthalmol Vis Sci. 2016; 57:1839–46. https://doi.org/10.1167/iovs.15-18572 [PubMed]
- 5. Chew EY, Clemons TE, Agrón E, Sperduto RD, Sangiovanni JP, Davis MD, Ferris FL
3rd , and Age-Related Eye Disease Study Research Group. Ten-year follow-up of age- related macular degeneration in the age-related eye disease study: AREDS report no. 36. JAMA Ophthalmol. 2014; 132:272–7. https://doi.org/10.1001/jamaophthalmol.2013.6636 [PubMed] - 6. López-Otín C, Blasco MA, Partridge L, Serrano M, Kroemer G. The hallmarks of aging. Cell. 2013; 153:1194–217. https://doi.org/10.1016/j.cell.2013.05.039 [PubMed]
- 7. Khan KN, Mahroo OA, Khan RS, Mohamed MD, McKibbin M, Bird A, Michaelides M, Tufail A, Moore AT. Differentiating drusen: Drusen and drusen-like appearances associated with ageing, age-related macular degeneration, inherited eye disease and other pathological processes. Prog Retin Eye Res. 2016; 53:70–106. https://doi.org/10.1016/j.preteyeres.2016.04.008 [PubMed]
- 8. Rozing MP, Durhuus JA, Krogh Nielsen M, Subhi Y, Kirkwood TB, Westendorp RG, Sørensen TL. Age-related macular degeneration: A two-level model hypothesis. Prog Retin Eye Res. 2020; 76:100825. https://doi.org/10.1016/j.preteyeres.2019.100825 [PubMed]
- 9. Liisborg C, Skov V, Kjær L, Hasselbalch HC, Sørensen TL. Patients with MPNs and retinal drusen show signs of complement system dysregulation and a high degree of chronic low-grade inflammation. EClinicalMedicine. 2021. [Epub ahead of print]. https://doi.org/10.1016/j.eclinm.2021.101248
- 10. Andersen M, Sajid Z, Pedersen RK, Gudmand-Hoeyer J, Ellervik C, Skov V, Kjær L, Pallisgaard N, Kruse TA, Thomassen M, Troelsen J, Hasselbalch HC, Ottesen JT. Mathematical modelling as a proof of concept for MPNs as a human inflammation model for cancer development. PLoS One. 2017; 12:e0183620. https://doi.org/10.1371/journal.pone.0183620 [PubMed]
- 11. Barosi G, Rosti V, Bonetti E, Campanelli R, Carolei A, Catarsi P, Isgrò AM, Lupo L, Massa M, Poletto V, Viarengo G, Villani L, Magrini U. Evidence that prefibrotic myelofibrosis is aligned along a clinical and biological continuum featuring primary myelofibrosis. PLoS One. 2012; 7:e35631. https://doi.org/10.1371/journal.pone.0035631 [PubMed]
- 12. Spivak JL. Myeloproliferative Neoplasms. N Engl J Med. 2017; 376:2168–81. https://doi.org/10.1056/NEJMra1406186 [PubMed]
- 13. Bak M, Sørensen TL, Flachs EM, Zwisler AD, Juel K, Frederiksen H, Hasselbalch HC. Age-Related Macular Degeneration in Patients With Chronic Myeloproliferative Neoplasms. JAMA Ophthalmol. 2017; 135:835–43. https://doi.org/10.1001/jamaophthalmol.2017.2011 [PubMed]
- 14. Liisborg C, Nielsen MK, Hasselbalch HC, Sørensen TL. Patients with myeloproliferative neoplasms and high levels of systemic inflammation develop age-related macular degeneration. EClinicalMedicine. 2020; 26:100526. https://doi.org/10.1016/j.eclinm.2020.100526 [PubMed]
- 15. Subhi Y, Nielsen MK, Molbech CR, Oishi A, Singh A, Nissen MH, Sørensen TL. T-cell differentiation and CD56+ levels in polypoidal choroidal vasculopathy and neovascular age-related macular degeneration. Aging (Albany NY). 2017; 9:2436–52. https://doi.org/10.18632/aging.101329 [PubMed]
- 16. Callender LA, Carroll EC, Beal RWJ, Chambers ES, Nourshargh S, Akbar AN, Henson SM. Human CD8+ EMRA T cells display a senescence-associated secretory phenotype regulated by p38 MAPK. Aging Cell. 2018; 17:e12675. https://doi.org/10.1111/acel.12675 [PubMed]
- 17. Pereira BI, De Maeyer RPH, Covre LP, Nehar-Belaid D, Lanna A, Ward S, Marches R, Chambers ES, Gomes DCO, Riddell NE, Maini MK, Teixeira VH, Janes SM, et al. Sestrins induce natural killer function in senescent-like CD8+ T cells. Nat Immunol. 2020; 21:684–94. https://doi.org/10.1038/s41590-020-0643-3 [PubMed]
- 18. Henson SM, Lanna A, Riddell NE, Franzese O, Macaulay R, Griffiths SJ, Puleston DJ, Watson AS, Simon AK, Tooze SA, Akbar AN. p38 signaling inhibits mTORC1-independent autophagy in senescent human CD8+ T cells. J Clin Invest. 2014; 124:4004–16. https://doi.org/10.1172/JCI75051 [PubMed]
- 19. Goronzy JJ, Fang F, Cavanagh MM, Qi Q, Weyand CM. Naive T cell maintenance and function in human aging. J Immunol. 2015; 194:4073–80. https://doi.org/10.4049/jimmunol.1500046 [PubMed]
- 20. Nikolich-Žugich J. Aging of the T cell compartment in mice and humans: from no naive expectations to foggy memories. J Immunol. 2014; 193:2622–9. https://doi.org/10.4049/jimmunol.1401174 [PubMed]
- 21. Moro-García MA, Alonso-Arias R, López-Larrea C. When Aging Reaches CD4+ T-Cells: Phenotypic and Functional Changes. Front Immunol. 2013; 4:107. https://doi.org/10.3389/fimmu.2013.00107 [PubMed]
- 22. Lemster BH, Michel JJ, Montag DT, Paat JJ, Studenski SA, Newman AB, Vallejo AN. Induction of CD56 and TCR-independent activation of T cells with aging. J Immunol. 2008; 180:1979–90. https://doi.org/10.4049/jimmunol.180.3.1979 [PubMed]
- 23. Van Acker HH, Capsomidis A, Smits EL, Van Tendeloo VF. CD56 in the Immune System: More Than a Marker for Cytotoxicity? Front Immunol. 2017; 8:892. https://doi.org/10.3389/fimmu.2017.00892 [PubMed]
- 24. Vallejo AN, Mueller RG, Hamel DL
Jr , Way A, Dvergsten JA, Griffin P, Newman AB. Expansions of NK-like αβT cells with chronologic aging: novel lymphocyte effectors that compensate for functional deficits of conventional NK cells and T cells. Ageing Res Rev. 2011; 10:354–61. https://doi.org/10.1016/j.arr.2010.09.006 [PubMed] - 25. Michel JJ, Griffin P, Vallejo AN. Functionally Diverse NK-Like T Cells Are Effectors and Predictors of Successful Aging. Front Immunol. 2016; 7:530. https://doi.org/10.3389/fimmu.2016.00530 [PubMed]
- 26. Ferrucci L, Fabbri E. Inflammageing: chronic inflammation in ageing, cardiovascular disease, and frailty. Nat Rev Cardiol. 2018; 15:505–22. https://doi.org/10.1038/s41569-018-0064-2 [PubMed]
- 27. Covre LP, De Maeyer RPH, Gomes DCO, Akbar AN. The role of senescent T cells in immunopathology. Aging Cell. 2020; 19:e13272. https://doi.org/10.1111/acel.13272 [PubMed]
- 28. Faber C, Singh A, Krüger Falk M, Juel HB, Sørensen TL, Nissen MH. Age-related macular degeneration is associated with increased proportion of CD56(+) T cells in peripheral blood. Ophthalmology. 2013; 120:2310–6. https://doi.org/10.1016/j.ophtha.2013.04.014 [PubMed]
- 29. Li M, Yao D, Zeng X, Kasakovski D, Zhang Y, Chen S, Zha X, Li Y, Xu L. Age related human T cell subset evolution and senescence. Immun Ageing. 2019; 16:24. https://doi.org/10.1186/s12979-019-0165-8 [PubMed]
- 30. den Braber I, Mugwagwa T, Vrisekoop N, Westera L, Mögling R, de Boer AB, Willems N, Schrijver EH, Spierenburg G, Gaiser K, Mul E, Otto SA, Ruiter AF, et al. Maintenance of peripheral naive T cells is sustained by thymus output in mice but not humans. Immunity. 2012; 36:288–97. https://doi.org/10.1016/j.immuni.2012.02.006 [PubMed]
- 31. Larbi A, Fulop T. From "truly naïve" to "exhausted senescent" T cells: when markers predict functionality. Cytometry A. 2014; 85:25–35. https://doi.org/10.1002/cyto.a.22351 [PubMed]
- 32. Clénet ML, Gagnon F, Moratalla AC, Viel EC, Arbour N. Peripheral human CD4+CD8+ T lymphocytes exhibit a memory phenotype and enhanced responses to IL-2, IL-7 and IL-15. Sci Rep. 2017; 7:11612. https://doi.org/10.1038/s41598-017-11926-2 [PubMed]
- 33. Xu W, Larbi A. Markers of T Cell Senescence in Humans. Int J Mol Sci. 2017; 18:1742. https://doi.org/10.3390/ijms18081742 [PubMed]
- 34. Mahnke YD, Brodie TM, Sallusto F, Roederer M, Lugli E. The who's who of T-cell differentiation: human memory T-cell subsets. Eur J Immunol. 2013; 43:2797–809. https://doi.org/10.1002/eji.201343751 [PubMed]
- 35. Blackburn EH, Epel ES, Lin J. Human telomere biology: A contributory and interactive factor in aging, disease risks, and protection. Science. 2015; 350:1193–8. https://doi.org/10.1126/science.aab3389 [PubMed]
- 36. Hasselbalch HC, Thomassen M, Riley CH, Kjær L, Larsen TS, Jensen MK, Bjerrum OW, Kruse TA, Skov V. Whole blood transcriptional profiling reveals deregulation of oxidative and antioxidative defence genes in myelofibrosis and related neoplasms. Potential implications of downregulation of Nrf2 for genomic instability and disease progression. PLoS One. 2014; 9:e112786. https://doi.org/10.1371/journal.pone.0112786 [PubMed]
- 37. Fülöp T, Larbi A, Pawelec G. Human T cell aging and the impact of persistent viral infections. Front Immunol. 2013; 4:271. https://doi.org/10.3389/fimmu.2013.00271 [PubMed]
- 38. Nikolich-Žugich J, Čicin-Šain L, Collins-McMillen D, Jackson S, Oxenius A, Sinclair J, Snyder C, Wills M, Lemmermann N. Advances in cytomegalovirus (CMV) biology and its relationship to health, diseases, and aging. Geroscience. 2020; 42:495–504. https://doi.org/10.1007/s11357-020-00170-8 [PubMed]
- 39. Miller DM, Espinosa-Heidmann DG, Legra J, Dubovy SR, Sũner IJ, Sedmak DD, Dix RD, Cousins SW. The association of prior cytomegalovirus infection with neovascular age-related macular degeneration. Am J Ophthalmol. 2004; 138:323–8. https://doi.org/10.1016/j.ajo.2004.03.018 [PubMed]
- 40. Campisi J. Aging, cellular senescence, and cancer. Annu Rev Physiol. 2013; 75:685–705. https://doi.org/10.1146/annurev-physiol-030212-183653 [PubMed]
- 41. Coppé JP, Desprez PY, Krtolica A, Campisi J. The senescence-associated secretory phenotype: the dark side of tumor suppression. Annu Rev Pathol. 2010; 5:99–118. https://doi.org/10.1146/annurev-pathol-121808-102144 [PubMed]
- 42. Franceschi C, Bonafè M, Valensin S, Olivieri F, De Luca M, Ottaviani E, De Benedictis G. Inflamm-aging. An evolutionary perspective on immunosenescence. Ann N Y Acad Sci. 2000; 908:244–54. https://doi.org/10.1111/j.1749-6632.2000.tb06651.x [PubMed]
- 43. Fulop T, Larbi A, Dupuis G, Le Page A, Frost EH, Cohen AA, Witkowski JM, Franceschi C. Immunosenescence and Inflamm-Aging As Two Sides of the Same Coin: Friends or Foes? Front Immunol. 2018; 8:1960. https://doi.org/10.3389/fimmu.2017.01960 [PubMed]
- 44. Childs BG, Baker DJ, Wijshake T, Conover CA, Campisi J, van Deursen JM. Senescent intimal foam cells are deleterious at all stages of atherosclerosis. Science. 2016; 354:472–7. https://doi.org/10.1126/science.aaf6659 [PubMed]
- 45. Wu CM, Zheng L, Wang Q, Hu YW. The emerging role of cell senescence in atherosclerosis. Clin Chem Lab Med. 2020; 59:27–38. https://doi.org/10.1515/cclm-2020-0601 [PubMed]
- 46. Yu HT, Park S, Shin EC, Lee WW. T cell senescence and cardiovascular diseases. Clin Exp Med. 2016; 16:257–63. https://doi.org/10.1007/s10238-015-0376-z [PubMed]
- 47. Goronzy JJ, Weyand CM. Aging, autoimmunity and arthritis: T-cell senescence and contraction of T-cell repertoire diversity - catalysts of autoimmunity and chronic inflammation. Arthritis Res Ther. 2003; 5:225–34. https://doi.org/10.1186/ar974 [PubMed]
- 48. Saez-Atienzar S, Masliah E. Cellular senescence and Alzheimer disease: the egg and the chicken scenario. Nat Rev Neurosci. 2020; 21:433–44. https://doi.org/10.1038/s41583-020-0325-z [PubMed]
- 49. Larbi A, Pawelec G, Witkowski JM, Schipper HM, Derhovanessian E, Goldeck D, Fulop T. Dramatic shifts in circulating CD4 but not CD8 T cell subsets in mild Alzheimer's disease. J Alzheimers Dis. 2009; 17:91–103. https://doi.org/10.3233/JAD-2009-1015 [PubMed]
- 50. Penfold PL, Killingsworth MC, Sarks SH. Senile macular degeneration. The involvement of giant cells in atrophy of the retinal pigment epithelium. Invest Ophthalmol Vis Sci. 1986; 27:364–71. [PubMed]
- 51. Penfold P, Killingsworth M, Sarks S. An ultrastructural study of the role of leucocytes and fibroblasts in the breakdown of Bruch's membrane. Aust J Ophthalmol. 1984; 12:23–31. [PubMed]
- 52. Ezzat MK, Hann CR, Vuk-Pavlovic S, Pulido JS. Immune cells in the human choroid. Br J Ophthalmol. 2008; 92:976–80. https://doi.org/10.1136/bjo.2007.129742 [PubMed]
- 53. Juel HB, Faber C, Udsen MS, Folkersen L, Nissen MH. Chemokine expression in retinal pigment epithelial ARPE-19 cells in response to coculture with activated T cells. Invest Ophthalmol Vis Sci. 2012; 53:8472–80. https://doi.org/10.1167/iovs.12-9963 [PubMed]
- 54. Juel HB, Kaestel C, Folkersen L, Faber C, Heegaard NH, Borup R, Nissen MH. Retinal pigment epithelial cells upregulate expression of complement factors after co-culture with activated T cells. Exp Eye Res. 2011; 92:180–8. https://doi.org/10.1016/j.exer.2011.01.003 [PubMed]
- 55. Ambrose JA, Barua RS. The pathophysiology of cigarette smoking and cardiovascular disease: an update. J Am Coll Cardiol. 2004; 43:1731–7. https://doi.org/10.1016/j.jacc.2003.12.047 [PubMed]
- 56. Hasselbalch HC. Chronic inflammation as a promotor of mutagenesis in essential thrombocythemia, polycythemia vera and myelofibrosis. A human inflammation model for cancer development? Leuk Res. 2013; 37:214–20. https://doi.org/10.1016/j.leukres.2012.10.020 [PubMed]
- 57. Ferris FL
3rd , Wilkinson CP, Bird A, Chakravarthy U, Chew E, Csaky K, Sadda SR, and Beckman Initiative for Macular Research Classification Committee. Clinical classification of age-related macular degeneration. Ophthalmology. 2013; 120:844–51. https://doi.org/10.1016/j.ophtha.2012.10.036 [PubMed] - 58. Barbui T, Thiele J, Gisslinger H, Kvasnicka HM, Vannucchi AM, Guglielmelli P, Orazi A, Tefferi A. The 2016 WHO classification and diagnostic criteria for myeloproliferative neoplasms: document summary and in-depth discussion. Blood Cancer J. 2018; 8:15. https://doi.org/10.1038/s41408-018-0054-y [PubMed]
- 59. Klein R, Davis MD, Magli YL, Segal P, Klein BE, Hubbard L. The Wisconsin age-related maculopathy grading system. Ophthalmology. 1991; 98:1128–34. https://doi.org/10.1016/s0161-6420(91)32186-9 [PubMed]
- 60. Krogh Nielsen M, Subhi Y, Molbech CR, Falk MK, Nissen MH, Sørensen TL. Systemic Levels of Interleukin-6 Correlate With Progression Rate of Geographic Atrophy Secondary to Age-Related Macular Degeneration. Invest Ophthalmol Vis Sci. 2019; 60:202–8. https://doi.org/10.1167/iovs.18-25878 [PubMed]
- 61. Subhi Y, Krogh Nielsen M, Molbech CR, Sørensen TL. Altered proportion of CCR2+ and CX3CR1+ circulating monocytes in neovascular age-related macular degeneration and polypoidal choroidal vasculopathy. Clin Exp Ophthalmol. 2018; 46:661–9. https://doi.org/10.1111/ceo.13152 [PubMed]