


Introduction
Lung cancer accounts for 11.4% of all cancer cases worldwide, resulting in tremendous financial and medical burdens on the society each year [1]. Depending on the age of the patient or degree of tobacco exposure, lung squamous cell carcinoma (LUSC), a subtype of non-small cell lung cancer, comprises around 40% of all lung cancer cases. Currently, surgical resection, chemotherapy, radiation, targeted treatment, and immunotherapy are being used to treat lung cancer. LUSC has a poor clinical prognosis compared to lung adenocarcinoma, and only a few molecular targeted treatments are available [2, 3]. Additionally, crucial biomarkers and specific targets for LUSC prognosis remain unidentified, making it imperative to find new biomarkers and targeted medicines for improving therapeutic outcomes [4, 5].
Ten members of the MCM family, serum response factor (SRF, also known as MCM1) and MCM2–10, were initially found in Saccharomyces cerevisiae [6]. The MADS-box family of transcription factors were defined based on the primary sequence similarity among numerous proteins from a diverse range of eukaryotic organisms including yeasts, plants, insects, amphibians, and mammals [7]. By controlling the expression of cell division cycle 6 and MCM2–7 genes, MCM1, an ancient and evolutionarily conserved transcription factor in the MADS-box family, indirectly affects DNA replication [8, 9]. The MCM2–7 proteins are heterohexameric complexes that serve as primary helicases to unwind the helical structure of DNA by acting on the origins of replication [10]. MCM8 and MCM9 function as hexameric ATPase/helicase complexes that may be involved in homologous recombination repair induced by interstrand crosslinks [11]. Additionally, MCMs show potential as diagnostic and prognostic indicators, as they are overexpressed in various cancer tissues and carcinoma cell lines [12–14]. Although potential biomarkers and genes associated with LUSC are being widely examined [15, 16], the prognostic importance of the MCM family in the development of LUSC remains unclear. In this study, we used research databases and bioinformatic tools to assess the expression of MCMs in LUSC and analyze their prognostic value, which could be useful for improving treatment outcomes.
Results
Aberrant expression of MCM family members in LUSC
The Tumor Immune Estimation Resource (TIMER) database was used to examine transcriptional levels of MCMs and to compare their expression in diverse cancer types to those in healthy tissues. The mRNA expression of MCM2–10 was substantially higher in LUSC tissues than in healthy tissues, whereas MCM1 levels showed no significant difference (Figure 1A–1J). Gene Expression Profiling Interactive Analysis (GEPIA2), which contains resources distinct from those in the TIMER database, was used to further explore the mRNA expression of the MCM family genes. We found that all MCM factors, except for MCM1 and MCM9, exhibited considerably higher expression in LUSC than in normal tissues (P < 0.05) (Figure 1K).
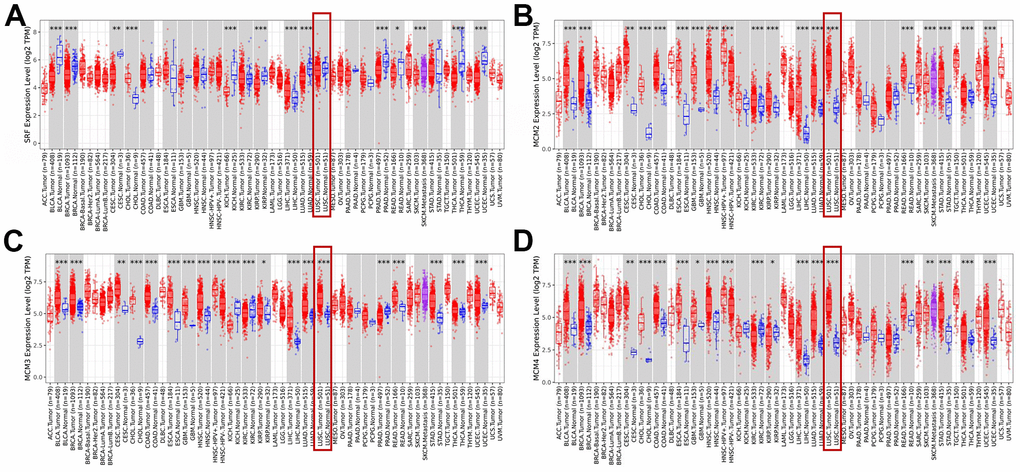
Figure 1. Expression of minichromosome maintenance (MCM) family members in lung squamous cell carcinoma (LUSC). (A–D) Expression of MCM1–10 in pan-cancer. *p < 0.05, **p < 0.01, ***p < 0.001 compared with control.
(E–J) Expression of MCM1–10 in pan-cancer. (K) Expression of MCMs in LUSC. *p < 0.05, **p < 0.01, ***p < 0.001 compared with control.
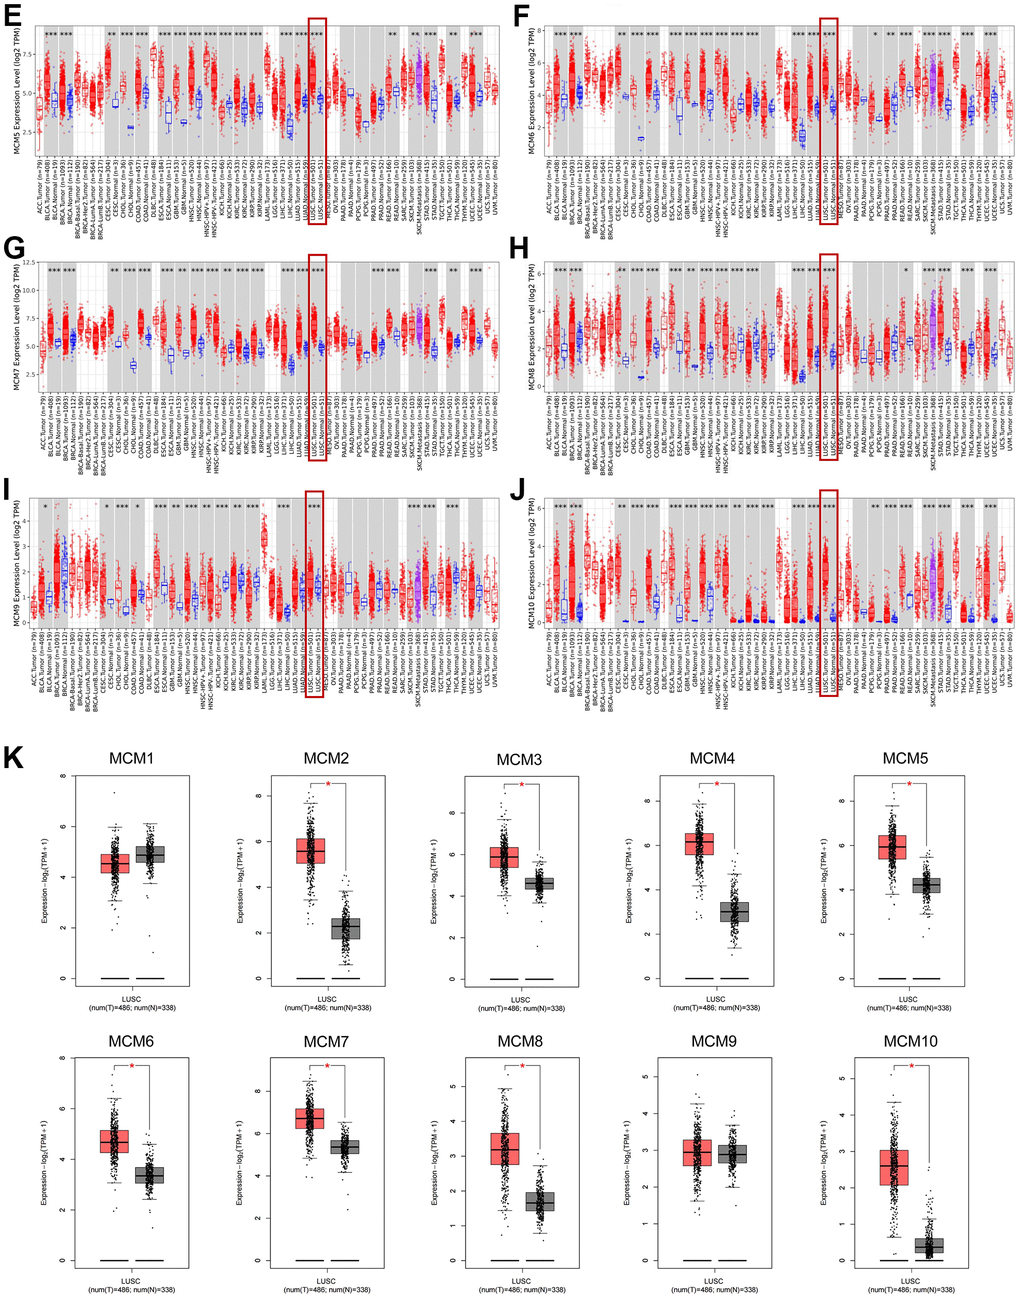
Figure 1. Expression of minichromosome maintenance (MCM) family members in lung squamous cell carcinoma (LUSC). (E–J) Expression of MCM1–10 in pan-cancer. (K) Expression of MCMs in LUSC. *p < 0.05, **p < 0.01, ***p < 0.001 compared with control.
We further investigated the results of immunohistochemical staining of MCM family members using data from the Human Protein Atlas database to evaluate the protein levels of MCMs in LUSC. Figure 2 shows that LUSC tissues expressed higher protein levels of MCM3/4/5, compared to the normal lung tissues (not detected versus medium, respectively) (Figure 2C–2E). Similar findings were observed for the protein expression levels of MCM2/6/7/10 (not detected versus high, medium versus high, not detected versus high, and low versus medium, respectively) (Figure 2F, 2I). These findings are consistent with our previous findings regarding the mRNA expression of the MCM family genes. Moreover, MCM1 was not expressed in normal lung tissues and showed medium expression in LUSC tissues (Figure 2A), whereas MCM9 showed low expression in normal tissues and medium expression in LUSC tissues (Figure 2H).
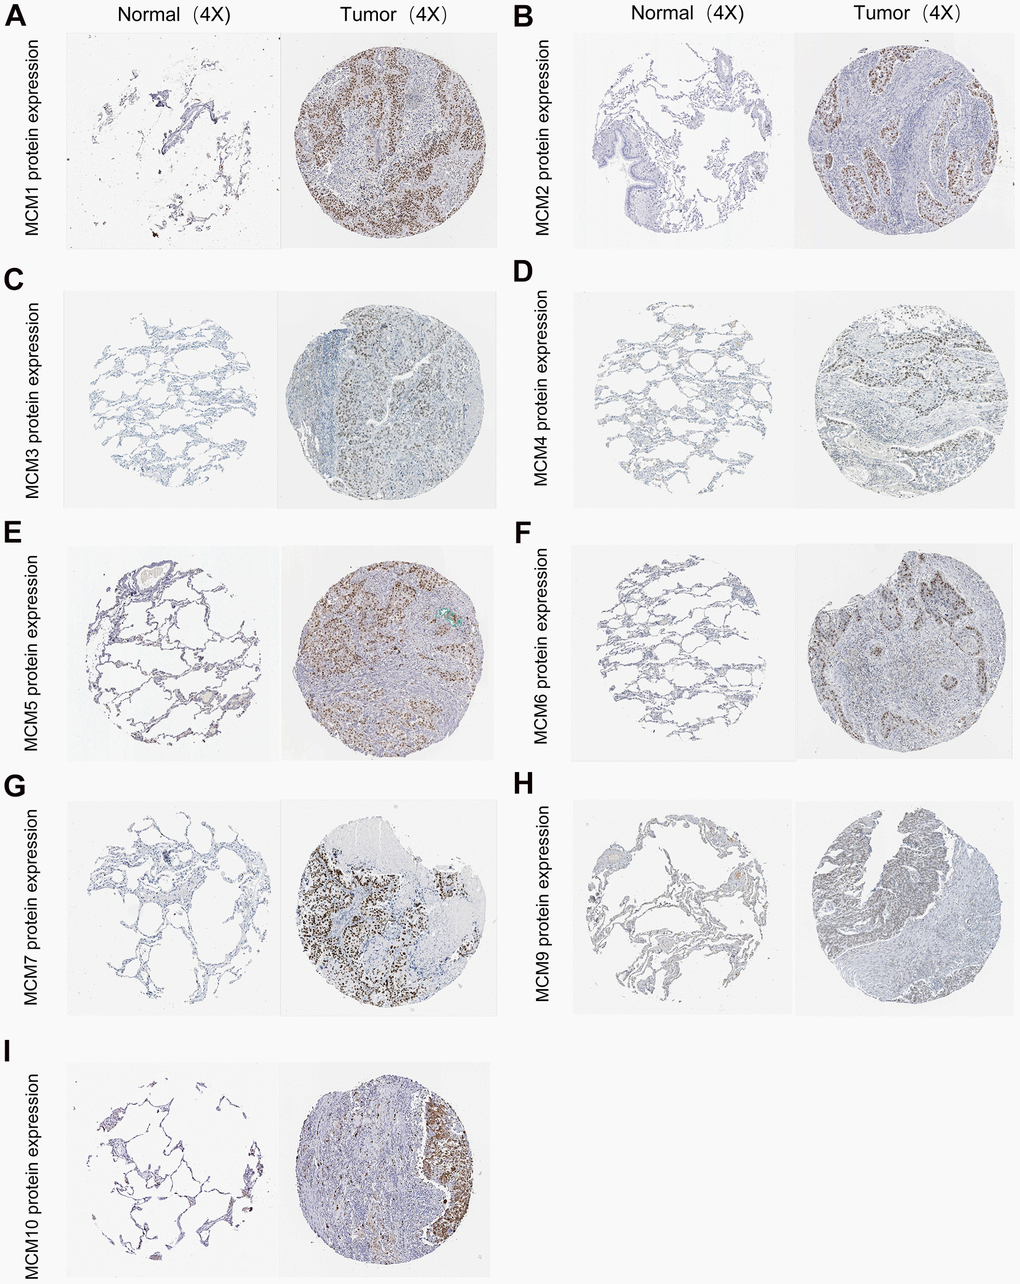
Figure 2. Typical immunohistochemistry images of minichromosome maintenance (MCM) family members. (A–I) Comparison of the expression of MCM1–10 in lung squamous cell carcinoma (LUSC) tissues with those in non-cancerous tissue (100×) using the data from the Human Protein Atlas database.
Correlation between MCM mRNA expression and clinicopathological parameters in patients with LUSC
The association between the mRNA expression of the ten MCM genes and lymph node metastases in LUSC was examined using the UALCAN database. At all stages of lymph node metastasis, the MCM2/4/6/7/10 mRNA expression in LUSC tissues were higher than those in normal tissues. Additionally, the mRNA expression of MCM3/5/8/9 tended to be higher in tumors with N0–N2 stage lymph node metastasis. At the N0–N3 stage of lymph node metastasis, MCM4/6/7/10 showed the lowest expression in N3 tumors, which significantly correlated with patient prognosis. In contrast, the expression of MCM2 was highest at N3 stage (Figure 3A). Therefore, the mRNA expression of MCM family members were significantly correlated with individual cancer stages of LUSC. The expression of eight MCM genes (excluding MCM1 and MCM9) was significantly higher in the tumor stage 1–4 subgroups than that in normal lung tissues. However, the expression of MCM9 did not differ between stage 4 LUSC tissue and normal lung tissue. In addition, MCM3/6/8/10 mRNA expression was lower in tumor stage 4 than in tumor stages 1 and 3. These findings suggest that MCMs contribute to the development of LUSC (Figure 3B).
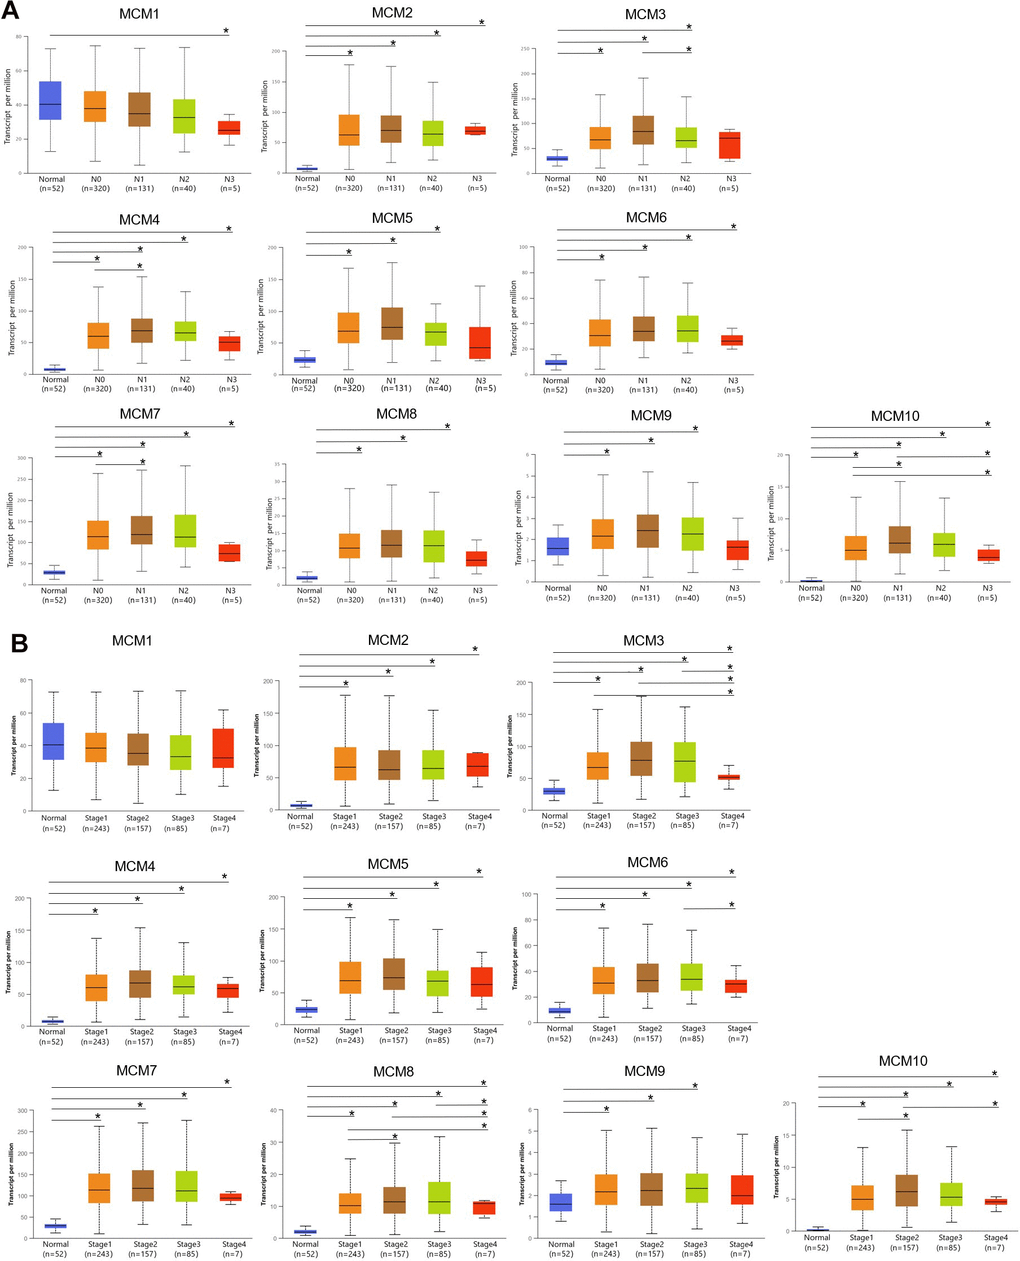
Figure 3. Correlation between clinical pathology and minichromosome maintenance (MCM) mRNA expression determined using UALCAN. (A) Association of lymph node metastases in patients with lung squamous cell carcinoma (LUSC) with MCM family mRNA expression. (B) Association of pathological stage of patients with LUSC with MCM family mRNA expression. *p < 0.05.
Prognostic value of MCM gene family in patients with LUSC
Based on mRNA expression in patients with LUSC, the prognostic value of the MCM family was assessed using the Kaplan–Meier plotter database. The clinical prognosis was determined through survival analysis considering post-progression survival (PPS), recurrence-free survival (RFS), and overall survival (OS). We found that higher mRNA expression of MCM3 [OS: hazard ratio (HR) = 0.71 (0.53–0.96), P = 0.024], MCM4 [OS: HR = 0.68 (0.5–0.93), P = 0.016], MCM5 [OS: HR = 0.72 (0.54–0.97), P = 0.029], MCM6 [OS: HR = 0.68 (0.51–0.91), P = 0.0095], MCM7 [OS: HR = 0.62 (0.46–0.82), P < 0.001], and MCM8 [OS: HR = 0.74 (0.56–0.97), P = 0.031] was associated with favorable OS in patients with LUSC and may be suitable targets for improving patient survival and prognosis (Figure 4A). Moreover, increased expression of MCM3 [RFS: HR = 1.93 (1.04–3.75), P= 0.033], MCM7 [RFS: HR = 1.82 (1.09–3.04), P = 0.021], MCM8 [RFS: HR = 2.16 (1.3–3.57), P = 0.002], and MCM10 [RFS: HR = 1.95 (1.09–3.5), P = 0.022] was significantly associated with poorer RFS in patients with LUSC (Figure 4B). Upregulation of MCM1 [PPS: HR = 1.29 (1–1.66), P = 0.049], MCM2 [PPS: HR = 1.51 (1.17–1.94), P = 0.001], MCM3 [PPS: HR = 1.36 (1.05–1.77), P = 0.020], MCM4 [PPS: HR = 1.62 (1.25–2.09), P < 0.001], MCM5 [PPS: HR = 1.45 (1.11–1.9), P = 0.007], MCM7 [PPS: HR = 1.54 (1.2–1.98), P < 0.001], and MCM9 [PPS: HR = 1.59 (1.22–2.08), P < 0.001] was significantly associated with longer PPS (Figure 4C). The mRNA expression of other MCMs had no significant effect on OS, RFS, or PPS in patients with LUSC (Figure 4). Members of the MCMs family had inconsistent results for OS, RFS, and PPS in patients with LUSC. This situation may be due to the small number of patient samples, and further studies are needed. Among the MCMs, MCM3 and MCM7 showed the most significant correlation with the clinical prognosis of LUSC, indicating the potential of MCM3 and MCM7 as prognostic markers for LUSC.
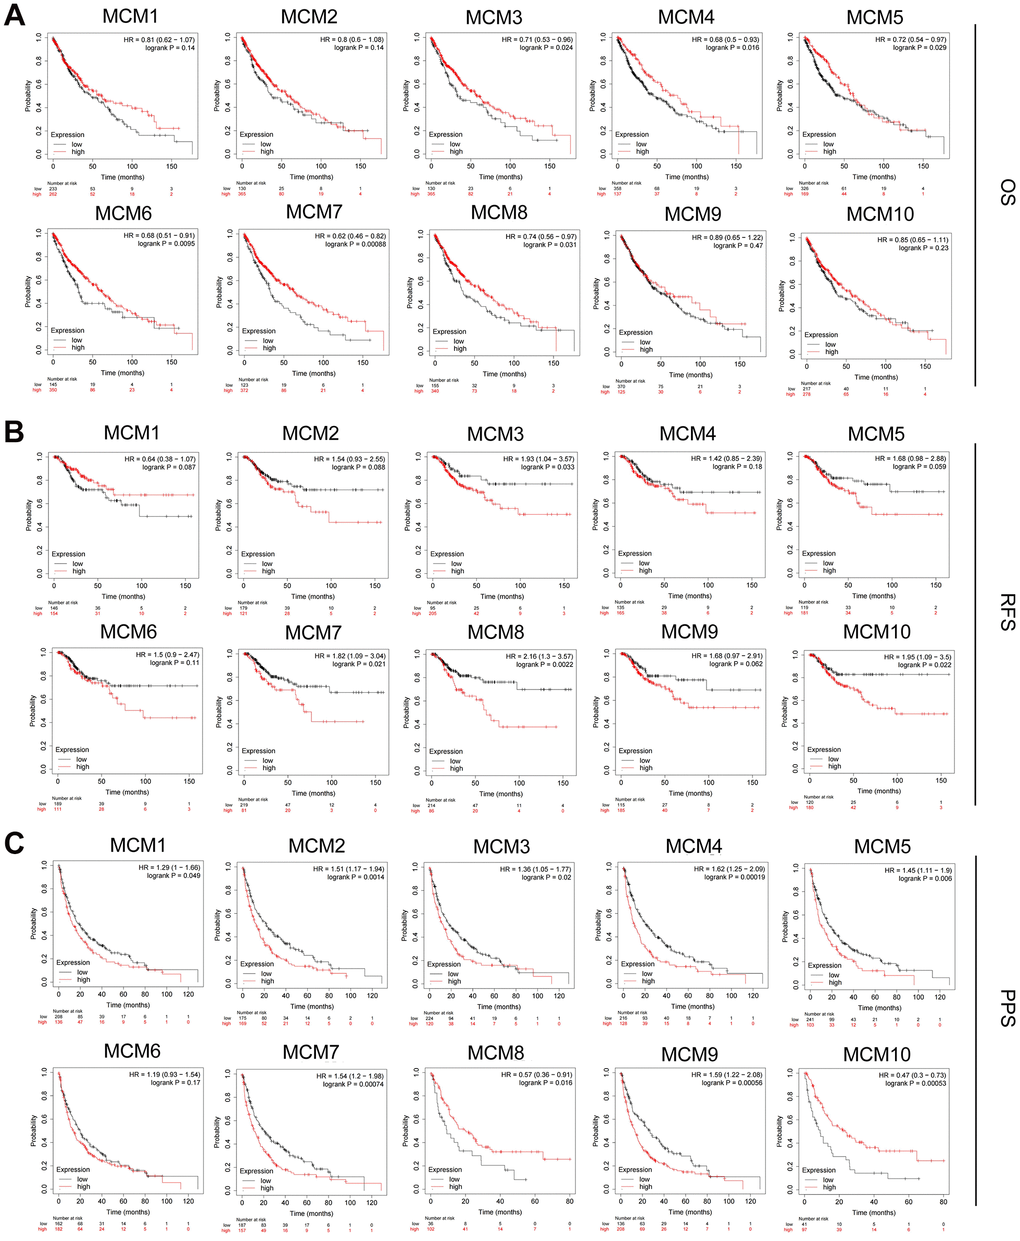
Figure 4. Prognostic value of MCM family members in lung squamous cell carcinoma (LUSC). (A–C) Association of mRNA expression of MCM family members with overall survival (OS), progression-free survival (RFS), and post-progression survival (PPS) in LUSC using Kaplan–Meier plotter database.
We further analyzed the prognostic value of the MCM family members at different clinical stages of LUSC using Kaplan–Meier plotter database (Table 1). Overexpression of MCM7 [HR = 2.44 (1.05–5.68), P = 0.033] and MCM10 [HR = 2.94 (1.17–7.37), P = 0.016] was significantly associated with a poorer RFS in patients with stage I LUSC. The mRNA expression of MCM2 [HR = 7.58 (1.61–35.66), P = 0.0028], MCM3 [P = 0.038], MCM4 [HR = 4.12 (1.2–14.1), P = 0.015], MCM5 [HR = 4.81 (1.04–22.32), P = 0.027), MCM8 (HR = 3.63 (1.09–12.09), P = 0.024], and MCM9 [HR = 6.2 (0.8–48.12), P = 0.046] was significantly associated with poorer RFS in patients with stage III LUSC. These results indicate that some MCM family members can be used as prognostic factors in LUSC, particularly for RFS prediction in patients diagnosed at an advanced stage of LUSC.
Table 1. Kaplan–Meier plotter database was used to analyze the prognostic value of MCM family members in different clinical stages of LUSC.
| Stage1 | Stage2 | Stage3 | |||||||||||||||||||||||||||||||||||||||||||||||||||||||||||||||||||||||||||||||||||||||||||||||||
| HR | P | HR | P | HR | P | ||||||||||||||||||||||||||||||||||||||||||||||||||||||||||||||||||||||||||||||||||||||||||||||
| MCM1 | 0.60 (0.27-1.35) | 0.220 | 0.37(0.14-1.01) | 0.043 | 2.48(0.74-8.30) | 0.130 | |||||||||||||||||||||||||||||||||||||||||||||||||||||||||||||||||||||||||||||||||||||||||||||
| MCM2 | 1.87(0.78-4.49) | 0.150 | 0.33(0.14-0.76) | 0.006 | 7.58(1.61-35.66) | 0.003 | |||||||||||||||||||||||||||||||||||||||||||||||||||||||||||||||||||||||||||||||||||||||||||||
| MCM3 | 0.55(0.21-1.47) | 0.230 | 1.67(0.56-4.94) | 0.350 | —— | 0.038 | |||||||||||||||||||||||||||||||||||||||||||||||||||||||||||||||||||||||||||||||||||||||||||||
| MCM4 | 2.83(0.85-9.48) | 0.077 | 0.45(0.19-1.04) | 0.054 | 4.12(1.20-14.10) | 0.015 | |||||||||||||||||||||||||||||||||||||||||||||||||||||||||||||||||||||||||||||||||||||||||||||
| MCM5 | 2.03(0.92-4.50) | 0.075 | 0.50(0.21-1.18) | 0.110 | 4.81(1.04-22.32) | 0.027 | |||||||||||||||||||||||||||||||||||||||||||||||||||||||||||||||||||||||||||||||||||||||||||||
| MCM6 | 2.19(0.94-5.10) | 0.064 | 0.38(0.16-0.87) | 0.018 | 4.57(0.57-36.66) | 0.120 | |||||||||||||||||||||||||||||||||||||||||||||||||||||||||||||||||||||||||||||||||||||||||||||
| MCM7 | 2.44(1.05-5.68) | 0.033 | 0.38(0.17-0.89) | 0.021 | 5.83(0.74-46.21) | 0.061 | |||||||||||||||||||||||||||||||||||||||||||||||||||||||||||||||||||||||||||||||||||||||||||||
| MCM8 | 1.95(0.88-4.33) | 0.093 | 0.58(0.24-1.40) | 0.220 | 3.63(1.09-12.09) | 0.024 | |||||||||||||||||||||||||||||||||||||||||||||||||||||||||||||||||||||||||||||||||||||||||||||
| MCM9 | 1.86(0.79-4.34) | 0.150 | 0.56(0.21-1.50) | 0.240 | 6.20(0.80-48.12) | 0.046 | |||||||||||||||||||||||||||||||||||||||||||||||||||||||||||||||||||||||||||||||||||||||||||||
| MCM10 | 2.94(1.17-7.37) | 0.016 | 0.61(0.23-1.65) | 0.320 | 2. 02(0.43-9.59) | 0.370 | |||||||||||||||||||||||||||||||||||||||||||||||||||||||||||||||||||||||||||||||||||||||||||||
| Bold font indicates significant difference. | |||||||||||||||||||||||||||||||||||||||||||||||||||||||||||||||||||||||||||||||||||||||||||||||||||
Genetic alterations and functional enrichment analysis of MCM family members
Genetic alterations are well-known to be major factors influencing cancer development. We determined the methylation levels of MCM genes in patients with LUSC using the UALCAN database. The DNA methylation levels of MCM3/5/6/8 were significantly lower in LUSC samples than in normal tissues, whereas those of MCM1/2/4/7/10 were significantly higher. Other MCM family members showed no significant differences between normal and cancer tissues (Figure 5). Variations in the methylation levels of MCM genes may have been caused by differences in their mRNA expression. Thus, DNA methylation-targeting drugs may be useful for treating cancer.
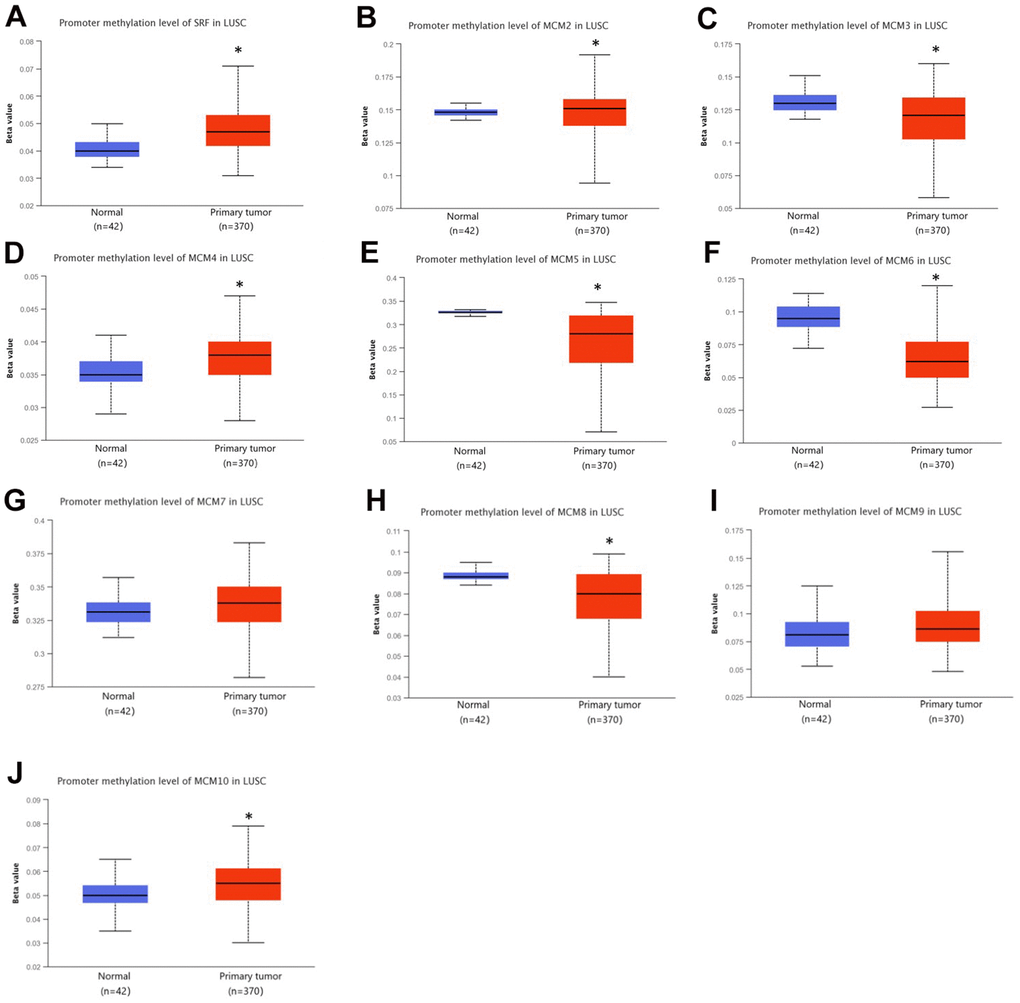
Figure 5. DNA methylation levels of minichromosome maintenance (MCM) family genes in lung squamous cell carcinoma (LUSC). (A–J) DNA methylation change of MCM1–10 in LUSC investigated using the UALCAN database. *p < 0.05 compared with control.
In addition, we used the cBioPortal database to conduct a series of studies to verify the status of genetic alterations in the MCM family. We found that 80 of 178 samples (45%) contained alterations in MCM genes, with MCM2 showing the largest proportion of alterations (15%). The two most prevalent genetic changes in the MCM family were mRNA upregulation and amplification (Figure 6A). Next, we identified co-expressed genes with threshold values of |log2 fold-change| ≥ 0.45 and P < 0.05 using the cBioPortal database (Supplementary Table 1) and used Cytoscape v.3.9.0 to generate a map of the co-expression networks of key genes related to the MCM family (Figure 6B).
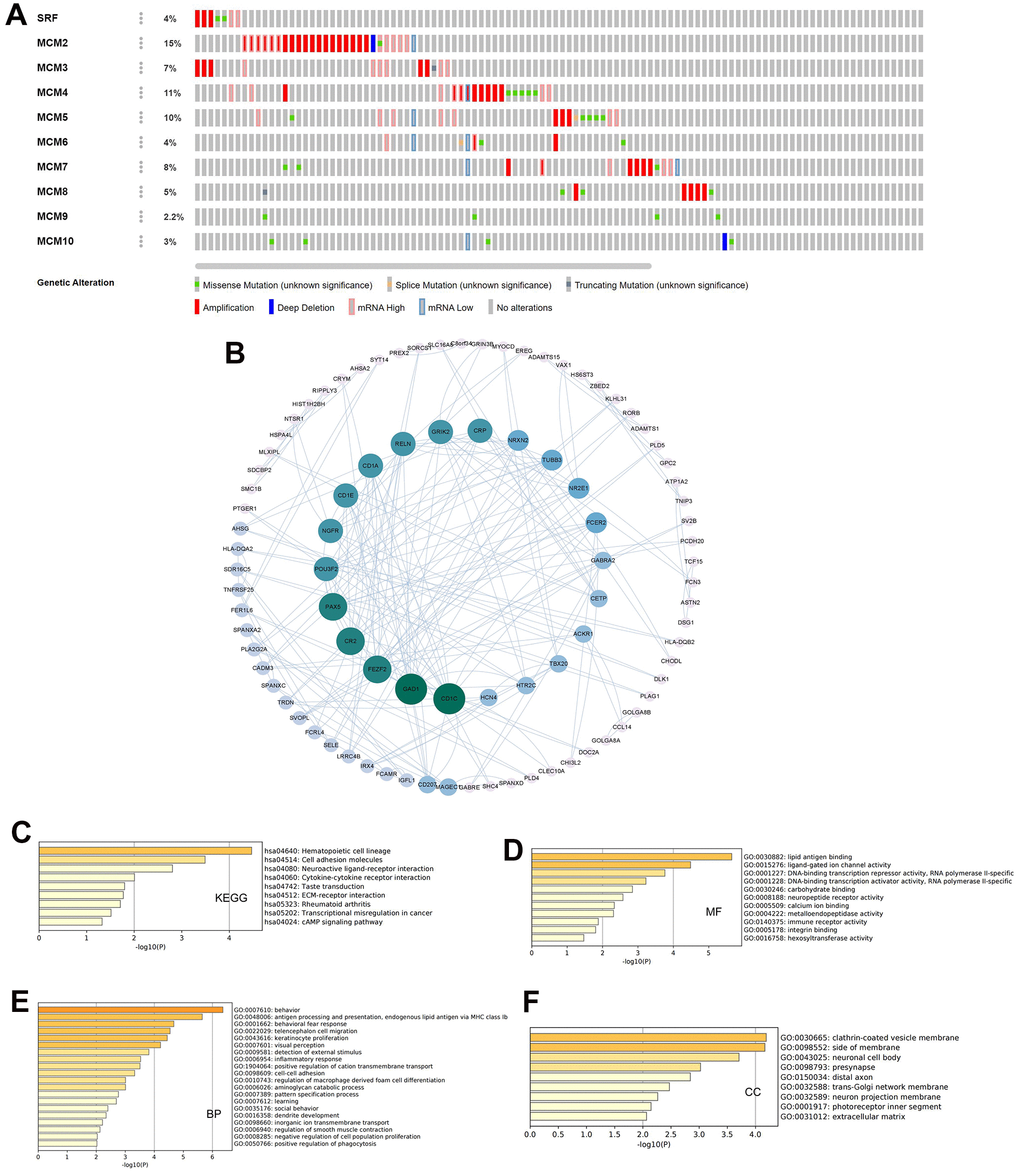
Figure 6. Genetic alterations and pathway enrichment analysis of minichromosome maintenance (MCM) family in LUSC. (A) Summary of mutation rates in each MCM member in LUSC. (B) Protein–protein interaction (PPI) network of the interaction partners of MCM family members built using cBioPortal and Cytoscape. (C–F) KEGG enrichment pathway analysis of molecular functions, biological processes, and cellular components of co-expressed genes.
The Metascape database was utilized for Gene Ontology (GO) and Kyoto Encyclopedia of Genes and Genomes (KEGG) pathway analysis of co-expressed genes. Hematopoietic cell lineage, cell adhesion molecules, neuroactive ligand-receptor interaction, and cytokine–cytokine receptor interaction were explored for co-expressed genes using KEGG pathway analysis (Figure 6C). Molecular function analysis indicated that the genes were primarily involved in lipid antigen binding, ligand-gated ion channel activity, and immune receptor activity (Figure 6D). Biological process analysis indicated that these genes were mainly involved in antigen processing and presentation and behavioral fear responses (Figure 6E). Cellular component analysis revealed that these genes were frequently associated with clathrin-coated vesicle membranes and neuronal cell bodies (Figure 6F). These results indicate that the MCM family is involved in antigen processing and presentation, immune receptor activity, and cytokine-cytokine receptor interaction in LUSC, which may impact immune infiltration of the tumor microenvironment (TME) in LUSC tissues.
Association of expression of MCM family members with immune infiltration in LUSC
The correlation between the MCM gene family and immune cell infiltration was investigated using the TIMER database. The results showed that expression of MCM1 mRNA was significantly associated with infiltration of CD8+ T cells [correlation coefficient (cor) = −0.205, P < 0.05] and CD4+ T cells (cor = 0.260, P < 0.05). Expression of MCM2 was significantly associated with B-cell (cor = 0.112, P < 0.05) and macrophage (cor = − 0.978, P < 0.05) infiltration, while MCM3 expression was significantly associated with infiltration of CD4+ T cells (cor = 0.178, P < 0.05) and macrophages (cor = −0.176, P < 0.05). Additionally, MCM4 expression was significantly associated with infiltration of CD4+ T cells (cor = 0.143, P < 0.05) and macrophages (cor = −0.093, P < 0.05), while expression of MCM5 was significantly associated with infiltration of CD8+ T cells (cor = −0.143, P < 0.05), CD4+ T cells (cor = 0.152, P < 0.05), and macrophages (cor = −0.110, P < 0.05). MCM7 expression was significantly associated with macrophage infiltration (cor = −0.179, P < 0.05), and expression of MCM8 was significantly associated with infiltration of CD4+ T cells (cor = 0.139, P < 0.05), while MCM9 expression was significantly associated with infiltration of CD4+ T cells (cor = 0.203, P < 0.05). Finally, MCM10 expression was significantly associated with macrophage infiltration (cor = −0.185, P < 0.05) (Figure 7). These results suggest that MCM family members affect the immune response in the TME of LUSC.
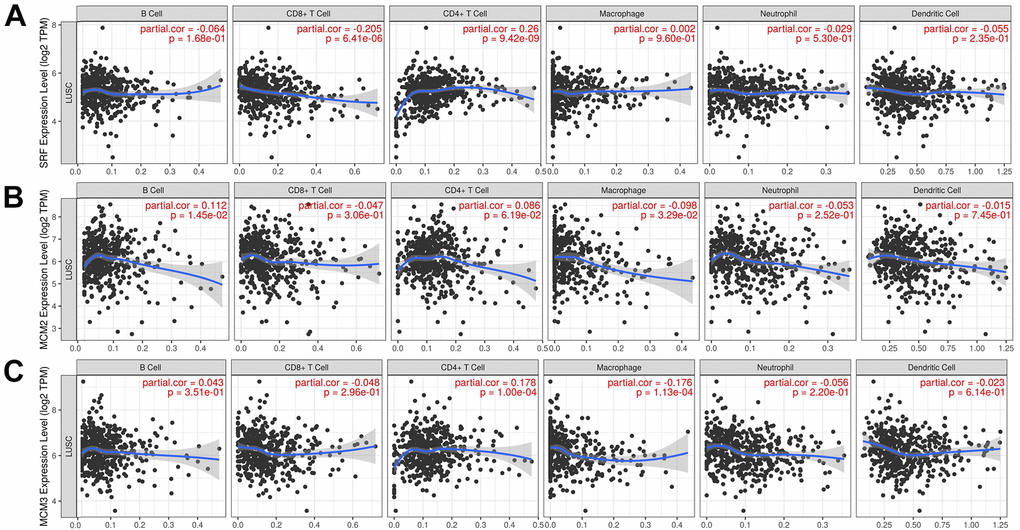
Figure 7. Relationship between mRNA expression of minichromosome maintenance (MCM) family and immune cell infiltration. (A–C) Analysis of association of MCM1–10 mRNA expression with the level of immune cell infiltration in lung squamous cell carcinoma (LUSC) using TIMER database.
(D–J) Analysis of association of MCM1–10 mRNA expression with the level of immune cell infiltration in lung squamous cell carcinoma (LUSC) using TIMER database.
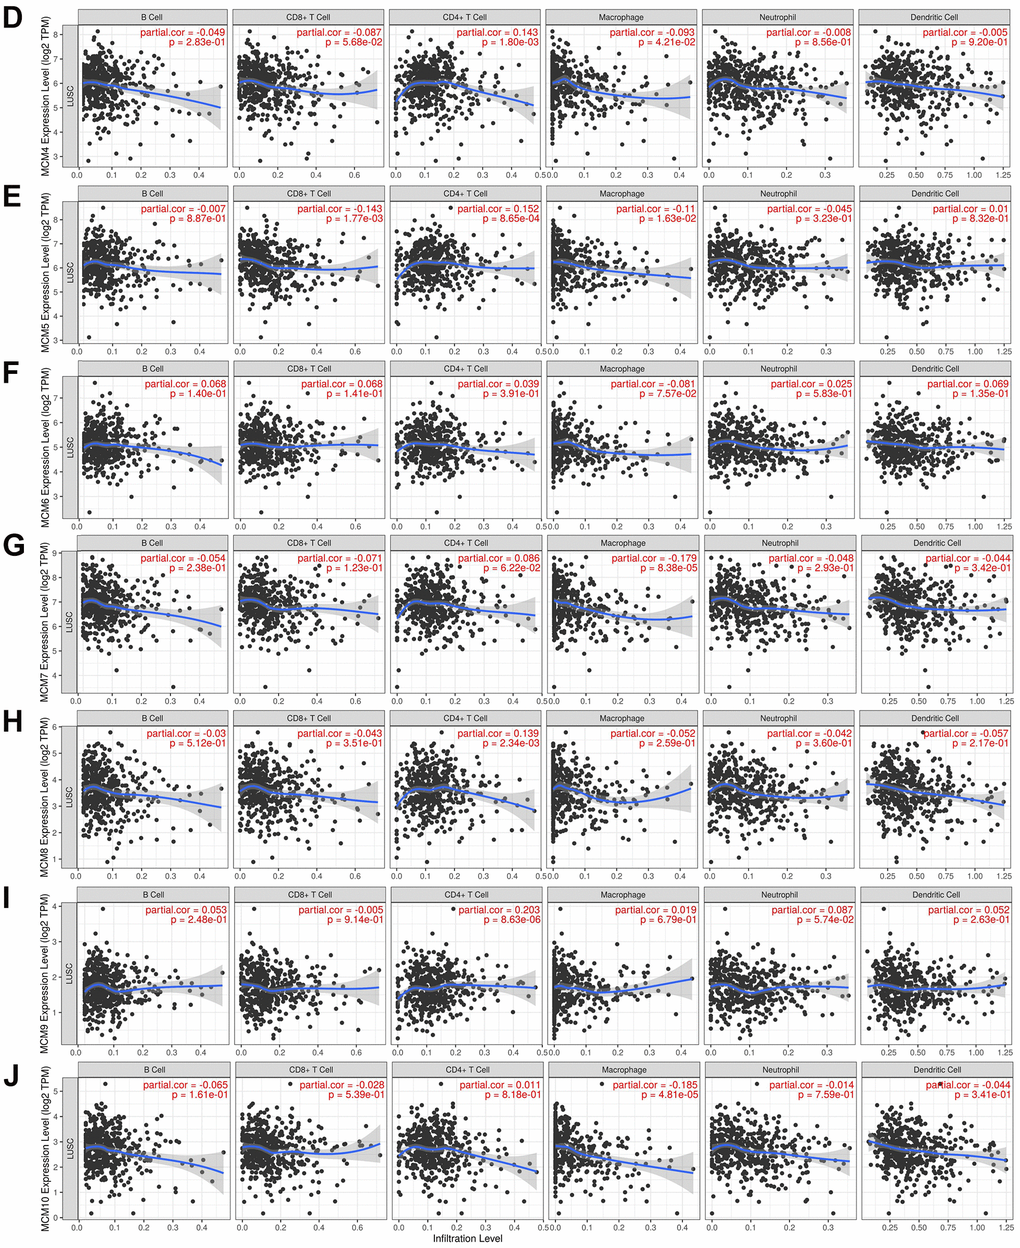
Figure 7. Relationship between mRNA expression of minichromosome maintenance (MCM) family and immune cell infiltration. (D–J) Analysis of association of MCM1–10 mRNA expression with the level of immune cell infiltration in lung squamous cell carcinoma (LUSC) using TIMER database.
Analysis using the TIMER database showed that expression of the MCMs was highly correlated with the signature marker genes of various immune cells in LUSC (Table 2). Notably, MCM1 levels were significantly associated with CD8+ T cells, T cells, M1 and M2 macrophages, T follicular helper (Tfh) cells, Th17 cells, and neutrophils. Expression of MCM2 was significantly correlated with tumor-associated macrophages (TAMs), Th17 cells, and regulatory T cells (Tregs). MCM3 expression was significantly associated with TAMs, M1 macrophages, Tfh, and Th17 cells in LUSC, while MCM4 expression exhibited a strong correlation with B cells, T cells, TAMs, M1 macrophages, dendritic cells, Tfh cells, and Th17 cells. MCM5 expression was significantly associated with most signature marker genes of T cells, TAMs, M1 macrophages, Tfh cells, and Th17 cells. Furthermore, MCM6 expression was associated with B cells, M1 macrophages, Tfh cells, and Th17 cells. MCM7 expression showed high correlations with B cells, T cells, TAMs, M1 macrophages, Tfh cells, and Th17 cells. The mRNA expression of MCM8 was strongly associated with CD8+ T cells, B cells, T cells, TAMs, Th2 cells, Tfh cells, and Th17 cells. The mRNA expression of MCM9 was correlated with M1 macrophages, Tfh cells, Th17 cells, and Tregs. Moreover, B cells, T cells, TAMs, M1 and M2 macrophages, neutrophils, dendritic cells, Th2 cells, and Tfh cells showed favorable correlations with MCM10 expression. Taken together, these findings reveal important relationships between MCM family members and immune-infiltrating cells in LUSC and suggest that these proteins play important roles in the TME of LUSC.
Table 2. The correlations between the expression of MCM family members and markers of immune cells.
| MCM1 | MCM2 | MCM3 | MCM4 | MCM5 | |||||||||||||||||||||||||||||||||||||||||||||||||||||||||||||||||||||||||||||||||||||||||||||||
| Cor | P | Cor | P | Cor | P | Cor | P | Cor | P | ||||||||||||||||||||||||||||||||||||||||||||||||||||||||||||||||||||||||||||||||||||||||||
| CD8+ T cell | CD8A | -0.181 | 0.000 | 0.023 | 0.600 | 0.033 | 0.466 | -0.072 | 0.106 | -0.071 | 0.111 | ||||||||||||||||||||||||||||||||||||||||||||||||||||||||||||||||||||||||||||||||||||||||
| CD8B | -0.150 | 0.001 | 0.132 | 0.003 | 0.088 | 0.049 | -0.030 | 0.510 | -0.022 | 0.617 | |||||||||||||||||||||||||||||||||||||||||||||||||||||||||||||||||||||||||||||||||||||||||
| GZMA | -0.279 | 0.000 | -0.058 | 0.197 | -0.056 | 0.207 | -0.125 | 0.005 | -0.149 | 0.001 | |||||||||||||||||||||||||||||||||||||||||||||||||||||||||||||||||||||||||||||||||||||||||
| B cell | CD19 | -0.051 | 0.259 | -0.094 | 0.036 | -0.051 | 0.257 | -0.117 | 0.009 | -0.056 | 0.209 | ||||||||||||||||||||||||||||||||||||||||||||||||||||||||||||||||||||||||||||||||||||||||
| CD79A | -0.065 | 0.148 | -0.051 | 0.254 | -0.089 | 0.045 | -0.115 | 0.010 | -0.054 | 0.228 | |||||||||||||||||||||||||||||||||||||||||||||||||||||||||||||||||||||||||||||||||||||||||
| MS4A1 | -0.095 | 0.034 | -0.074 | 0.096 | -0.067 | 0.133 | -0.143 | 0.001 | -0.090 | 0.044 | |||||||||||||||||||||||||||||||||||||||||||||||||||||||||||||||||||||||||||||||||||||||||
| T cell | CD3D | -0.230 | 0.000 | -0.093 | 0.037 | -0.083 | 0.063 | -0.183 | 0.000 | -0.142 | 0.001 | ||||||||||||||||||||||||||||||||||||||||||||||||||||||||||||||||||||||||||||||||||||||||
| CD3E | -0.157 | 0.000 | -0.057 | 0.203 | -0.041 | 0.359 | -0.123 | 0.006 | -0.081 | 0.070 | |||||||||||||||||||||||||||||||||||||||||||||||||||||||||||||||||||||||||||||||||||||||||
| CD2 | -0.191 | 0.000 | -0.046 | 0.301 | -0.044 | 0.330 | -0.136 | 0.002 | -0.097 | 0.030 | |||||||||||||||||||||||||||||||||||||||||||||||||||||||||||||||||||||||||||||||||||||||||
| TAM | CCL2 | -0.028 | 0.529 | -0.089 | 0.046 | -0.119 | 0.008 | -0.125 | 0.005 | -0.105 | 0.019 | ||||||||||||||||||||||||||||||||||||||||||||||||||||||||||||||||||||||||||||||||||||||||
| CD68 | -0.085 | 0.057 | -0.130 | 0.004 | -0.204 | 0.000 | -0.087 | 0.052 | -0.137 | 0.002 | |||||||||||||||||||||||||||||||||||||||||||||||||||||||||||||||||||||||||||||||||||||||||
| IL10 | -0.121 | 0.007 | -0.106 | 0.018 | -0.192 | 0.000 | -0.166 | 0.000 | -0.150 | 0.001 | |||||||||||||||||||||||||||||||||||||||||||||||||||||||||||||||||||||||||||||||||||||||||
| M1 | IRF5 | 0.038 | 0.402 | -0.062 | 0.166 | -0.007 | 0.876 | -0.101 | 0.024 | 0.043 | 0.340 | ||||||||||||||||||||||||||||||||||||||||||||||||||||||||||||||||||||||||||||||||||||||||
| PTGS2 | 0.153 | 0.001 | -0.085 | 0.058 | -0.127 | 0.004 | -0.014 | 0.758 | -0.103 | 0.021 | |||||||||||||||||||||||||||||||||||||||||||||||||||||||||||||||||||||||||||||||||||||||||
| NOS2 | 0.157 | 0.000 | 0.226 | 0.000 | 0.193 | 0.000 | 0.218 | 0.000 | 0.230 | 0.000 | |||||||||||||||||||||||||||||||||||||||||||||||||||||||||||||||||||||||||||||||||||||||||
| M2 | MS4A4A | -0.194 | 0.000 | -0.137 | 0.002 | -0.214 | 0.000 | -0.200 | 0.000 | -0.191 | 0.000 | ||||||||||||||||||||||||||||||||||||||||||||||||||||||||||||||||||||||||||||||||||||||||
| CD163 | 0.323 | 0.004 | 0.075 | 0.510 | -0.005 | 0.965 | -0.107 | 0.347 | -0.006 | 0.959 | |||||||||||||||||||||||||||||||||||||||||||||||||||||||||||||||||||||||||||||||||||||||||
| VSIG4 | 0.243 | 0.031 | 0.018 | 0.877 | -0.016 | 0.888 | -0.165 | 0.147 | -0.039 | 0.734 | |||||||||||||||||||||||||||||||||||||||||||||||||||||||||||||||||||||||||||||||||||||||||
| Neutrophils | ITGAM | 0.227 | 0.045 | 0.004 | 0.974 | -0.068 | 0.550 | -0.168 | 0.140 | -0.067 | 0.558 | ||||||||||||||||||||||||||||||||||||||||||||||||||||||||||||||||||||||||||||||||||||||||
| CCR7 | 0.071 | 0.536 | -0.074 | 0.516 | -0.161 | 0.157 | -0.118 | 0.299 | -0.125 | 0.273 | |||||||||||||||||||||||||||||||||||||||||||||||||||||||||||||||||||||||||||||||||||||||||
| SIGLEC5 | 0.296 | 0.008 | 0.215 | 0.057 | 0.193 | 0.089 | 0.161 | 0.156 | 0.168 | 0.140 | |||||||||||||||||||||||||||||||||||||||||||||||||||||||||||||||||||||||||||||||||||||||||
| DC | HLA-DQB1 | 0.105 | 0.357 | -0.073 | 0.522 | -0.222 | 0.049 | -0.234 | 0.038 | -0.108 | 0.344 | ||||||||||||||||||||||||||||||||||||||||||||||||||||||||||||||||||||||||||||||||||||||||
| HLA-DRA | 0.163 | 0.151 | -0.111 | 0.328 | -0.154 | 0.176 | -0.228 | 0.044 | -0.170 | 0.133 | |||||||||||||||||||||||||||||||||||||||||||||||||||||||||||||||||||||||||||||||||||||||||
| HLA-DPA1 | 0.091 | 0.426 | -0.128 | 0.259 | -0.207 | 0.067 | -0.242 | 0.032 | -0.182 | 0.109 | |||||||||||||||||||||||||||||||||||||||||||||||||||||||||||||||||||||||||||||||||||||||||
| CD1C | 0.107 | 0.350 | -0.138 | 0.225 | -0.158 | 0.164 | -0.162 | 0.154 | -0.230 | 0.041 | |||||||||||||||||||||||||||||||||||||||||||||||||||||||||||||||||||||||||||||||||||||||||
| NRP1 | 0.487 | 0.000 | 0.419 | 0.000 | 0.486 | 0.000 | 0.420 | 0.000 | 0.506 | 0.000 | |||||||||||||||||||||||||||||||||||||||||||||||||||||||||||||||||||||||||||||||||||||||||
| Th1 | TBX21 | -0.023 | 0.837 | -0.071 | 0.532 | -0.212 | 0.060 | -0.193 | 0.088 | -0.133 | 0.244 | ||||||||||||||||||||||||||||||||||||||||||||||||||||||||||||||||||||||||||||||||||||||||
| STAT1 | 0.337 | 0.003 | 0.419 | 0.000 | 0.424 | 0.000 | 0.438 | 0.000 | 0.414 | 0.000 | |||||||||||||||||||||||||||||||||||||||||||||||||||||||||||||||||||||||||||||||||||||||||
| Th2 | STAT6 | 0.181 | 0.110 | -0.070 | 0.541 | -0.036 | 0.754 | 0.185 | 0.102 | -0.207 | 0.067 | ||||||||||||||||||||||||||||||||||||||||||||||||||||||||||||||||||||||||||||||||||||||||
| GATA3 | 0.104 | 0.360 | 0.390 | 0.000 | 0.344 | 0.002 | 0.318 | 0.004 | 0.441 | 0.000 | |||||||||||||||||||||||||||||||||||||||||||||||||||||||||||||||||||||||||||||||||||||||||
| STAT5A | 0.204 | 0.072 | 0.030 | 0.791 | -0.164 | 0.150 | -0.038 | 0.736 | -0.206 | 0.069 | |||||||||||||||||||||||||||||||||||||||||||||||||||||||||||||||||||||||||||||||||||||||||
| IL13 | 0.074 | 0.518 | 0.090 | 0.432 | 0.190 | 0.093 | 0.151 | 0.183 | 0.200 | 0.078 | |||||||||||||||||||||||||||||||||||||||||||||||||||||||||||||||||||||||||||||||||||||||||
| Tfh | BCL6 | 0.417 | 0.000 | 0.212 | 0.061 | 0.319 | 0.004 | 0.303 | 0.007 | 0.264 | 0.019 | ||||||||||||||||||||||||||||||||||||||||||||||||||||||||||||||||||||||||||||||||||||||||
| Th17 | STAT3 | 0.570 | 0.000 | 0.416 | 0.000 | 0.364 | 0.001 | 0.425 | 0.000 | 0.275 | 0.015 | ||||||||||||||||||||||||||||||||||||||||||||||||||||||||||||||||||||||||||||||||||||||||
| IL17A | 0.198 | 0.081 | 0.112 | 0.325 | 0.096 | 0.401 | 0.122 | 0.283 | 0.185 | 0.103 | |||||||||||||||||||||||||||||||||||||||||||||||||||||||||||||||||||||||||||||||||||||||||
| Treg | FOXP3 | 0.004 | 0.975 | 0.236 | 0.037 | 0.107 | 0.346 | 0.151 | 0.185 | 0.268 | 0.017 | ||||||||||||||||||||||||||||||||||||||||||||||||||||||||||||||||||||||||||||||||||||||||
| STAT5B | 0.387 | 0.000 | 0.154 | 0.175 | 0.123 | 0.279 | 0.239 | 0.034 | 0.011 | 0.922 | |||||||||||||||||||||||||||||||||||||||||||||||||||||||||||||||||||||||||||||||||||||||||
| CCR8 | 0.021 | 0.855 | 0.191 | 0.091 | -0.019 | 0.866 | 0.059 | 0.606 | 0.082 | 0.475 | |||||||||||||||||||||||||||||||||||||||||||||||||||||||||||||||||||||||||||||||||||||||||
| TGFB1 | 0.184 | 0.104 | 0.315 | 0.005 | 0.196 | 0.083 | 0.228 | 0.043 | 0.255 | 0.023 | |||||||||||||||||||||||||||||||||||||||||||||||||||||||||||||||||||||||||||||||||||||||||
| CD8+ T cell | CD8A | 0.050 | 0.261 | -0.039 | 0.380 | -0.102 | 0.022 | -0.023 | 0.608 | -0.035 | 0.440 | ||||||||||||||||||||||||||||||||||||||||||||||||||||||||||||||||||||||||||||||||||||||||
| CD8B | 0.073 | 0.102 | 0.033 | 0.464 | -0.067 | 0.132 | 0.083 | 0.063 | -0.002 | 0.961 | |||||||||||||||||||||||||||||||||||||||||||||||||||||||||||||||||||||||||||||||||||||||||
| GZMA | -0.010 | 0.827 | -0.097 | 0.031 | -0.158 | 0.000 | -0.118 | 0.008 | -0.055 | 0.215 | |||||||||||||||||||||||||||||||||||||||||||||||||||||||||||||||||||||||||||||||||||||||||
| B cell | CD19 | -0.106 | 0.018 | -0.156 | 0.000 | -0.107 | 0.016 | -0.028 | 0.538 | -0.169 | 0.000 | ||||||||||||||||||||||||||||||||||||||||||||||||||||||||||||||||||||||||||||||||||||||||
| CD79A | -0.092 | 0.040 | -0.169 | 0.000 | -0.135 | 0.002 | -0.078 | 0.081 | -0.187 | 0.000 | |||||||||||||||||||||||||||||||||||||||||||||||||||||||||||||||||||||||||||||||||||||||||
| MS4A1 | -0.102 | 0.023 | -0.153 | 0.001 | -0.117 | 0.009 | 0.019 | 0.668 | -0.160 | 0.000 | |||||||||||||||||||||||||||||||||||||||||||||||||||||||||||||||||||||||||||||||||||||||||
| T cell | CD3D | -0.088 | 0.049 | -0.137 | 0.002 | -0.202 | 0.000 | -0.106 | 0.017 | -0.137 | 0.002 | ||||||||||||||||||||||||||||||||||||||||||||||||||||||||||||||||||||||||||||||||||||||||
| CD3E | -0.058 | 0.199 | -0.123 | 0.006 | -0.166 | 0.000 | -0.078 | 0.082 | -0.126 | 0.005 | |||||||||||||||||||||||||||||||||||||||||||||||||||||||||||||||||||||||||||||||||||||||||
| CD2 | -0.034 | 0.450 | -0.113 | 0.012 | -0.167 | 0.000 | -0.056 | 0.211 | -0.105 | 0.019 | |||||||||||||||||||||||||||||||||||||||||||||||||||||||||||||||||||||||||||||||||||||||||
| TAM | CCL2 | -0.034 | 0.449 | -0.151 | 0.001 | -0.140 | 0.002 | -0.061 | 0.170 | -0.094 | 0.035 | ||||||||||||||||||||||||||||||||||||||||||||||||||||||||||||||||||||||||||||||||||||||||
| CD68 | -0.085 | 0.058 | -0.185 | 0.000 | -0.168 | 0.000 | -0.119 | 0.007 | -0.196 | 0.000 | |||||||||||||||||||||||||||||||||||||||||||||||||||||||||||||||||||||||||||||||||||||||||
| IL10 | -0.101 | 0.024 | -0.215 | 0.000 | -0.168 | 0.000 | -0.069 | 0.123 | -0.175 | 0.000 | |||||||||||||||||||||||||||||||||||||||||||||||||||||||||||||||||||||||||||||||||||||||||
| M1 | IRF5 | -0.068 | 0.129 | -0.012 | 0.781 | 0.074 | 0.098 | 0.091 | 0.041 | -0.110 | 0.014 | ||||||||||||||||||||||||||||||||||||||||||||||||||||||||||||||||||||||||||||||||||||||||
| PTGS2 | -0.100 | 0.025 | -0.169 | 0.000 | -0.051 | 0.253 | -0.054 | 0.224 | -0.049 | 0.276 | |||||||||||||||||||||||||||||||||||||||||||||||||||||||||||||||||||||||||||||||||||||||||
| NOS2 | 0.148 | 0.001 | 0.148 | 0.001 | 0.206 | 0.000 | 0.201 | 0.000 | 0.175 | 0.000 | |||||||||||||||||||||||||||||||||||||||||||||||||||||||||||||||||||||||||||||||||||||||||
| M2 | MS4A4A | -0.101 | 0.024 | -0.248 | 0.000 | -0.189 | 0.000 | -0.085 | 0.056 | -0.216 | 0.000 | ||||||||||||||||||||||||||||||||||||||||||||||||||||||||||||||||||||||||||||||||||||||||
| CD163 | -0.093 | 0.412 | 0.052 | 0.648 | -0.073 | 0.521 | 0.147 | 0.198 | -0.155 | 0.172 | |||||||||||||||||||||||||||||||||||||||||||||||||||||||||||||||||||||||||||||||||||||||||
| VSIG4 | -0.124 | 0.275 | -0.010 | 0.931 | -0.105 | 0.354 | 0.088 | 0.439 | -0.225 | 0.047 | |||||||||||||||||||||||||||||||||||||||||||||||||||||||||||||||||||||||||||||||||||||||||
| Neutrophils | ITGAM | -0.163 | 0.151 | -0.057 | 0.616 | -0.078 | 0.493 | 0.201 | 0.076 | -0.286 | 0.011 | ||||||||||||||||||||||||||||||||||||||||||||||||||||||||||||||||||||||||||||||||||||||||
| CCR7 | -0.150 | 0.186 | -0.096 | 0.401 | -0.062 | 0.586 | 0.030 | 0.790 | -0.241 | 0.033 | |||||||||||||||||||||||||||||||||||||||||||||||||||||||||||||||||||||||||||||||||||||||||
| SIGLEC5 | 0.079 | 0.488 | 0.215 | 0.057 | 0.136 | 0.231 | 0.105 | 0.359 | 0.076 | 0.503 | |||||||||||||||||||||||||||||||||||||||||||||||||||||||||||||||||||||||||||||||||||||||||
| DC | HLA-DQB1 | -0.197 | 0.082 | -0.107 | 0.346 | -0.103 | 0.363 | -0.036 | 0.755 | -0.249 | 0.027 | ||||||||||||||||||||||||||||||||||||||||||||||||||||||||||||||||||||||||||||||||||||||||
| HLA-DPB1 | -0.161 | 0.157 | -0.071 | 0.534 | -0.082 | 0.473 | 0.089 | 0.437 | -0.328 | 0.003 | |||||||||||||||||||||||||||||||||||||||||||||||||||||||||||||||||||||||||||||||||||||||||
| HLA-DRA | -0.198 | 0.081 | -0.154 | 0.176 | -0.126 | 0.266 | 0.068 | 0.549 | -0.375 | 0.001 | |||||||||||||||||||||||||||||||||||||||||||||||||||||||||||||||||||||||||||||||||||||||||
| HLA-DPA1 | -0.250 | 0.027 | -0.190 | 0.093 | -0.156 | 0.170 | 0.099 | 0.387 | -0.417 | 0.000 | |||||||||||||||||||||||||||||||||||||||||||||||||||||||||||||||||||||||||||||||||||||||||
| CD1C | -0.205 | 0.070 | -0.251 | 0.026 | -0.033 | 0.776 | 0.152 | 0.182 | -0.364 | 0.001 | |||||||||||||||||||||||||||||||||||||||||||||||||||||||||||||||||||||||||||||||||||||||||
| NRP1 | 0.402 | 0.000 | 0.546 | 0.000 | 0.341 | 0.002 | 0.202 | 0.074 | 0.451 | 0.000 | |||||||||||||||||||||||||||||||||||||||||||||||||||||||||||||||||||||||||||||||||||||||||
| Th1 | TBX21 | -0.201 | 0.076 | -0.148 | 0.193 | -0.115 | 0.313 | 0.076 | 0.505 | -0.279 | 0.013 | ||||||||||||||||||||||||||||||||||||||||||||||||||||||||||||||||||||||||||||||||||||||||
| STAT1 | 0.498 | 0.000 | 0.395 | 0.000 | 0.412 | 0.000 | 0.109 | 0.338 | 0.350 | 0.002 | |||||||||||||||||||||||||||||||||||||||||||||||||||||||||||||||||||||||||||||||||||||||||
| Th2 | STAT6 | -0.082 | 0.473 | -0.069 | 0.544 | 0.284 | 0.012 | 0.419 | 0.000 | -0.120 | 0.291 | ||||||||||||||||||||||||||||||||||||||||||||||||||||||||||||||||||||||||||||||||||||||||
| GATA3 | 0.377 | 0.001 | 0.355 | 0.001 | 0.242 | 0.032 | -0.125 | 0.271 | 0.406 | 0.000 | |||||||||||||||||||||||||||||||||||||||||||||||||||||||||||||||||||||||||||||||||||||||||
| STAT5A | -0.144 | 0.205 | -0.114 | 0.317 | 0.224 | 0.048 | 0.293 | 0.009 | -0.264 | 0.019 | |||||||||||||||||||||||||||||||||||||||||||||||||||||||||||||||||||||||||||||||||||||||||
| IL13 | 0.192 | 0.090 | 0.266 | 0.018 | 0.109 | 0.337 | -0.036 | 0.752 | 0.361 | 0.001 | |||||||||||||||||||||||||||||||||||||||||||||||||||||||||||||||||||||||||||||||||||||||||
| Tfh | BCL6 | 0.229 | 0.043 | 0.336 | 0.003 | 0.271 | 0.016 | 0.237 | 0.036 | 0.234 | 0.038 | ||||||||||||||||||||||||||||||||||||||||||||||||||||||||||||||||||||||||||||||||||||||||
| Th17 | STAT3 | 0.337 | 0.003 | 0.293 | 0.009 | 0.267 | 0.018 | 0.271 | 0.016 | 0.166 | 0.144 | ||||||||||||||||||||||||||||||||||||||||||||||||||||||||||||||||||||||||||||||||||||||||
| IL17A | 0.098 | 0.389 | 0.131 | 0.250 | 0.075 | 0.513 | 0.039 | 0.732 | 0.082 | 0.473 | |||||||||||||||||||||||||||||||||||||||||||||||||||||||||||||||||||||||||||||||||||||||||
| Treg | FOXP3 | 0.086 | 0.449 | 0.203 | 0.073 | 0.094 | 0.407 | 0.042 | 0.711 | 0.200 | 0.077 | ||||||||||||||||||||||||||||||||||||||||||||||||||||||||||||||||||||||||||||||||||||||||
| STAT5B | 0.100 | 0.382 | 0.121 | 0.289 | 0.254 | 0.024 | 0.280 | 0.012 | -0.108 | 0.345 | |||||||||||||||||||||||||||||||||||||||||||||||||||||||||||||||||||||||||||||||||||||||||
| CCR8 | -0.012 | 0.920 | 0.046 | 0.688 | 0.190 | 0.094 | 0.260 | 0.021 | -0.005 | 0.963 | |||||||||||||||||||||||||||||||||||||||||||||||||||||||||||||||||||||||||||||||||||||||||
| TGFB1 | 0.234 | 0.038 | 0.196 | 0.083 | 0.214 | 0.058 | 0.077 | 0.500 | 0.184 | 0.104 | |||||||||||||||||||||||||||||||||||||||||||||||||||||||||||||||||||||||||||||||||||||||||
| Bold font indicates significant difference. | |||||||||||||||||||||||||||||||||||||||||||||||||||||||||||||||||||||||||||||||||||||||||||||||||||
Discussion
The MCM family are ubiquitously expressed proteins that are involved in the initiation and progression of eukaryotic genome replication [17]. Numerous studies have reported aberrant expression of MCM family members in diverse tumors types, indicating their vital roles in tumorigenesis and cancer progression [18–20]. However, the function of MCM family members in LUSC has not been systematically examined. Hence, we explored the differential mRNA expression of each MCM family member in LUSC tissues compared to in normal tissues. MCM2–10 mRNAs were overexpressed in LUSC cells compared to in normal cells, suggesting their potential to act as oncogenes. Thus, the protein levels of all MCM members were upregulated in patients with LUSC.
Furthermore, numerous studies have been performed to investigate the relationship between clinicopathological features of patients with cancer and expression of MCMs [19, 21–23]. The association of the expression of MCMs with prognostic importance of cancer has also been extensively evaluated. Liu et al. found that MCM4/5/8 were significantly associated with worse OS of patients with lung adenocarcinoma and may serve as potential prognostic indicators for this disease [18]. Gou et al. suggested that high expression of some MCM members can serve as predictive biomarkers for poor prognosis in cancer [24]. Hence, we investigated the clinical correlation and prognostic relevance of abnormally expressed MCMs in patients with LUSC. The mRNA expression of MCM family members in LUSC tissues were significantly correlated with lymph node metastasis and clinicopathological stages. Our results also suggested that MCM3 and MCM7 were associated with better OS but poorer RFS and PPS in patients with LUSC. Overexpression of MCM4/5/6/8 was significantly associated with better OS, whereas that of MCM8 and MCM10 was associated with poorer RFS in patients with LUSC. Additionally, overexpression of the MCM1/2/4/5/9 mRNAs was associated with poor PPS. Further, we found a correlation between the expression of MCMs and prognostic value of the MCM family at different clinical stages of LUSC. MCM2/3/4/5/8/9 expression were significantly associated with poorer RFS in patients with stage III LUSC. Thus, this gene family may have important prognostic value, which should be further evaluated.
Genetic alterations are common in various tumors, including LUSC, and play critical roles in several biological processes such as cell growth, apoptosis, and the cell cycle. Methylation is one genetic alteration with an important role in cancer development. DNA methylation primarily suppresses gene expression, although it can sometimes promote gene expression, according to a previous review [25]. Yin et al. also identified numerous transcription factors that preferentially bind to CpG-methylated sequences [26]. We found that MCM genes were abnormally expressed in LUSC tissues, which was likely related to DNA methylation. This result indicates that DNA methylation-targeted drugs can be used to treat cancer. Essential DNA replication factors, which are highly expressed in malignant cancer cells and precancerous cells but downregulated in differentiated somatic cells, make MCM proteins good targets for anti-cancer drugs. Various small-molecule MCM-targeting inhibitors were recently identified as an initial step toward therapeutic development [27, 28]. Mutation analysis revealed several genetic alterations in all members of the MCM family in patients with LUSC, with 45% of genes altered in LUSC tissues, leading to upregulated and altered mRNA transcription. We also investigated the co-expression of different molecules, including CNTD1, TAS2R5, and LY6G5B, with MCMs. The most significant pathways in which MCMs were involved were cytokine–cytokine receptor interaction and antigen processing and presentation. Therefore, the MCM family shows potential as therapeutic targets for LUSC through interactions with key molecules in immune infiltration-related pathways in tumors.
Previous studies showed that immune cell infiltration affects tumor progression and recurrence while also playing an important role in determining the response to immunotherapy and clinical outcomes [29–31]. LUSC is a genetically complex and heterogeneous disorder with no effective therapies. The tumor immune response was recently shown to be essential for the genesis and development of LUSC [32, 33]. Given that the human immune system is critical in the onset and development of LUSC [34, 35], identifying the genes associated with immune cells in LUSC could be beneficial. Nevertheless, the relationships between MCM proteins and immunotherapy of LUSC have not been reported. Our results showed that all members of the MCM family are related to six types of immune cells, including B cells, CD4+ T cells, CD8+ T cells, macrophages, neutrophils, and dendritic cells. Therefore, we investigated the association between the mRNA expression of MCM family members and markers of immune infiltration in patients with LUSC. Contrary to expectations, several immune cells showed strong associations with the expression of MCM family members. Thus, MCM family members may be crucial in the development of the localized TME in LUSC tissues and can be used as immunotherapeutic targets for LUSC. There was limitation in the present study. Most data utilized in this study were acquired from online databases. To corroborate our findings, further cell-based research and clinical experiments in a well-established tumor cohort are essential.
Conclusions
In conclusion, we comprehensively analyzed the expression of the MCM family in patients with LUSC and the relationship between MCM expression and the prognosis of these patients using bioinformatic tools. Our results improve the understanding of the vital role of MCMs in tumor progression and the immune response in patients with LUSC. The MCM family may be useful as biomarkers and therapeutic targets and can be used to develop diagnostic and prognostic approaches to improve treatment outcomes.
Materials and Methods
TIMER
Based on The Cancer Genome Atlas database, the TIMER tool is a comprehensive resource for evaluating immune cell infiltration and the clinical outcomes of 10,897 tumors from 32 different cancer types. This database enables analyses of the correlations between genes and immune-infiltrating cells, comparisons of gene expression in tumors and normal tissues in various malignancies, and survival analysis, among other functions [36]. We investigated the mRNA expression of MCM family members in various malignancies or specific cancer subtypes from TIMER, which contains 501 LUSC samples and 51 normal lung samples; the log2 (transcripts per million) were applied to convert the data to a log-scale. We also examined the relationship between the MCM family and immune cell infiltration using the TIMER database.
GEPIA2
The web-based tool GEPIA2 provides vital interactive and customizable functions, including patient survival analysis, correlation analysis, and differential expression analysis [37]. 338 normal lung samples and 486 primary LUSC samples were included in the GEPIA2 dataset. The GEPIA2 datasets were utilized to compare the expression of different MCMs in LUSC and normal tissues, and p < 0.05 was considered to indicate statistically significant results.
Human protein atlas
Human Protein Atlas is an online database containing information on protein expression in various cancer types based on immunohistochemistry [38]. We used immunohistochemical images to evaluate the protein levels of several MCM members between LUSC tumors and normal lung tissues.
UALCAN
UALCAN is an interactive network resource based on The Cancer Genome Atlas datasets that allows users to compare information on DNA methylation and mRNA expression in human malignancies [39]. To examine the relationships between the mRNA expression of various MCMs and clinicopathological features in 856 LUSC samples and 52 normal lung samples, we used the “individual cancer stages” model and “nodal metastatic status” model. Using the UALCAN database, we further predicted DNA methylation alterations in MCM family members from 370 LUSC cases and 42 normal lung tissues. Student’s t-test was applied, and p < 0.05 was considered to indicate statistically significant results.
Kaplan–Meier plotter database
The Kaplan–Meier plotter database (https://kmplot.com) was used to analyze the prognostic value of the MCM family in LUSC. The mRNA expression value of the auto-selected best cutoff was used to split the LUSC samples into high and low expression groups to investigate the relationship between MCM expression and OS, RFS, and PPS for 501 patients with LUSC. Using the Kaplan–Meier plotter database, we further examined the prognostic value of MCM family members in patients with various clinical stages of LUSC. A p-value less than 0.05 was considered to indicate statistically significant results.
cBioPortal
cBioPortal (http://cbioportal.org), an open comprehensive platform, can be used to analyze multidimensional cancer genomics and clinical data. We examined the genomic map of the MCM family members, which contains information on mutations and mRNA expression, in 178 LUSC samples. The threshold of the |log2 fold-change| was 0.45, and the p-value cutoff was set at 0.05.
STRING
The STRING database (https://cn.string-db.org/) was used to assess correlations involving MCM genes.
Cytoscape
We integrated functionally 186 co-expressed MCM family members selected using the cBioPortal (molecule names are provided in Supplementary Table 1). The node size was determined as the degree values between interacting proteins.
Metascape
The web-based analysis toolkit Metascape is comprehensive, efficient, customizable, and interactive [40]. Using this dataset, we conducted GO and KEGG pathway enrichment analyses for genes co-expressing with MCM members.
Data availability statement
The original contributions presented in the study are included in the Supplementary Materials, further inquiries can be directed to the corresponding authors.
Supplementary Materials
Author Contributions
Xuejie Yang and Chunrong Wang conducted experimental operations, sample processing, data analysis, and performed the experiments. All authors participated in writing the paper. Chunlin Ou and Xiaoyun He conceived and designed the experiments. All authors read and approved the final manuscript.
Conflicts of Interest
The authors declare that the research was conducted in the absence of any commercial or financial relationships that could be construed as potential conflicts of interest.
Funding
This study was supported by the National Natural Science Foundation of China (81903032 and 81901305), the China Postdoctoral Science Foundation (2020M672520), the Outstanding Youth Foundation of Hunan Provincial Natural Science Foundation of China (2022JJ20098), the Natural Science Foundation of Hunan Province (2021JJ41013 and 2020JJ5925), the Research Program of Hunan Health Commission, China (202103030659), the Central South University Innovation-Driven Research Programme (2023CXQD076) and the Student Innovation Project of Central South University (2022ZZTS0938).
References
- 1. Sung H, Ferlay J, Siegel RL, Laversanne M, Soerjomataram I, Jemal A, Bray F. Global Cancer Statistics 2020: GLOBOCAN Estimates of Incidence and Mortality Worldwide for 36 Cancers in 185 Countries. CA Cancer J Clin. 2021; 71:209–49. https://doi.org/10.3322/caac.21660 [PubMed]
- 2. Cheung CH, Juan HF. Quantitative proteomics in lung cancer. J Biomed Sci. 2017; 24:37. https://doi.org/10.1186/s12929-017-0343-y [PubMed]
- 3. Zhang Y, Yang Q, Wang S. MicroRNAs: a new key in lung cancer. Cancer Chemother Pharmacol. 2014; 74:1105–11. https://doi.org/10.1007/s00280-014-2559-9 [PubMed]
- 4. Wang Y, Nie H, He X, Liao Z, Zhou Y, Zhou J, Ou C. The emerging role of super enhancer-derived noncoding RNAs in human cancer. Theranostics. 2020; 10:11049–62. https://doi.org/10.7150/thno.49168 [PubMed]
- 5. Han Y, Wang D, Peng L, Huang T, He X, Wang J, Ou C. Single-cell sequencing: a promising approach for uncovering the mechanisms of tumor metastasis. J Hematol Oncol. 2022; 15:59. https://doi.org/10.1186/s13045-022-01280-w [PubMed]
- 6. Jenkinson ER, Chong JP. Minichromosome maintenance helicase activity is controlled by N- and C-terminal motifs and requires the ATPase domain helix-2 insert. Proc Natl Acad Sci USA. 2006; 103:7613–8. https://doi.org/10.1073/pnas.0509297103 [PubMed]
- 7. Sharrocks AD, von Hesler F, Shaw PE. The identification of elements determining the different DNA binding specificities of the MADS box proteins p67SRF and RSRFC4. Nucleic Acids Res. 1993; 21:215–21. https://doi.org/10.1093/nar/21.2.215 [PubMed]
- 8. Tye BK. MCM proteins in DNA replication. Annu Rev Biochem. 1999; 68:649–86. https://doi.org/10.1146/annurev.biochem.68.1.649 [PubMed]
- 9. Miano JM, Long X, Fujiwara K. Serum response factor: master regulator of the actin cytoskeleton and contractile apparatus. Am J Physiol Cell Physiol. 2007; 292:C70–81. https://doi.org/10.1152/ajpcell.00386.2006 [PubMed]
- 10. Fei L, Xu H. Role of MCM2-7 protein phosphorylation in human cancer cells. Cell Biosci. 2018; 8:43. https://doi.org/10.1186/s13578-018-0242-2 [PubMed]
- 11. Nishimura K, Ishiai M, Horikawa K, Fukagawa T, Takata M, Takisawa H, Kanemaki MT. Mcm8 and Mcm9 form a complex that functions in homologous recombination repair induced by DNA interstrand crosslinks. Mol Cell. 2012; 47:511–22. https://doi.org/10.1016/j.molcel.2012.05.047 [PubMed]
- 12. Wu B, Xi S. Bioinformatics analysis of the transcriptional expression of minichromosome maintenance proteins as potential indicators of survival in patients with cervical cancer. BMC Cancer. 2021; 21:928. https://doi.org/10.1186/s12885-021-08674-y [PubMed]
- 13. Liu X, Liu Y, Wang Q, Song S, Feng L, Shi C. The Alterations and Potential Roles of MCMs in Breast Cancer. J Oncol. 2021; 2021:7928937. https://doi.org/10.1155/2021/7928937 [PubMed]
- 14. Zhong H, Chen B, Neves H, Xing J, Ye Y, Lin Y, Zhuang G, Zhang SD, Huang J, Kwok HF. Expression of minichromosome maintenance genes in renal cell carcinoma. Cancer Manag Res. 2017; 9:637–47. https://doi.org/10.2147/CMAR.S146528 [PubMed]
- 15. Matsuoka Y, Takagi Y, Nosaka K, Sakabe T, Haruki T, Araki K, Taniguchi Y, Shiomi T, Nakamura H, Umekita Y. Cytoplasmic expression of maspin predicts unfavourable prognosis in patients with squamous cell carcinoma of the lung. Histopathology. 2016; 69:114–20. https://doi.org/10.1111/his.12921 [PubMed]
- 16. Larsen TV, Hussmann D, Nielsen AL. PD-L1 and PD-L2 expression correlated genes in non-small-cell lung cancer. Cancer Commun (Lond). 2019; 39:30. https://doi.org/10.1186/s40880-019-0376-6 [PubMed]
- 17. Deegan TD, Diffley JF. MCM: one ring to rule them all. Curr Opin Struct Biol. 2016; 37:145–51. https://doi.org/10.1016/j.sbi.2016.01.014 [PubMed]
- 18. Liu K, Kang M, Liao X, Wang R. Genome-wide investigation of the clinical significance and prospective molecular mechanism of minichromosome maintenance protein family genes in patients with Lung Adenocarcinoma. PLoS One. 2019; 14:e0219467. https://doi.org/10.1371/journal.pone.0219467 [PubMed]
- 19. Kwok HF, Zhang SD, McCrudden CM, Yuen HF, Ting KP, Wen Q, Khoo US, Chan KY. Prognostic significance of minichromosome maintenance proteins in breast cancer. Am J Cancer Res. 2014; 5:52–71. [PubMed]
- 20. Wang Y, Chen H, Zhang J, Cheng AS, Yu J, To KF, Kang W. MCM family in gastrointestinal cancer and other malignancies: From functional characterization to clinical implication. Biochim Biophys Acta Rev Cancer. 2020; 1874:188415. https://doi.org/10.1016/j.bbcan.2020.188415 [PubMed]
- 21. Lee YS, Ha SA, Kim HJ, Shin SM, Kim HK, Kim S, Kang CS, Lee KY, Hong OK, Lee SH, Kwon HS, Cha BY, Kim JW. Minichromosome maintenance protein 3 is a candidate proliferation marker in papillary thyroid carcinoma. Exp Mol Pathol. 2010; 88:138–42. https://doi.org/10.1016/j.yexmp.2009.09.015 [PubMed]
- 22. Peng YP, Zhu Y, Yin LD, Zhang JJ, Guo S, Fu Y, Miao Y, Wei JS. The Expression and Prognostic Roles of MCMs in Pancreatic Cancer. PLoS One. 2016; 11:e0164150. https://doi.org/10.1371/journal.pone.0164150 [PubMed]
- 23. Liu Z, Li J, Chen J, Shan Q, Dai H, Xie H, Zhou L, Xu X, Zheng S. MCM family in HCC: MCM6 indicates adverse tumor features and poor outcomes and promotes S/G2 cell cycle progression. BMC Cancer. 2018; 18:200. https://doi.org/10.1186/s12885-018-4056-8 [PubMed]
- 24. Gou K, Liu J, Feng X, Li H, Yuan Y, Xing C. Expression of Minichromosome Maintenance Proteins (MCM) and Cancer Prognosis: A meta-analysis. J Cancer. 2018; 9:1518–26. https://doi.org/10.7150/jca.22691 [PubMed]
- 25. Barcena-Varela M, Colyn L, Fernandez-Barrena MG. Epigenetic Mechanisms in Hepatic Stellate Cell Activation During Liver Fibrosis and Carcinogenesis. Int J Mol Sci. 2019; 20:2507. https://doi.org/10.3390/ijms20102507 [PubMed]
- 26. Yin Y, Morgunova E, Jolma A, Kaasinen E, Sahu B, Khund-Sayeed S, Das PK, Kivioja T, Dave K, Zhong F, Nitta KR, Taipale M, Popov A, et al. Impact of cytosine methylation on DNA binding specificities of human transcription factors. Science. 2017; 356:eaaj2239. https://doi.org/10.1126/science.aaj2239 [PubMed]
- 27. Simon NE, Schwacha A. The Mcm2-7 replicative helicase: a promising chemotherapeutic target. Biomed Res Int. 2014; 2014:549719. https://doi.org/10.1155/2014/549719 [PubMed]
- 28. Lei M. The MCM complex: its role in DNA replication and implications for cancer therapy. Curr Cancer Drug Targets. 2005; 5:365–80. https://doi.org/10.2174/1568009054629654 [PubMed]
- 29. Lopes A, Vandermeulen G, Préat V. Cancer DNA vaccines: current preclinical and clinical developments and future perspectives. J Exp Clin Cancer Res. 2019; 38:146. https://doi.org/10.1186/s13046-019-1154-7 [PubMed]
- 30. Nie H, Wang Y, Yang X, Liao Z, He X, Zhou J, Ou C. Clinical Significance and Integrative Analysis of the SMC Family in Hepatocellular Carcinoma. Front Med (Lausanne). 2021; 8:727965. https://doi.org/10.3389/fmed.2021.727965 [PubMed]
- 31. Wang Y, He X, Nie H, Zhou J, Cao P, Ou C. Application of artificial intelligence to the diagnosis and therapy of colorectal cancer. Am J Cancer Res. 2020; 10:3575–98. [PubMed]
- 32. Campbell JD, Alexandrov A, Kim J, Wala J, Berger AH, Pedamallu CS, Shukla SA, Guo G, Brooks AN, Murray BA, Imielinski M, Hu X, Ling S, et al, and Cancer Genome Atlas Research Network. Distinct patterns of somatic genome alterations in lung adenocarcinomas and squamous cell carcinomas. Nat Genet. 2016; 48:607–16. https://doi.org/10.1038/ng.3564 [PubMed]
- 33. Faruki H, Mayhew GM, Serody JS, Hayes DN, Perou CM, Lai-Goldman M. Lung Adenocarcinoma and Squamous Cell Carcinoma Gene Expression Subtypes Demonstrate Significant Differences in Tumor Immune Landscape. J Thorac Oncol. 2017; 12:943–53. https://doi.org/10.1016/j.jtho.2017.03.010 [PubMed]
- 34. Jiang T, Shi J, Dong Z, Hou L, Zhao C, Li X, Mao B, Zhu W, Guo X, Zhang H, He J, Chen X, Su C, et al. Genomic landscape and its correlations with tumor mutational burden, PD-L1 expression, and immune cells infiltration in Chinese lung squamous cell carcinoma. J Hematol Oncol. 2019; 12:75. https://doi.org/10.1186/s13045-019-0762-1 [PubMed]
- 35. Xiang H, Ramil CP, Hai J, Zhang C, Wang H, Watkins AA, Afshar R, Georgiev P, Sze MA, Song XS, Curran PJ, Cheng M, Miller JR, et al. Cancer-Associated Fibroblasts Promote Immunosuppression by Inducing ROS-Generating Monocytic MDSCs in Lung Squamous Cell Carcinoma. Cancer Immunol Res. 2020; 8:436–50. https://doi.org/10.1158/2326-6066.CIR-19-0507 [PubMed]
- 36. Li T, Fan J, Wang B, Traugh N, Chen Q, Liu JS, Li B, Liu XS. TIMER: A Web Server for Comprehensive Analysis of Tumor-Infiltrating Immune Cells. Cancer Res. 2017; 77:e108–10. https://doi.org/10.1158/0008-5472.CAN-17-0307 [PubMed]
- 37. Tang Z, Kang B, Li C, Chen T, Zhang Z. GEPIA2: an enhanced web server for large-scale expression profiling and interactive analysis. Nucleic Acids Res. 2019; 47:W556–60. https://doi.org/10.1093/nar/gkz430 [PubMed]
- 38. Navani S. Manual evaluation of tissue microarrays in a high-throughput research project: The contribution of Indian surgical pathology to the Human Protein Atlas (HPA) project. Proteomics. 2016; 16:1266–70. https://doi.org/10.1002/pmic.201500409 [PubMed]
- 39. Chandrashekar DS, Bashel B, Balasubramanya SA, Creighton CJ, Ponce-Rodriguez I, Chakravarthi BV, Varambally S. UALCAN: A Portal for Facilitating Tumor Subgroup Gene Expression and Survival Analyses. Neoplasia. 2017; 19:649–58. https://doi.org/10.1016/j.neo.2017.05.002 [PubMed]
- 40. Zhou Y, Zhou B, Pache L, Chang M, Khodabakhshi AH, Tanaseichuk O, Benner C, Chanda SK. Metascape provides a biologist-oriented resource for the analysis of systems-level datasets. Nat Commun. 2019; 10:1523. https://doi.org/10.1038/s41467-019-09234-6 [PubMed]