Abstract
B-cell-specific Moloney murine leukemia virus integration site 1 (Bmi-1) is overexpressed in various cancer types. We found that Bmi-1 mRNA levels were elevated in nasopharyngeal carcinoma (NPC) cell lines. In immunohistochemical analyses, high Bmi-1 levels were observed in not only 5 of 38 non-cancerous nasopharyngeal squamous epithelial biopsies, but also in 66 of 98 NPC specimens (67.3%). High Bmi-1 levels were detected more frequently in T3-T4, N2-N3 and stage III-IV NPC biopsies than in T1-T2, N0-N1 and stage I-II NPC samples, indicating that Bmi-1 is upregulated in advanced NPC. In 5-8F and SUNE1 NPC cells, stable depletion of Bmi-1 using lentiviral RNA interference greatly suppressed cell proliferation, induced G1-phase cell cycle arrest, reduced cell stemness and suppressed cell migration and invasion. Likewise, knocking down Bmi-1 inhibited NPC cell growth in nude mice. Both chromatin immunoprecipitation and Western blotting assays demonstrated that Hairy gene homolog (HRY) upregulated Bmi-1 by binding to its promoter, thereby increasing the stemness of NPC cells. Immunohistochemistry and quantitative real-time PCR analyses revealed that HRY expression correlated positively with Bmi-1 expression in a cohort of NPC biopsies. These findings suggested that HRY promotes NPC cell stemness by upregulating Bmi-1, and that silencing Bmi-1 can suppress NPC progression.
Introduction
Nasopharyngeal carcinoma (NPC) is a type of squamous cell carcinoma that originates in the mucosal epithelium of the nasopharynx [1–3]. NPC is prevalent in south China, especially Guangdong province, occurring in roughly 20 per 100,000 people annually [1–3]. Due to the deep location and vague symptoms of NPC, most patients exhibit relatively advanced disease during their initial diagnosis, including local invasion and early distant metastases, so the prognosis of NPC tends to be poor [1–3]. Thus, it is essential to determine the molecular pathways involved in the pathogenesis of NPC so that patients can be diagnosed early, receive an accurate prediction of their prognosis and be treated with novel therapeutic strategies.
B-cell-specific Moloney murine leukemia virus integration site 1 (Bmi-1), a widely expressed nuclear protein and proto-oncogene, is a catalytic subunit of Polycomb repressive complex 1 [4–6]. Bmi-1 is required to maintain and promote the self-renewal of mouse adult stem cells such as hematopoietic, small intestinal, lung, prostate, neural, breast and dental pulp stem cells [4–8]. Bmi-1 suppresses the differentiation of adult stem cells and precursor cells, whereas knocking out Bmi-1 has been shown to induce the differentiation of these cells [4–8]. In addition, Bmi-1 promotes cell senescence, immortalization, transcription initiation and chromatin agglutination-related protein interactions [4–6].
Moderate Bmi-1 expression is necessary for development, whereas abnormally high Bmi-1 expression has been linked with the oncogenesis, development and prognosis of various tumor types, including glioma, colorectal cancer, breast cancer and prostate cancer [4–6]. Bmi-1 is also needed for the maintenance and self-renewal of cancer stem-like cells/tumor-initiating cells in leukemia [9–11], colorectal cancer [12], liver cancer [13], glioma [14, 15], breast cancer [16, 17], prostate cancer [18, 19], head and neck squamous cell carcinoma [20], and medulloblastoma [21]. Bmi-1 overexpression was shown to immortalize nasopharyngeal epithelial cells [22] and trigger their epithelial-mesenchymal transition (EMT) [23]. On the other hand, Bmi-1 silencing was reported to promote apoptosis in NPC cells, thereby sensitizing them to chemotherapeutic and radiotherapeutic treatments [24–27]. Moreover, Bmi-1 antibody as a potential marker of NPC may be rational, and could have diagnostic and prognostic value [28].
Hairy gene homolog (HRY) is the mammalian homolog of the Drosophila hairy gene [29], and is a member of the hairy and enhancer of split (HES1-7) gene family [30]. HRY is often used as a stem cell marker, and is necessary for the self-renewal of hematopoietic stem cells [31], small intestinal stem cells [32, 33], melanin stem cells [34] and pancreatic stem cells [35]. HRY is highly expressed in various tumor tissues [36, 37], and is required to maintain the stemness of cancer stem cells [38, 39]. Overexpression of miR-199b was found to downregulate HRY, thereby reducing the number of cancer stem cells in medulloblastoma [40]. On the other hand, tumor necrosis factor alpha was shown to increase the content of cancer stem cells in oral squamous cell carcinoma by activating Notch-Hes1 [41]. Moreover, HRY was reported to promote tumor development/progression and maintain cancer stem cell stemness in colon cancer [42]. The Notch signaling pathway was found to enhance the therapeutic resistance of cancer stem cells in lung cancer and ovarian cancer [43, 44].
In the present study, we investigated the influence of Bmi-1 on the proliferation, stemness, motility and invasion of NPC cells, and explored the molecular pathways underlying these effects.
Results
High Bmi-1 expression is common among clinical NPC tissue samples
To assess the involvement of Bmi-1 in NPC progression, we used quantitative real-time PCR (qRT-PCR) to measure Bmi-1 mRNA levels in NPC cell lines. Bmi-1 was markedly upregulated in all the NPC cell lines we tested (CNE1, CNE2, HK1, HK1-EBV, SUNE1, HONE1, HONE1-EBV, 5-8F, NPC43 and C17) relative to NP69 nasopharyngeal epithelial cells (Figure 1A).
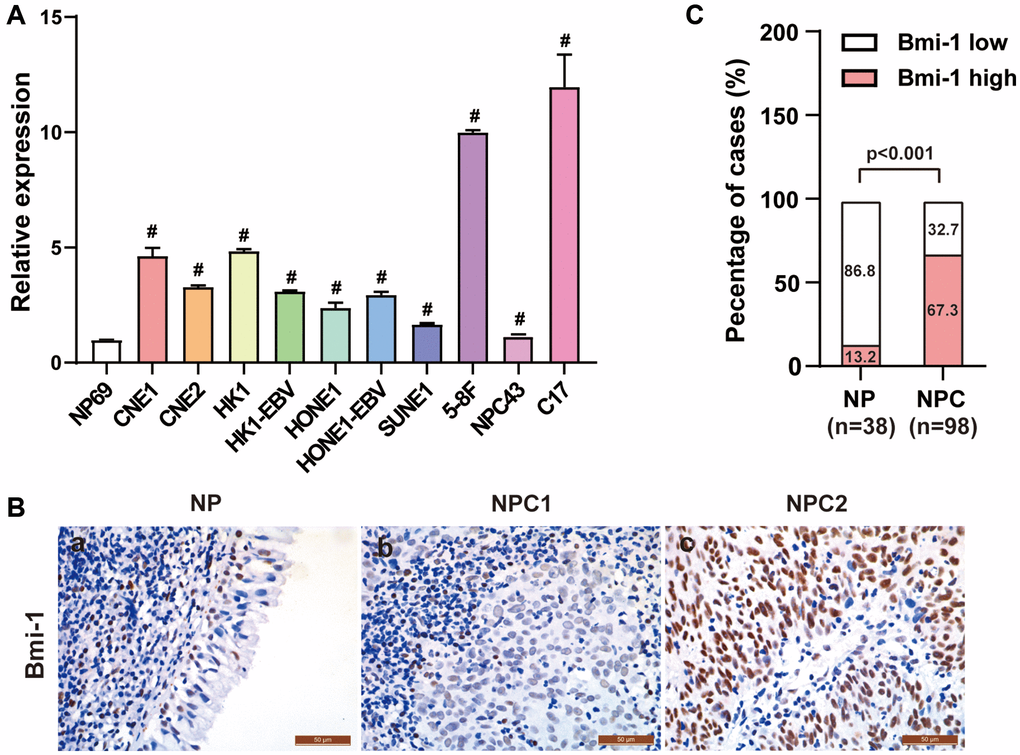
Figure 1. Bmi-1 was markedly upregulated in NPC clinical tissue specimens. (A) Bmi-1 levels were detected using qRT-PCR in the NPC cell lines shown. (B) Representative photographs from immunohistochemical analyses of Bmi-1 protein levels in NPC tissues and non-cancerous nasopharyngeal epithelial tissues. (C) Bmi-1 levels were significantly greater in NPC tissues than in non-cancerous nasopharyngeal epithelial tissues (P < 0.001, χ2 test).
We then used immunohistochemical staining to examine Bmi-1 protein levels in archived paraffin-embedded tissue samples from 98 NPC biopsies and 38 non-cancerous nasopharyngeal biopsies. Low Bmi-1 levels were observed in 33 of the 38 non-cancerous nasopharyngeal epithelial samples (86.8%) (Figure 1B, 1C; Table 1). On the other hand, among the 98 NPC specimens, 32 (32.7%) exhibited low or non-detectable Bmi-1 expression, while 66 (67.3%) exhibited high Bmi-1 staining (Figure 1B, 1C; Table 1). Thus, high Bmi-1 expression was more common in NPC tissues than in non-cancerous nasopharyngeal tissues.
Table 1. Bmi-1 levels in 38 non-cancerous epithelial tissues and 98 NPC tissues.
| Tissue type | n | Bmi-1 expression | χ2 | P |
| High (n, %) | Low (n, %) |
| Non-cancerous epithelial tissues | 38 | 5 (13.2) | 33 (86.8) | 32.226 | <0.001 |
| NPC | 98 | 66 (67.3) | 32 (32.7) |
Bmi-1 upregulation is associated with aggressive NPC phenotypes
We then assessed the association of Bmi-1 levels with various clinicopathological traits in the 98 NPC patients (Table 2). Bmi-1 levels did not correlate with the age (P = 0.319) or sex (P = 0.221) of the NPC patients (Table 2). On the other hand, we did find positive correlations between Bmi-1 levels and the tumor size (‘T’; P = 0.030), lymph node invasion (‘N’; P < 0.001) and clinical stage (III-IV vs. I-II; P = 0.001) of NPC (Figure 2A, 2B; Table 2). Briefly, high Bmi-1 expression was detected more often in T3-T4, N2-N3 and stage III-IV NPC biopsies than in T1-T2, N0-N1 and stage I-II samples, respectively (Figure 2A, 2B; Table 2), demonstrating that the gain of Bmi-1 expression is an important feature of advanced NPC. In addition, overall survival was significantly shorter in patients with high Bmi-1 levels than in patients with low Bmi-1 levels (Figure 2C).
Table 2. Correlation of clinicopathological characteristics with Bmi-1 levels in NPC tissues.
| Characteristics | Case no. | Bmi-1 expression | χ2 | P |
| High (n, %) | Low (n, %) |
| Sex |
| Female | 26 | 15 (57.7) | 11 (42.3) | 1.500 | 0.221 |
| Male | 72 | 51 (70.8) | 21 (29.2) |
| Age (years) |
| <47 | 53 | 38 (71.7) | 15 (28.3) | 0.994 | 0.319 |
| ≥47 | 45 | 28 (62.2) | 17 (37.8) |
| Histological type |
| DNKC | 7 | 4 (57.1) | 3 (42.9) | 0.357 | 0.550 |
| UDC | 91 | 62 (68.1) | 29 (31.9) |
| T classification |
| T1-T2 | 40 | 22 (55) | 18 (45) | 4.685 | 0.030 |
| T3-T4 | 58 | 44 (75.9) | 14 (24.1) |
| Lymph node metastasis |
| N0-N1 | 19 | 5 (26.3) | 14 (73.7) | 18.044 | <0.001 |
| N2-N3 | 79 | 61 (77.2) | 18 (22.8) |
| Distant metastasis |
| No | 94 | 62 (66) | 32 (34) | 2.022 | 0.155 |
| Yes | 4 | 4 (100) | 0 (0) |
| Clinical stage |
| I-II | 25 | 10 (40) | 15 (60) | 11.414 | 0.001 |
| III-IV | 73 | 56 (76.7) | 17 (23.3) |
| Abbreviations: DNKC: differentiated nonkeratinizing carcinoma; UDC: undifferentiated carcinoma; T: tumor size; N: lymph node metastasis. |
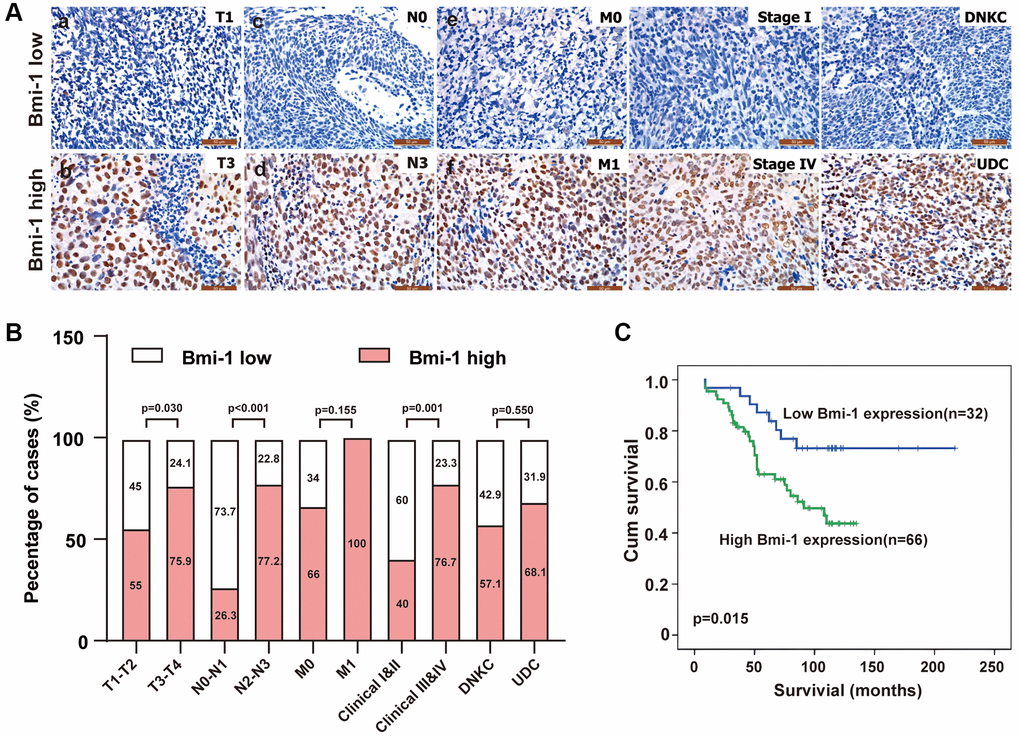
Figure 2. Bmi-1 upregulation was associated with malignant tumor progression in NPC patients. (A) Representative images of Bmi-1 levels in clinical tissue biopsies from NPC patients with differing tumor-node-metastasis (TNM) stages, clinical stages and histological types. Low Bmi-1 expression was detected in T1 (a), N0 (c), M0 (e), stage I (g) and differentiated nonkeratinizing carcinoma (DNKC) (i) NPC biopsies, while high Bmi-1 expression was observed in T3 (b), N3 (d), M1 (f), stage IV (h) and undifferentiated carcinoma (UDC) (j) tumors. (B) The number and percentage of samples with high and low Bmi-1 levels according to various clinicopathological traits (χ2 test). (C) Cumulative overall survival curves of 98 NPC patients with high or low Bmi-1 levels. A log-rank test was used to calculate the P value.
Bmi-1 silencing suppresses NPC cell proliferation
Given that Bmi-1 expression was significantly induced in NPC samples, we suspected that inhibiting Bmi-1 expression might suppress NPC progression. Thus, we used RNA interference (RNAi) with short hairpin RNA (shRNA) to evaluate whether knocking down Bmi-1 would diminish NPC cell growth. Compared with the scrambled control vector (shSCR), the Bmi-1 shRNA (shBmi-1) successfully repressed Bmi-1 mRNA (Figure 3A) and protein (Figure 3B) expression in 5-8F and SUNE1 cells. A Cell Counting Kit 8 (CCK8) assay revealed that silencing endogenous Bmi-1 inhibited the growth of 5-8F and SUNE1 cells (Figure 3C, 3D). Moreover, a colony formation assay indicated that shBmi-1 treatment notably reduced the number and size of colonies formed by 5-8F and SUNE1 cells (Figure 3E, 3F). Cell cycle analyses demonstrated that Bmi-1 knockdown induced cell cycle arrest at phase G1 (Figure 3G, 3H). Thus, the loss of Bmi-1 suppressed the proliferation of NPC cells in vitro.
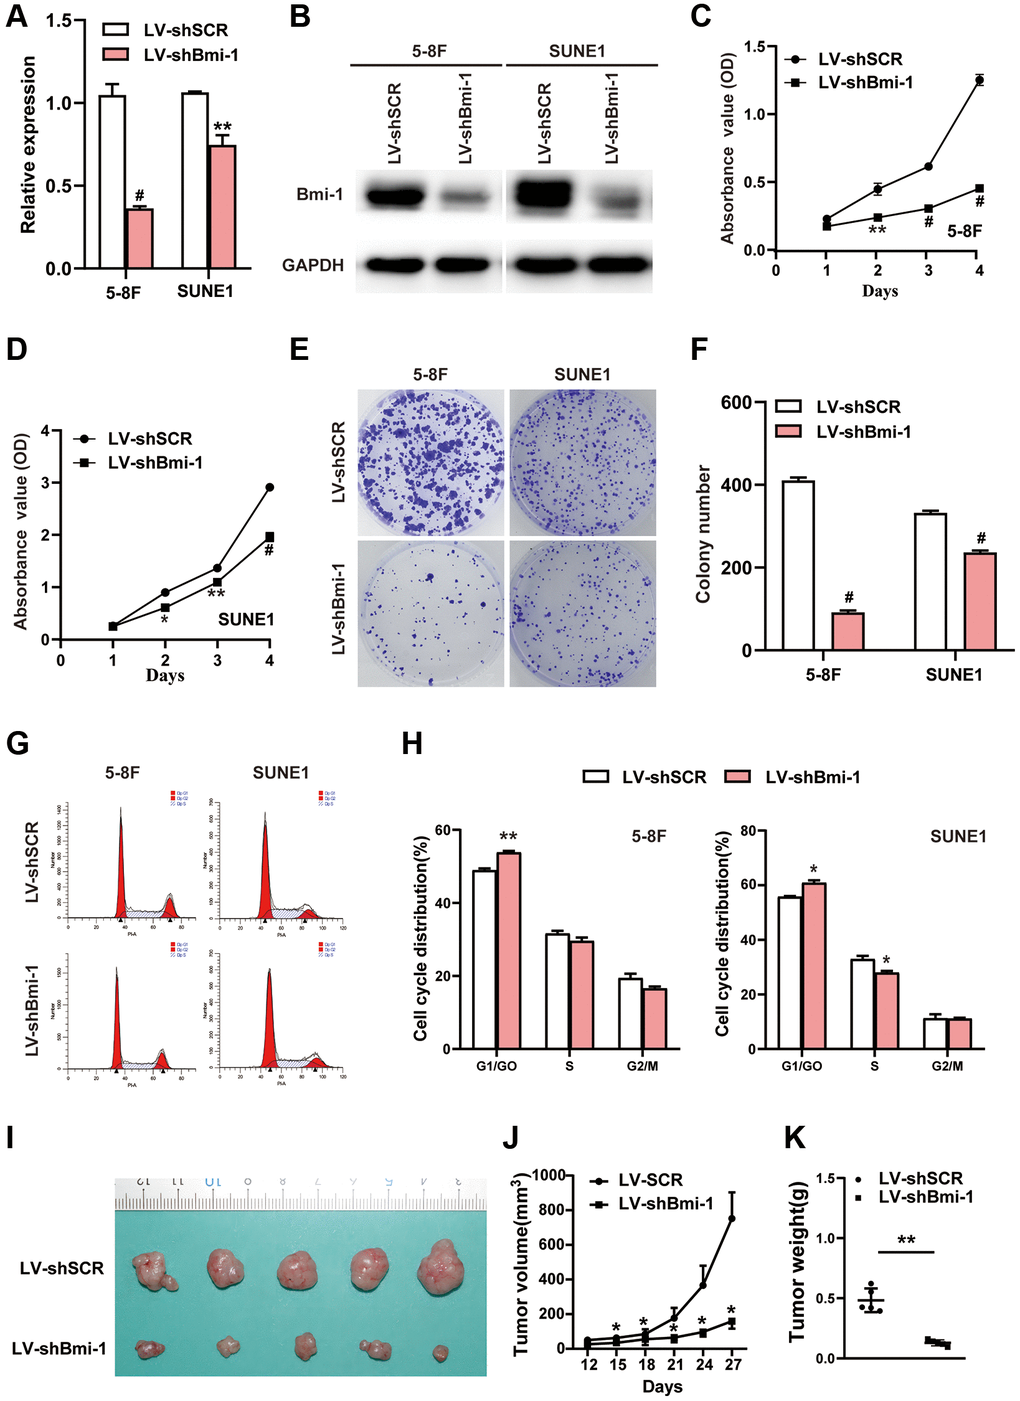
Figure 3. RNAi-induced knockdown of Bmi-1 inhibited the in vitro proliferation and in vivo tumorigenesis of NPC cells. (A) The relative mRNA levels of Bmi-1 in shBmi-1-expressing 5-8F and SUNE1 cells were determined via qRT-PCR. SCR: scrambled control shRNA. (B) The protein levels of Bmi-1 in shBmi-1-expressing 5-8F and SUNE1 cells were determined via Western blotting. (C, D) A CCK8 assay was employed to assess the growth of shBmi-1-expressing 5-8F and SUNE1 cells. (E, F) A colony formation assay was used to examine the proliferation abilities of shBmi-1-expressing 5-8F and SUNE1 cells. (G, H) Propidium iodide staining and flow cytometry were used to detect the cell cycle distributions of shBmi-1-expressing 5-8F and SUNE1 cells (G), and the statistical results were calculated (H). (I–K) Bmi-1 knockdown inhibited tumor growth from 5-8F cells in nude mice. A representative tumor picture is shown (I), along with a tumor volume growth curve (J) and the tumor weights (K).
Bmi-1 knockdown reduces the tumorigenicity of NPC cells in vivo
We then examined the impact of Bmi-1 silencing on NPC cell growth in vivo by performing tumor xenograft experiments. Nude mice received subcutaneous injections of 5-8F cells expressing shSCR or shBmi-1. Tumors from mice injected with shSCR-expressing cells were notably larger in size (Figure 3I), volume (Figure 3J) and weight (Figure 3K) than those from mice injected with shBmi-1-expressing cells. These results demonstrated that Bmi-1 silencing suppressed the tumorigenicity of NPC cells in vivo.
Knocking down Bmi-1 significantly reduces NPC cell stemness
We next assessed stemness marker expression and tumor sphere formation to determine the effects of Bmi-1 inhibition on NPC stem cell-like populations. RNAi- induced depletion of endogenous Bmi-1 downregulated the mRNA levels of stem cell markers such as octamer-binding transcription factor 4 (Oct4), Nanog homeobox (Nanog), SRY-box transcription factor 2 (Sox2) and ATP binding cassette subfamily G member 2 (ABCG2) in NPC cells (Figure 4A). Sphere-forming assays revealed that silencing Bmi-1 diminished the number of spheres formed by NPC cells (Figure 4B, 4C). Furthermore, Western blotting indicated that pAKT levels were significantly reduced in shBmi-1-expressing NPC cells compared with shSCR-expressing NPC cells (Figure 4D). These findings illustrated that knocking down Bmi-1 reduced NPC cell stemness.
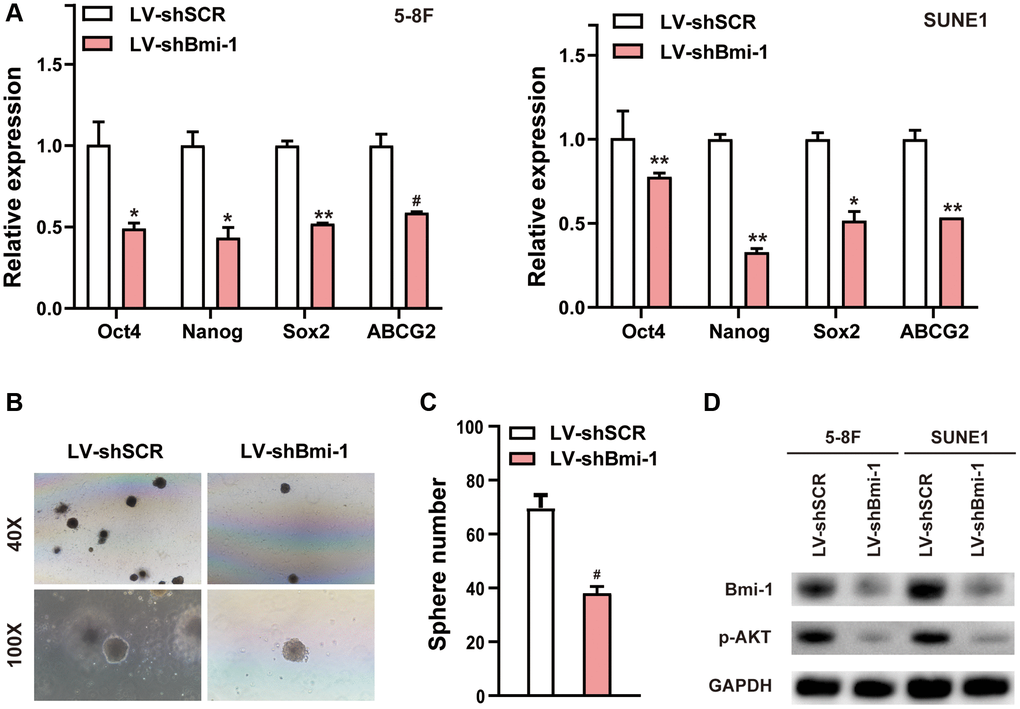
Figure 4. RNAi-induced suppression of Bmi-1 reduced NPC cell stemness. (A) qRT-PCR analysis of various genes in shBmi-1-expressing 5-8F and SUNE1 cells. (B, C) Depletion of endogenous Bmi-1 in 5-8F cells inhibited tumor sphere formation. (D) Western blotting results of cell extracts from shBmi-1-expressing 5-8F and SUNE1 cells. The loading control was GAPDH.
Bmi-1 silencing inhibits the EMT, migration and invasion of NPC cells
Our results above demonstrated that Bmi-1 upregulation correlated with lymph node invasion and metastasis in human NPC samples (Figure 2 and Table 2). Considering that the EMT facilitates the invasion and metastasis of a variety of cancer types [45], we evaluated epithelial and mesenchymal marker expression after silencing endogenous Bmi-1 in NPC cells. Bmi-1 knockdown markedly upregulated epithelial markers (E-cadherin and β-catenin) and downregulated mesenchymal markers (vimentin, N-cadherin, fibronectin, snail1 and snail2) at the mRNA level in 5-8F and SUNE1 cells (Figure 5A).
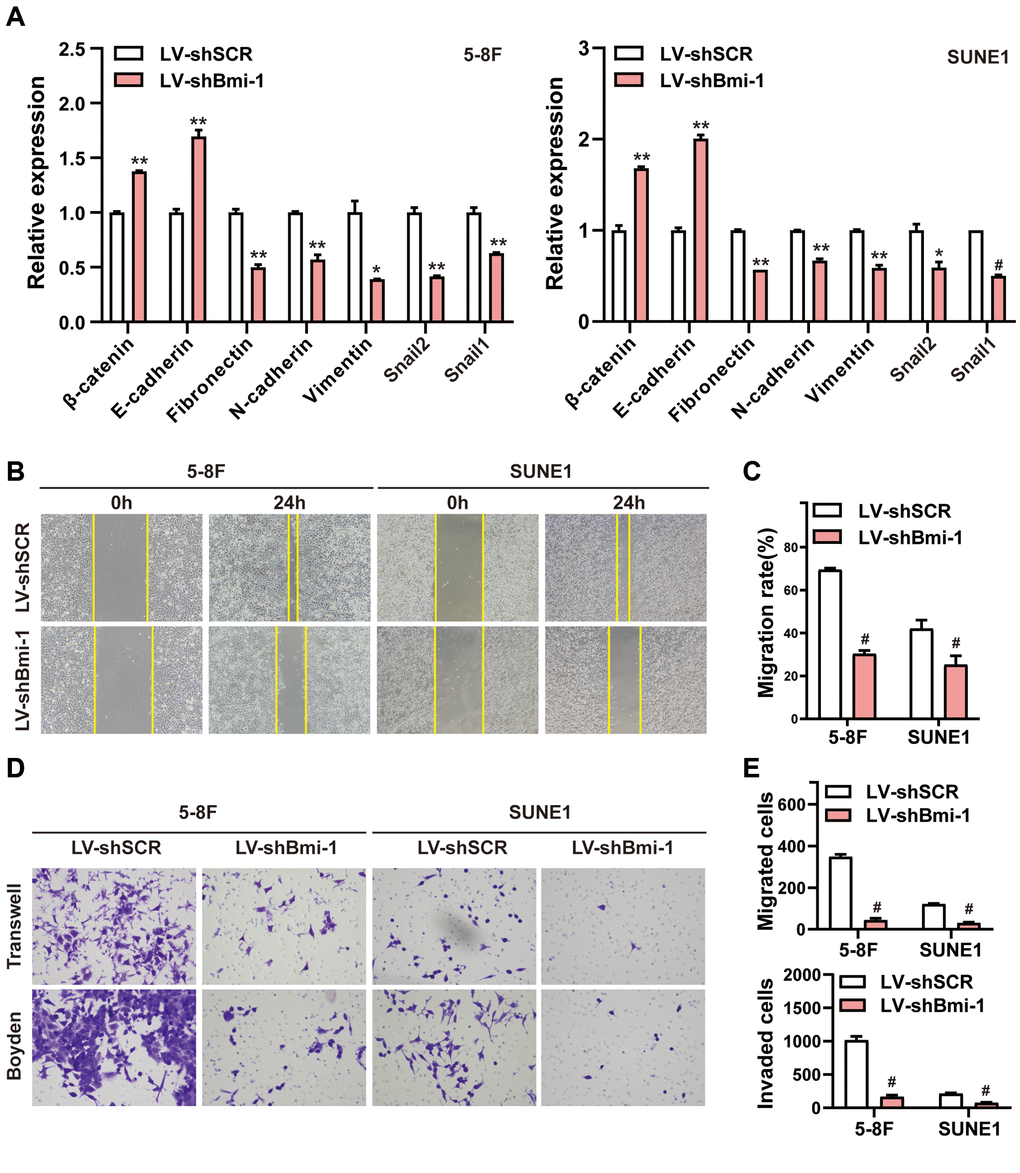
Figure 5. RNAi-induced knockdown of Bmi-1 suppressed the EMT, migration and invasion of NPC cells in vitro. (A) The mRNA levels of various genes in shBmi-1-expressing NPC cells were determined using qRT-PCR. (B, C) Wound healing assays were performed in shBmi-1-expressing 5-8F and SUNE1 cells. Migration activity was measured based on the distance from the scratch boundary lines to the cell-free space for 24 hours. (D, E) The motility and invasiveness of shBmi-1-expressing NPC cells were determined using Transwell migration and Boyden invasion assays, respectively.
Then, we evaluated the impact of Bmi-1 on NPC cell mobility and invasiveness. Wound healing assays demonstrated that Bmi-1 silencing inhibited both 5-8F and SUNE1 cell migration (Figure 5B, 5C). Moreover, Transwell migration assays and Boyden chamber invasion assays indicated that Bmi-1 knockdown suppressed 5-8F and SUNE1 cell migration and invasion (Figure 5D, 5E). These results suggested that Bmi-1 silencing suppressed NPC cell motility and invasiveness by triggering events characteristic of the EMT in vitro.
HRY binds to the promoter of Bmi-1 to upregulate Bmi-1 expression
Our previous study [46] and other studies [47–50] have indicated that HRY/Hes1 enhances cancer cell stemness. Bioinformatic analyses predicted Bmi-1 as a target of HRY. Therefore, we examined Bmi-1 expression in HRY-expressing or shHRY-expressing NPC cells. Western blotting revealed that HRY overexpression increased Bmi-1 levels, while HRY silencing significantly downregulated Bmi-1 (Figure 6A), suggesting that HRY enhances the expression of Bmi-1 in NPC cells. Then, we conducted a chromatin immunoprecipitation (ChIP) assay to assess the binding between HRY and Bmi-1 in NPC cells. We found that HRY could bind to the Bmi-1 promoter region at specific regulatory sequences (Figure 6B), and quantitative ChIP assays confirmed these findings (Figure 6C). These data suggested that HRY binds to the promoter of Bmi-1 to induce the transcription of this gene.
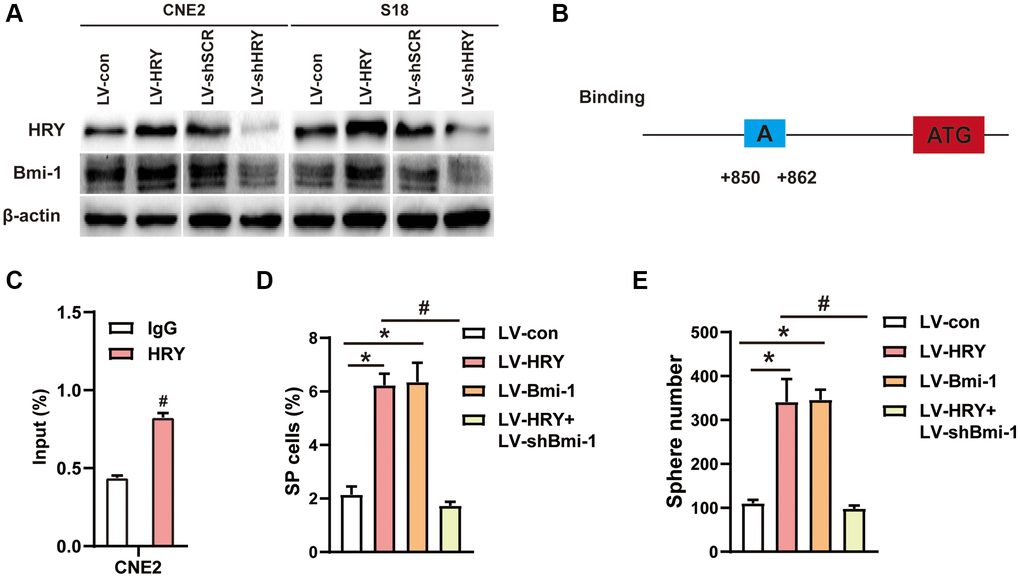
Figure 6. HRY increased the stemness of NPC cells by promoting Bmi-1 expression. (A) Western blotting was used to determine the protein levels of HRY and Bmi-1 in NPC cells transfected with different plasmids. (B) Schematic diagram of the Bmi-1 promoter, displaying possible HRY binding sites. ATG: start codon for translation. (C) ChIP assays were conducted with anti-HRY or IgG antibodies to determine HRY binding sites on the Bmi-1 promoter in CNE2 cells. (D) The proportions of SP cells among CNE2 cells transduced with different plasmids were analyzed using flow cytometry. (E) Tumor sphere formation in CNE2 cells transduced with different plasmids.
HRY enhances the stemness of NPC cells by upregulating Bmi-1
To understand whether the effects of Bmi-1 on NPC cell stemness depended on the upstream activity of HRY, we assessed the impact of gain and loss of HRY function. We performed side population (SP) cell detection and tumor sphere formation assays to evaluate the effects of exogenous HRY expression on stem cell-like populations in NPC. HRY overexpression (gain of function) notably increased the proportion of SP cells among CNE2 cells (6.2%, vs. 2.0% in the control; Figure 6D). Similar to the effects of exogenous Bmi-1 expression, HRY overexpression significantly increased the number of spheres formed by CNE2 cells (Figure 6E).
Subsequently, we investigated whether shBmi-1 could reverse the increase in stemness induced by ectopic HRY expression in NPC cells. We observed that shBmi-1 treatment prevented HRY overexpression from elevating the proportion of SP cells (Figure 6D) and increasing the sphere number and diameter (Figure 6E). These findings suggested that HRY induces NPC cell stemness by upregulating Bmi-1.
Association between HRY and Bmi-1 levels in NPC patients
Our earlier results indicated that Bmi-1 was upregulated in tissues from NPC patients (Figure 1B, 1C; Table 1). Moreover, we previously reported that HRY expression was elevated in NPC specimens [51]. Thus, we assessed the correlation between Bmi-1 and HRY levels in NPC specimens using qRT-PCR and immunohistochemistry. We observed a significant positive association between Bmi-1 and HRY mRNA levels in NPC biopsies (two-tailed Spearman’s correlation, r = 0.8273, P = 0.0005; Figure 7A). Likewise, we detected a correlation between Bmi-1 and HRY protein levels in NPC tissues (Figure 7B, 7C). Thus, HRY levels correlated positively with Bmi-1 levels at both the mRNA and protein levels in NPC specimens.
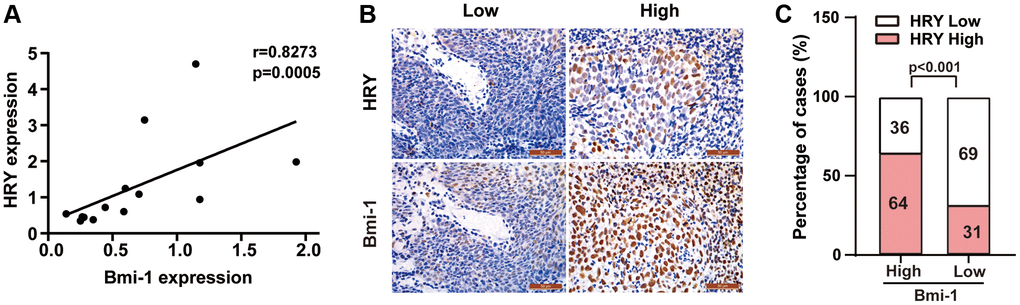
Figure 7. HRY levels correlated positively with Bmi-1 levels in NPC tissues. (A) HRY and Bmi-1 mRNA levels correlated significantly and positively with one another in NPC samples (Spearman’s correlation analysis, r = 0.8273, P = 0.0005). (B) Relationship between HRY and Bmi-1 levels in immunohistochemical analysis of NPC tissues. (C) HRY levels correlated positively with Bmi-1 levels in NPC tissues (χ2 test).
Discussion
NPC, a malignant cancer of the head and neck, is distinctly distributed among ethnic groups and localities worldwide [1–3]. More NPC patients die from distant metastases than from their primary tumors [1–3]. However, it is unclear which molecular pathways cause NPC to progress in malignancy.
Bmi-1 is considered to be oncogenic, as it contributes to the progression of various cancers and is upregulated in glioma, colorectal cancer, breast cancer and prostate cancer [4–6]. Here, we observed that Bmi-1 levels were significantly elevated in NPC cell lines and tissue specimens compared with their normal counterparts. More importantly, higher Bmi-1 expression tended to be detected in clinical stage III-IV, T3-T4 and N2-N3 patient samples than in stage I-II, T1-T2 and N0-N1 samples, respectively. We subsequently demonstrated that silencing Bmi-1 suppressed NPC cell proliferation, stemness, motility and invasion, which was consistent with these findings from the previously published studies [26, 52]. Thus, evidence from NPC cells, tissues and functional experiments clearly illustrated that Bmi-1 is an oncogene contributing to the development of NPC.
Bmi-1 maintains and/or promotes the self-renewal of cancer stem-like cells/tumor-initiating cells in a variety of tumors [9–21], and thus is an ideal target for treatments aimed at cancer stem-like cells. For example, Bmi-1 inhibition in colorectal cancer [12] and combined suppression of Bmi-1 and enhancer of zeste 2 Polycomb repressive complex 2 subunit (EZH2) expression in glioma [15] effectively eliminated cancer stem-like cells, thereby achieving an ideal anticancer efficacy. Various highly selective small molecules (e.g., PTC-028, PTC-209 and PTC596) have been developed to inhibit Bmi-1 for basic and clinical tumor treatment, and the results have been encouraging [12, 53–59]. In this study, we observed that Bmi-1 silencing remarkably suppressed the stemness of NPC cells.
We then demonstrated that Bmi-1 may be transcriptionally induced by HRY. Dramatic upregulation of HRY has been noted in various cancer types, including breast cancer [60], colon cancer [46, 61, 62], glioma [63], head and neck squamous cell carcinoma [64], hepatocellular carcinoma [65], lung cancer [66], medulloblastoma [67], meningioma [68], NPC [51] and ovarian carcinoma [69]. Our previous study [46] and other studies [46–50, 70] have also indicated that HRY enhances cancer cell proliferation and stemness, further illustrating the oncogenic activity of HRY. The present study revealed that Bmi-1 may promote the proliferation and stemness of NPC cells as a downstream target of HRY. HRY levels correlated positively with Bmi-1 levels in NPC tissues, and HRY induced Bmi-1 expression in NPC cells. Moreover, HRY was bound to the Bmi-1 promoter, suggesting that Bmi-1 is a bona fide transcriptional target of HRY.
Subsequently, we investigated whether HRY increased the stemness of NPC cells in vitro by inducing Bmi-1. We observed that HRY overexpression increased NPC cell stemness in a manner similar to ectopic Bmi-1 expression, whereas shBmi-1 treatment reversed the increased stemness in HRY-expressing CNE2 cells. These results demonstrated that HRY reinforces the stemness of NPC cells by upregulating its target gene, Bmi-1.
Despite these findings, the mechanism(s) by which Bmi-1 silencing suppresses NPC progression remain unclear. A previous study revealed that Bmi-1 transcriptionally repressed the tumor suppressor phosphatase and tensin homolog (PTEN), thereby activating the phosphoinositide 3-kinase (PI3K)/AKT pathway, inducing the EMT and promoting the invasion and metastasis of NPC cells [23]. The suppression of PTEN has been shown to activate the PI3K/AKT/glycogen synthase kinase 3β pathway in various kinds of cancer cells, thus greatly promoting their proliferation and stemness [71–77]. These data suggest that Bmi-1 may enhance the proliferation and stemness of NPC cells by inducing PTEN/PI3K/AKT signaling, although further investigation is needed to confirm this.
In conclusion, our study revealed that Bmi-1 downregulation suppressed tumor progression during the pathogenesis of NPC. Thus, Bmi-1 could be a useful treatment target in advanced NPC patients. However, studies combining ChIP-seq and RNA-seq assays are needed to identify the downstream target genes responsible for the tumor-promoting effects of this transcription factor, and these results should be verified in subsequent validation and functional studies.
Materials and Methods
Cell lines and cell culture
The human NPC (5-8F, C17, CNE1, CNE2, HK1, HK1-EBV, HONE1, HONE1-EBV, NPC43 and SUNE1) and immortalized nasopharyngeal epithelial (NP69) cells were kind gifts from Prof. Qiao Tao (Chinese University of Hong Kong, Hong Kong, China), Prof. GSW Tsao (University of Hong Kong), Prof. Yixin Zeng (Sun Yat-sen University, Guangzhou, China) and Prof. Musheng Zeng (Sun Yat-sen University). The cells were maintained at 37°C in a humidified incubator containing 5% CO2. RPMI 1640 medium supplemented with 10% fetal bovine serum was used to culture the NPC cells, while keratinocyte/serum-free medium (Invitrogen) was used for the NP69 cells.
Clinical specimens
Tissue punches were generated from formalin-fixed, paraffin-embedded tumor specimens obtained from patients diagnosed with primary NPC at the Department of Pathology, Sun Yat-Sen University Cancer Center and at the Department of Pathology, the Second Affiliated Hospital of Guilin Medical University in Guilin, China. The tissue microarray was produced using non-cancerous nasopharyngeal epithelial tissue punches and NPC tissue punches. Histopathological information was collected from pathology reports, and survival data were collected in raw form from the patients’ attending physicians. Tissue and clinical data were retrieved according to the regulations of the Sun Yat-Sen University Cancer Center institutional review board and of the Second Affiliated Hospital of Guilin Medical University institutional review board, and data safety laws concerning ethical standards and patient confidentiality. The application of the tissue microarray was approved by the Medical Ethics Committee of Sun Yat-Sen University Cancer Center and the Second Affiliated Hospital of Guilin Medical University.
Immunohistochemistry
Tissue microarray blocks were cut into 4-μm sections, and then were deparaffinized and rehydrated. Antigen retrieval was performed by treating the sections with high pressure for 3 minutes in sodium citrate buffer. Subsequently, 3% H2O2 was used to block the sections for 10 minutes, and an overnight incubation was performed with a primary antibody against Bmi-1 (Proteintech, cat. no. 66161-1-Ig) at 4°C. A goat anti-rabbit secondary antibody was then used to stain the slides for 20 minutes at 37°C. Lastly, diaminobenzidine staining and hematoxylin counterstaining were performed. The intensity of the staining was graded as 0 (negative), 1 (weak), 2 (moderate) or 3 (strong), with scores of 0 or 1 being defined as low, and scores of 2 or 3 being considered high. Two pathologists who were blinded to the patients’ clinicopathological data independently evaluated the results of the histopathological and immunohistochemical studies.
RNA isolation and qRT-PCR
RNA isolation, reverse transcription and qRT-PCR were conducted as reported previously [78–85]. The qRT-PCR primers are detailed in Supplementary Table 1. Glyceraldehyde 3-phosphate dehydrogenase (GAPDH) was employed as an endogenous control. Internal controls were used to normalize all samples, and relative quantification (2−ΔΔCt) was used to calculate fold-changes.
Plasmids, lentivirus production and lentiviral transduction for stable cell lines
The oligonucleotide used to knock down human Bmi-1 was GTTCACAAGACCAGACCAC (‘shBmi-1’). The lentiviral shRNA construct for human Bmi-1 was obtained according to the pLenti-U6-GFP-Puro vector protocol. For lentivirus production, 293T cells were co-transfected with lentiviral packaging plasmids (psPAX2 and pMD2G; Addgene) and the lentiviral vectors, as reported previously [78–85]. Then, 5-8F and SUNE1 cells were infected with the lentiviruses. The pWPXL-HRY plasmid was supplied by Addgene (Addgene plasmid 36983). Prof. Ryoichiro Kageyama (Kyoto University, Kyoto, Japan) kindly provided the pCSII vectors containing the scrambled and HRY-knockdown sequences.
Western blotting
Proteins were lysed, electrophoretically separated on sodium dodecyl sulfate polyacrylamide gels, and transferred to polyvinylidene difluoride membranes. Primary antibodies against Bmi-1 (Proteintech, cat. no. 66161-1-Ig; mouse, 1:1000 dilution), HRY (Abcam, cat. no. ab71559; mouse, 1:2000 dilution), GAPDH (Proteintech, cat. no. 10494-1-AP; rabbit, 1:5000 dilution) or β-actin (Proteintech, cat. no. 81115-1-RR; rabbit, 1:5000 dilution) were used to probe the membranes. Then, the membranes were incubated with horseradish peroxidase-labeled secondary antibodies. Enhanced chemiluminescence was used to detect the hybridization signals. The loading control was either GAPDH or β-actin. Supplementary Table 2 lists the antibodies used in the present study.
CCK8 and colony formation assays
The CCK8 assay (cat. no. CK04, Dojindo, Japan) and colony formation assay were conducted as reported previously [78–85].
Cell cycle analysis
The cell cycle analysis was conducted as reported previously [78, 81].
Tumor xenografted mice
Three- to four-week-old male BALB/c nude mice were obtained from the Experimental Animal Center of Southern Medical University and provided with autoclaved drinking water and laboratory rodent chow. The left dorsal thigh of each mouse (n = 6) was injected subcutaneously with 2.5 × 10⁶ shSCR- or shBmi-1-expressing 5-8F cells. Daily monitoring was performed, and a caliper slide rule was used to measure the tumor volume. The tumor volume was determined as 1/2 (width2 × length). The mice were euthanized on the 27th day after transplantation. These experiments were performed with strict adherence to the Guide for the Care and Use of Laboratory Animals of Southern Medical University. The Committee on the Ethics of Animal Experiments of Southern Medical University approved the animal protocol.
Wound healing assay
The wound healing assay was conducted as reported previously [81].
Transwell migration and Boyden invasion assays
The Transwell migration and Boyden invasion assays were conducted as reported previously [51, 79, 81, 82, 85–87].
ChIP
In CNE2 cells, HRY binding sites on the Bmi-1 promoter were identified using a ChIP assay in accordance with the manufacturer’s instructions. In brief, formaldehyde (1% final concentration) was used for cross-linking during a 10-minute incubation at room temperature, and a glycine solution was used to terminate the reaction. Then ice-cold phosphate-buffered saline containing 0.1 mM phenylmethylsulfonyl fluoride was used to wash the cells. The cells were centrifuged at 1000 rpm for 5 minutes, and 1 mL of ChIP sonication buffer was used to resuspend the cell pellet. Sonication was performed to shear the DNA, and a 3-minute centrifugation at 9,000 × g was used to pellet the cell debris. Equal aliquots of the chromatin supernatants were immunoprecipitated with an anti-HRY (Abcam) or IgG (negative control) antibody overnight. The ChIP-qPCR primers are shown in Supplementary Table 3.
Flow cytometry analysis of the percentages of SP cells
Trypsin (0.25%) was used to digest the NPC cells, and then two washes with calcium/magnesium-free phosphate-buffered saline were performed. Ice-cold RPMI 1640 medium supplemented with 2% fetal bovine serum was used to resuspend the cells to a concentration of 1 × 10⁶ cells/mL. The cells were placed an incubator containing 5% CO2 at 37°C for 90 minutes. Then, flow cytometry was used to evaluate the percentage of SP cells.
Statistical analysis
All data are shown as the mean ± standard deviation. SPSS 16.0 software was used for statistical analyses. The association of clinicopathological traits with Bmi-1 expression was assessed using a χ2 test. A log-rank test was used to analyze the cumulative overall survival. Spearman’s correlation analysis was performed to determine the correlation between Bmi-1 and HRY levels. A two-tailed Student’s t-test was used to compare two independent groups (*P < 0.05, **P < 0.01, #P < 0.001).
Abbreviations
Bmi-1: B-cell-specific Moloney murine leukemia virus integration site 1;
ChIP: chromatin immunoprecipitation;
DNKC: differentiated nonkeratinizing carcinoma;
EMT: epithelial-mesenchymal transition;
HRY: Hairy gene homolog;
NPC: nasopharyngeal carcinoma;
N: lymph node metastasis;
M: distant metastasis;
PTEN: phosphatase and tensin homolog;
qRT-PCR: quantitative real-time polymerase chain reaction;
RNAi: RNA interference;
RPMI 1640: Roswell Park Memorial Institute 1640;
shRNA: short hairpin RNA;
SP: side population;
T: tumor size;
UDC: undifferentiated carcinoma.
Author Contributions
The study was conceptualized and designed by YL, JSJ, DX, SJX, XKZ and HFS. The experiments were performed and results were analyzed by YL, HFS, QWL, HTX, XFL, MLC, JWX, SCW, GQD, YZ, YCL, SHH, DHH, ZHZ, JGC, TYL, XYL, ABW, XKZ and JSJ. DX, SJX, YL and QWL wrote the manuscript. All authors read and approved the final manuscript.
Acknowledgments
We express our deepest gratitude to Dr. Didier Trono (University of Geneva, Geneva, Switzerland) for kindly providing the lentiviral packaging plasmids psPAX2 and pMD2.G.
Conflicts of Interest
The authors declare no conflicts of interest related to this study.
Ethical Statement
This study was approved by the Biomedical Ethics Committee of Southern Medical University and the Biomedical Ethics Committee of Southern Medical University. Tissue and clinical data were retrieved according to the regulations of the Sun Yat-Sen University Cancer Center institutional review board and of the Second Affiliated Hospital of Guilin Medical University institutional review board.
Funding
This work was supported by the National Natural Science Foundation of China (grant nos. 82173299, 81872209, 81672689, 81372896 and 81172587 to DX; grant nos. 81870602 and 81600488 to XLL; grant no. 81702778 to JSJ; grant no. 82203251 to TYL; grant nos. 82260476, 82060500, 81760491 and 81560441 to SJX; grant no. 81702953 to SCW), the Natural Science Foundation of Guangdong Province of China (grant nos. 2022A1515012477 and 2014A030313294 to DX; grant no. 2022A1515012467 to JSJ; grant no. 2023A1515011844 to LXL; grant no. 2021A1515111127 to TYL; grant nos. 2023A1515010331 and 2022A1515010018 to ABW), the Science and Technology Planning Project of Guangdong Province of China (grant nos. 2017A010105017, 2013B060300013 and 2009B060300008 to DX; grant no. 2017A030303018 to JSJ; grant no. 2015A030302024 to XLL), the China Postdoctoral Science Foundation (grant nos. 2015M572338, 2016T90792, 2017M622740 and 2018T110884 to X.-L. Lin), the President Foundation of Nanfang Hospital (grant no. 2020C002 to T.Y. Lin), the Medical Scientific Research Foundation of Guangdong Province of China (grant no. A2017420 to JSJ; grant no. B2014238 to HFS), the Basic Research Foundation of Yunnan Province Local Universities (grant no. 202001BA070001-063 to JWX), the Science and Technology Planning Project of Kunming City of China (grant no. 2019-1-S-25318000001329 to JWX), the Scientific Research Start-up Plan of Young Scientific Scholars of Southern Medical University (grant no. B1012108 to HFS) and the Science Research Foundation of Guangdong Medical University (grant no. B2017005 to S.C. Wang).
References
-
1.
Campion NJ, Ally M, Jank BJ, Ahmed J, Alusi G. The molecular march of primary and recurrent nasopharyngeal carcinoma. Oncogene. 2021; 40:1757–74. https://doi.org/10.1038/s41388-020-01631-2 [PubMed]
-
2.
Hui EP, Ma BBY, Chan ATC. The emerging data on choice of optimal therapy for locally advanced nasopharyngeal carcinoma. Curr Opin Oncol. 2020; 32:187–95. https://doi.org/10.1097/CCO.0000000000000622 [PubMed]
-
3.
Wong KCW, Hui EP, Lo KW, Lam WKJ, Johnson D, Li L, Tao Q, Chan KCA, To KF, King AD, Ma BBY, Chan ATC. Nasopharyngeal carcinoma: an evolving paradigm. Nat Rev Clin Oncol. 2021; 18:679–95. https://doi.org/10.1038/s41571-021-00524-x [PubMed]
-
4.
Jiang L, Li J, Song L. Bmi-1, stem cells and cancer. Acta Biochim Biophys Sin (Shanghai). 2009; 41:527–34. https://doi.org/10.1093/abbs/gmp040 [PubMed]
-
5.
Ren X, Liu L, Zhou Y, Zhu Y, Zhang H, Zhang Z, Li H. Nanoparticle siRNA against BMI-1 with a Polyethylenimine-Laminarin Conjugate for Gene Therapy in Human Breast Cancer. Bioconjug Chem. 2016; 27:66–73. https://doi.org/10.1021/acs.bioconjchem.5b00650 [PubMed]
-
6.
Siddique HR, Saleem M. Role of BMI1, a stem cell factor, in cancer recurrence and chemoresistance: preclinical and clinical evidences. Stem Cells. 2012; 30:372–8. https://doi.org/10.1002/stem.1035 [PubMed]
-
7.
Biehs B, Hu JK, Strauli NB, Sangiorgi E, Jung H, Heber RP, Ho S, Goodwin AF, Dasen JS, Capecchi MR, Klein OD. BMI1 represses Ink4a/Arf and Hox genes to regulate stem cells in the rodent incisor. Nat Cell Biol. 2013; 15:846–52. https://doi.org/10.1038/ncb2766 [PubMed]
-
8.
López-Arribillaga E, Rodilla V, Pellegrinet L, Guiu J, Iglesias M, Roman AC, Gutarra S, González S, Muñoz-Cánoves P, Fernández-Salguero P, Radtke F, Bigas A, Espinosa L. Bmi1 regulates murine intestinal stem cell proliferation and self-renewal downstream of Notch. Development. 2015; 142:41–50. https://doi.org/10.1242/dev.107714 [PubMed]
-
9.
Lessard J, Sauvageau G. Bmi-1 determines the proliferative capacity of normal and leukaemic stem cells. Nature. 2003; 423:255–60. https://doi.org/10.1038/nature01572 [PubMed]
-
10.
Rizo A, Olthof S, Han L, Vellenga E, de Haan G, Schuringa JJ. Repression of BMI1 in normal and leukemic human CD34(+) cells impairs self-renewal and induces apoptosis. Blood. 2009; 114:1498–505. https://doi.org/10.1182/blood-2009-03-209734 [PubMed]
-
11.
Smith LL, Yeung J, Zeisig BB, Popov N, Huijbers I, Barnes J, Wilson AJ, Taskesen E, Delwel R, Gil J, Van Lohuizen M, So CW. Functional crosstalk between Bmi1 and MLL/Hoxa9 axis in establishment of normal hematopoietic and leukemic stem cells. Cell Stem Cell. 2011; 8:649–62. https://doi.org/10.1016/j.stem.2011.05.004 [PubMed]
-
12.
Kreso A, van Galen P, Pedley NM, Lima-Fernandes E, Frelin C, Davis T, Cao L, Baiazitov R, Du W, Sydorenko N, Moon YC, Gibson L, Wang Y, et al. Self-renewal as a therapeutic target in human colorectal cancer. Nat Med. 2014; 20:29–36. https://doi.org/10.1038/nm.3418 [PubMed]
-
13.
Chiba T, Miyagi S, Saraya A, Aoki R, Seki A, Morita Y, Yonemitsu Y, Yokosuka O, Taniguchi H, Nakauchi H, Iwama A. The polycomb gene product BMI1 contributes to the maintenance of tumor-initiating side population cells in hepatocellular carcinoma. Cancer Res. 2008; 68:7742–9. https://doi.org/10.1158/0008-5472.CAN-07-5882 [PubMed]
-
14.
Godlewski J, Nowicki MO, Bronisz A, Williams S, Otsuki A, Nuovo G, Raychaudhury A, Newton HB, Chiocca EA, Lawler S. Targeting of the Bmi-1 oncogene/stem cell renewal factor by microRNA-128 inhibits glioma proliferation and self-renewal. Cancer Res. 2008; 68:9125–30. https://doi.org/10.1158/0008-5472.CAN-08-2629 [PubMed]
-
15.
Jin X, Kim LJY, Wu Q, Wallace LC, Prager BC, Sanvoranart T, Gimple RC, Wang X, Mack SC, Miller TE, Huang P, Valentim CL, Zhou QG, et al. Targeting glioma stem cells through combined BMI1 and EZH2 inhibition. Nat Med. 2017; 23:1352–61. https://doi.org/10.1038/nm.4415 [PubMed]
-
16.
Liu S, Dontu G, Mantle ID, Patel S, Ahn NS, Jackson KW, Suri P, Wicha MS. Hedgehog signaling and Bmi-1 regulate self-renewal of normal and malignant human mammary stem cells. Cancer Res. 2006; 66:6063–71. https://doi.org/10.1158/0008-5472.CAN-06-0054 [PubMed]
-
17.
Zhu Y, Yu F, Jiao Y, Feng J, Tang W, Yao H, Gong C, Chen J, Su F, Zhang Y, Song E. Reduced miR-128 in breast tumor-initiating cells induces chemotherapeutic resistance via Bmi-1 and ABCC5. Clin Cancer Res. 2011; 17:7105–15. https://doi.org/10.1158/1078-0432.CCR-11-0071 [PubMed]
-
18.
Bansal N, Bartucci M, Yusuff S, Davis S, Flaherty K, Huselid E, Patrizii M, Jones D, Cao L, Sydorenko N, Moon YC, Zhong H, Medina DJ, et al. BMI-1 Targeting Interferes with Patient-Derived Tumor-Initiating Cell Survival and Tumor Growth in Prostate Cancer. Clin Cancer Res. 2016; 22:6176–91. https://doi.org/10.1158/1078-0432.CCR-15-3107 [PubMed]
-
19.
Jin M, Zhang T, Liu C, Badeaux MA, Liu B, Liu R, Jeter C, Chen X, Vlassov AV, Tang DG. miRNA-128 suppresses prostate cancer by inhibiting BMI-1 to inhibit tumor-initiating cells. Cancer Res. 2014; 74:4183–95. https://doi.org/10.1158/0008-5472.CAN-14-0404 [PubMed]
-
20.
Chen D, Wu M, Li Y, Chang I, Yuan Q, Ekimyan-Salvo M, Deng P, Yu B, Yu Y, Dong J, Szymanski JM, Ramadoss S, Li J, Wang CY. Targeting BMI1+ Cancer Stem Cells Overcomes Chemoresistance and Inhibits Metastases in Squamous Cell Carcinoma. Cell Stem Cell. 2017; 20:621–34.e6. https://doi.org/10.1016/j.stem.2017.02.003 [PubMed]
-
21.
Manoranjan B, Wang X, Hallett RM, Venugopal C, Mack SC, McFarlane N, Nolte SM, Scheinemann K, Gunnarsson T, Hassell JA, Taylor MD, Lee C, Triscott J, et al. FoxG1 interacts with Bmi1 to regulate self-renewal and tumorigenicity of medulloblastoma stem cells. Stem Cells. 2013; 31:1266–77. https://doi.org/10.1002/stem.1401 [PubMed]
-
22.
Song LB, Zeng MS, Liao WT, Zhang L, Mo HY, Liu WL, Shao JY, Wu QL, Li MZ, Xia YF, Fu LW, Huang WL, Dimri GP, et al. Bmi-1 is a novel molecular marker of nasopharyngeal carcinoma progression and immortalizes primary human nasopharyngeal epithelial cells. Cancer Res. 2006; 66:6225–32. https://doi.org/10.1158/0008-5472.CAN-06-0094 [PubMed]
-
23.
Song LB, Li J, Liao WT, Feng Y, Yu CP, Hu LJ, Kong QL, Xu LH, Zhang X, Liu WL, Li MZ, Zhang L, Kang TB, et al. The polycomb group protein Bmi-1 represses the tumor suppressor PTEN and induces epithelial-mesenchymal transition in human nasopharyngeal epithelial cells. J Clin Invest. 2009; 119:3626–36. https://doi.org/10.1172/JCI39374 [PubMed]
-
24.
Alajez NM, Shi W, Hui AB, Yue S, Ng R, Lo KW, Bastianutto C, O'Sullivan B, Gullane P, Liu FF. Targeted depletion of BMI1 sensitizes tumor cells to P53-mediated apoptosis in response to radiation therapy. Cell Death Differ. 2009; 16:1469–79. https://doi.org/10.1038/cdd.2009.85 [PubMed]
-
25.
Qin L, Zhang X, Zhang L, Feng Y, Weng GX, Li MZ, Kong QL, Qian CN, Zeng YX, Zeng MS, Liao DF, Song LB. Downregulation of BMI-1 enhances 5-fluorouracil-induced apoptosis in nasopharyngeal carcinoma cells. Biochem Biophys Res Commun. 2008; 371:531–5. https://doi.org/10.1016/j.bbrc.2008.04.117 [PubMed]
-
26.
Xu XH, Liu XY, Su J, Li DJ, Huang Q, Lu MQ, Yi F, Ren JH, Chen WH. ShRNA targeting Bmi-1 sensitizes CD44+ nasopharyngeal cancer stem-like cells to radiotherapy. Oncol Rep. 2014; 32:764–70. https://doi.org/10.3892/or.2014.3267 [PubMed]
-
27.
Xu XH, Liu Y, Li DJ, Hu J, Su J, Huang Q, Lu MQ, Yi F, Bao D, Fu YZ. Effect of shRNA-Mediated Gene Silencing of Bmi-1 Expression on Chemosensitivity of CD44+ Nasopharyngeal Carcinoma Cancer Stem-Like Cells. Technol Cancer Res Treat. 2016; 15:NP27–39. https://doi.org/10.1177/1533034615599461 [PubMed]
-
28.
Tong YQ, Liu B, Huang J, Liu Y, Guo FJ, Zhou GH, Xie PL, Li YH, Hu JY, Li GC. BMI-1 autoantibody in serum as a new potential biomarker of nasopharyngeal carcinoma. Cancer Biol Ther. 2008; 7:340–4. https://doi.org/10.4161/cbt.7.3.5422 [PubMed]
-
29.
Feder JN, Li L, Jan LY, Jan YN. Genomic cloning and chromosomal localization of HRY, the human homolog to the Drosophila segmentation gene, hairy. Genomics. 1994; 20:56–61. https://doi.org/10.1006/geno.1994.1126 [PubMed]
-
30.
Kageyama R, Ohtsuka T, Kobayashi T. The Hes gene family: repressors and oscillators that orchestrate embryogenesis. Development. 2007; 134:1243–51. https://doi.org/10.1242/dev.000786 [PubMed]
-
31.
Kunisato A, Chiba S, Nakagami-Yamaguchi E, Kumano K, Saito T, Masuda S, Yamaguchi T, Osawa M, Kageyama R, Nakauchi H, Nishikawa M, Hirai H. HES-1 preserves purified hematopoietic stem cells ex vivo and accumulates side population cells in vivo. Blood. 2003; 101:1777–83. https://doi.org/10.1182/blood-2002-07-2051 [PubMed]
-
32.
Kayahara T, Sawada M, Takaishi S, Fukui H, Seno H, Fukuzawa H, Suzuki K, Hiai H, Kageyama R, Okano H, Chiba T. Candidate markers for stem and early progenitor cells, Musashi-1 and Hes1, are expressed in crypt base columnar cells of mouse small intestine. FEBS Lett. 2003; 535:131–5. https://doi.org/10.1016/s0014-5793(02)03896-6 [PubMed]
-
33.
Riccio O, van Gijn ME, Bezdek AC, Pellegrinet L, van Es JH, Zimber-Strobl U, Strobl LJ, Honjo T, Clevers H, Radtke F. Loss of intestinal crypt progenitor cells owing to inactivation of both Notch1 and Notch2 is accompanied by derepression of CDK inhibitors p27Kip1 and p57Kip2. EMBO Rep. 2008; 9:377–83. https://doi.org/10.1038/embor.2008.7 [PubMed]
-
34.
Moriyama M, Osawa M, Mak SS, Ohtsuka T, Yamamoto N, Han H, Delmas V, Kageyama R, Beermann F, Larue L, Nishikawa S. Notch signaling via Hes1 transcription factor maintains survival of melanoblasts and melanocyte stem cells. J Cell Biol. 2006; 173:333–9. https://doi.org/10.1083/jcb.200509084 [PubMed]
-
35.
Stanger BZ, Stiles B, Lauwers GY, Bardeesy N, Mendoza M, Wang Y, Greenwood A, Cheng KH, McLaughlin M, Brown D, Depinho RA, Wu H, Melton DA, Dor Y. Pten constrains centroacinar cell expansion and malignant transformation in the pancreas. Cancer Cell. 2005; 8:185–95. https://doi.org/10.1016/j.ccr.2005.07.015 [PubMed]
-
36.
Cui M, Cai Z, Awadallah A, Xin W. Uniform and Robust Nuclear Expression of HES1 in Neuroendocrine Neoplasms. Int J Surg Pathol. 2019; 27:844–51. https://doi.org/10.1177/1066896919854166 [PubMed]
-
37.
Huang XY, Gan RH, Xie J, She L, Zhao Y, Ding LC, Su BH, Zheng DL, Lu YG. The oncogenic effects of HES1 on salivary adenoid cystic carcinoma cell growth and metastasis. BMC Cancer. 2018; 18:436. https://doi.org/10.1186/s12885-018-4350-5 [PubMed]
-
38.
Roy S, Majumdar AP. Signaling in colon cancer stem cells. J Mol Signal. 2012; 7:11. https://doi.org/10.1186/1750-2187-7-11 [PubMed]
-
39.
Katoh M, Katoh M. Notch signaling in gastrointestinal tract (review). Int J Oncol. 2007; 30:247–51. [PubMed]
-
40.
Garzia L, Andolfo I, Cusanelli E, Marino N, Petrosino G, De Martino D, Esposito V, Galeone A, Navas L, Esposito S, Gargiulo S, Fattet S, Donofrio V, et al. MicroRNA-199b-5p impairs cancer stem cells through negative regulation of HES1 in medulloblastoma. PLoS One. 2009; 4:e4998. https://doi.org/10.1371/journal.pone.0004998 [PubMed]
-
41.
Lee SH, Hong HS, Liu ZX, Kim RH, Kang MK, Park NH, Shin KH. TNFα enhances cancer stem cell-like phenotype via Notch-Hes1 activation in oral squamous cell carcinoma cells. Biochem Biophys Res Commun. 2012; 424:58–64. https://doi.org/10.1016/j.bbrc.2012.06.065 [PubMed]
-
42.
Gao F, Huang W, Zhang Y, Tang S, Zheng L, Ma F, Wang Y, Tang H, Li X. Hes1 promotes cell proliferation and migration by activating Bmi-1 and PTEN/Akt/GSK3β pathway in human colon cancer. Oncotarget. 2015; 6:38667–80. https://doi.org/10.18632/oncotarget.5484 [PubMed]
-
43.
McAuliffe SM, Morgan SL, Wyant GA, Tran LT, Muto KW, Chen YS, Chin KT, Partridge JC, Poole BB, Cheng KH, Daggett J Jr, Cullen K, Kantoff E, et al. Targeting Notch, a key pathway for ovarian cancer stem cells, sensitizes tumors to platinum therapy. Proc Natl Acad Sci U S A. 2012; 109:E2939–48. https://doi.org/10.1073/pnas.1206400109 [PubMed]
-
44.
Liu YP, Yang CJ, Huang MS, Yeh CT, Wu AT, Lee YC, Lai TC, Lee CH, Hsiao YW, Lu J, Shen CN, Lu PJ, Hsiao M. Cisplatin selects for multidrug-resistant CD133+ cells in lung adenocarcinoma by activating Notch signaling. Cancer Res. 2013; 73:406–16. https://doi.org/10.1158/0008-5472.CAN-12-1733 [PubMed]
-
45.
Thiery JP, Sleeman JP. Complex networks orchestrate epithelial-mesenchymal transitions. Nat Rev Mol Cell Biol. 2006; 7:131–42. https://doi.org/10.1038/nrm1835 [PubMed]
-
46.
Gao F, Zhang Y, Wang S, Liu Y, Zheng L, Yang J, Huang W, Ye Y, Luo W, Xiao D. Hes1 is involved in the self-renewal and tumourigenicity of stem-like cancer cells in colon cancer. Sci Rep. 2014; 4:3963. https://doi.org/10.1038/srep03963 [PubMed]
-
47.
Li X, Li Y, Du X, Wang X, Guan S, Cao Y, Jin F, Li F. HES1 promotes breast cancer stem cells by elevating Slug in triple-negative breast cancer. Int J Biol Sci. 2021; 17:247–58. https://doi.org/10.7150/ijbs.53477 [PubMed]
-
48.
Riya PA, Basu B, Surya S, Parvathy S, Lalitha S, Jyothi NP, Meera V, Jaikumar VS, Sunitha P, Shahina A, Sukumaran R, Nair AS, Dhanesh SB, et al. HES1 promoter activation dynamics reveal the plasticity, stemness and heterogeneity in neuroblastoma cancer stem cells. J Cell Sci. 2022; 135:jcs260157. https://doi.org/10.1242/jcs.260157 [PubMed]
-
49.
Tyagi A, Vishnoi K, Mahata S, Verma G, Srivastava Y, Masaldan S, Roy BG, Bharti AC, Das BC. Cervical Cancer Stem Cells Selectively Overexpress HPV Oncoprotein E6 that Controls Stemness and Self-Renewal through Upregulation of HES1. Clin Cancer Res. 2016; 22:4170–84. https://doi.org/10.1158/1078-0432.CCR-15-2574 [PubMed]
-
50.
Liu ZH, Dai XM, Du B. Hes1: a key role in stemness, metastasis and multidrug resistance. Cancer Biol Ther. 2015; 16:353–9. https://doi.org/10.1080/15384047.2015.1016662 [PubMed]
-
51.
Wang SC, Lin XL, Wang HY, Qin YJ, Chen L, Li J, Jia JS, Shen HF, Yang S, Xie RY, Wei F, Gao F, Rong XX, et al. Hes1 triggers epithelial-mesenchymal transition (EMT)-like cellular marker alterations and promotes invasion and metastasis of nasopharyngeal carcinoma by activating the PTEN/AKT pathway. Oncotarget. 2015; 6:36713–30. https://doi.org/10.18632/oncotarget.5457 [PubMed]
-
52.
Xu X, Liu Y, Su J, Li D, Hu J, Huang Q, Lu M, Liu X, Ren J, Chen W, Sun L. Downregulation of Bmi-1 is associated with suppressed tumorigenesis and induced apoptosis in CD44+ nasopharyngeal carcinoma cancer stem-like cells. Oncol Rep. 2016; 35:923–31. https://doi.org/10.3892/or.2015.4414 [PubMed]
-
53.
Bakhshinyan D, Venugopal C, Adile AA, Garg N, Manoranjan B, Hallett R, Wang X, Mahendram S, Vora P, Vijayakumar T, Subapanditha M, Singh M, Kameda-Smith MM, et al. BMI1 is a therapeutic target in recurrent medulloblastoma. Oncogene. 2019; 38:1702–16. https://doi.org/10.1038/s41388-018-0549-9 [PubMed]
-
54.
Buechel M, Dey A, Dwivedi SKD, Crim A, Ding K, Zhang R, Mukherjee P, Moore KN, Cao L, Branstrom A, Weetall M, Baird J, Bhattacharya R. Inhibition of BMI1, a Therapeutic Approach in Endometrial Cancer. Mol Cancer Ther. 2018; 17:2136–43. https://doi.org/10.1158/1535-7163.MCT-17-1192 [PubMed]
-
55.
Dey A, Xiong X, Crim A, Dwivedi SKD, Mustafi SB, Mukherjee P, Cao L, Sydorenko N, Baiazitov R, Moon YC, Dumble M, Davis T, Bhattacharya R. Evaluating the Mechanism and Therapeutic Potential of PTC-028, a Novel Inhibitor of BMI-1 Function in Ovarian Cancer. Mol Cancer Ther. 2018; 17:39–49. https://doi.org/10.1158/1535-7163.MCT-17-0574 [PubMed]
-
56.
Ganaie AA, Beigh FH, Astone M, Ferrari MG, Maqbool R, Umbreen S, Parray AS, Siddique HR, Hussain T, Murugan P, Morrissey C, Koochekpour S, Deng Y, et al. BMI1 Drives Metastasis of Prostate Cancer in Caucasian and African-American Men and Is A Potential Therapeutic Target: Hypothesis Tested in Race-specific Models. Clin Cancer Res. 2018; 24:6421–32. https://doi.org/10.1158/1078-0432.CCR-18-1394 [PubMed]
-
57.
Kong Y, Ai C, Dong F, Xia X, Zhao X, Yang C, Kang C, Zhou Y, Zhao Q, Sun X, Wu X. Targeting of BMI-1 with PTC-209 inhibits glioblastoma development. Cell Cycle. 2018; 17:1199–211. https://doi.org/10.1080/15384101.2018.1469872 [PubMed]
-
58.
Nishida Y, Maeda A, Kim MJ, Cao L, Kubota Y, Ishizawa J, AlRawi A, Kato Y, Iwama A, Fujisawa M, Matsue K, Weetall M, Dumble M, et al. The novel BMI-1 inhibitor PTC596 downregulates MCL-1 and induces p53-independent mitochondrial apoptosis in acute myeloid leukemia progenitor cells. Blood Cancer J. 2017; 7:e527. https://doi.org/10.1038/bcj.2017.8 [PubMed]
-
59.
Yoo YA, Vatapalli R, Lysy B, Mok H, Desouki MM, Abdulkadir SA. The Role of Castration-Resistant Bmi1+Sox2+ Cells in Driving Recurrence in Prostate Cancer. J Natl Cancer Inst. 2019; 111:311–21. https://doi.org/10.1093/jnci/djy142 [PubMed]
-
60.
Farnie G, Clarke RB, Spence K, Pinnock N, Brennan K, Anderson NG, Bundred NJ. Novel cell culture technique for primary ductal carcinoma in situ: role of Notch and epidermal growth factor receptor signaling pathways. J Natl Cancer Inst. 2007; 99:616–27. https://doi.org/10.1093/jnci/djk133 [PubMed]
-
61.
Candy PA, Phillips MR, Redfern AD, Colley SM, Davidson JA, Stuart LM, Wood BA, Zeps N, Leedman PJ. Notch-induced transcription factors are predictive of survival and 5-fluorouracil response in colorectal cancer patients. Br J Cancer. 2013; 109:1023–30. https://doi.org/10.1038/bjc.2013.431 [PubMed]
-
62.
Peignon G, Durand A, Cacheux W, Ayrault O, Terris B, Laurent-Puig P, Shroyer NF, Van Seuningen I, Honjo T, Perret C, Romagnolo B. Complex interplay between β-catenin signalling and Notch effectors in intestinal tumorigenesis. Gut. 2011; 60:166–76. https://doi.org/10.1136/gut.2009.204719 [PubMed]
-
63.
Chen L, Zhang W, Yan W, Han L, Zhang K, Shi Z, Zhang J, Wang Y, Li Y, Yu S, Pu P, Jiang C, Jiang T, Kang C. The putative tumor suppressor miR-524-5p directly targets Jagged-1 and Hes-1 in glioma. Carcinogenesis. 2012; 33:2276–82. https://doi.org/10.1093/carcin/bgs261 [PubMed]
-
64.
Sun W, Gaykalova DA, Ochs MF, Mambo E, Arnaoutakis D, Liu Y, Loyo M, Agrawal N, Howard J, Li R, Ahn S, Fertig E, Sidransky D, et al. Activation of the NOTCH pathway in head and neck cancer. Cancer Res. 2014; 74:1091–104. https://doi.org/10.1158/0008-5472.CAN-13-1259 [PubMed]
-
65.
Giovannini C, Gramantieri L, Minguzzi M, Fornari F, Chieco P, Grazi GL, Bolondi L. CDKN1C/P57 is regulated by the Notch target gene Hes1 and induces senescence in human hepatocellular carcinoma. Am J Pathol. 2012; 181:413–22. https://doi.org/10.1016/j.ajpath.2012.04.019 [PubMed]
-
66.
Konishi J, Kawaguchi KS, Vo H, Haruki N, Gonzalez A, Carbone DP, Dang TP. Gamma-secretase inhibitor prevents Notch3 activation and reduces proliferation in human lung cancers. Cancer Res. 2007; 67:8051–7. https://doi.org/10.1158/0008-5472.CAN-07-1022 [PubMed]
-
67.
Fiaschetti G, Abela L, Nonoguchi N, Dubuc AM, Remke M, Boro A, Grunder E, Siler U, Ohgaki H, Taylor MD, Baumgartner M, Shalaby T, Grotzer MA. Epigenetic silencing of miRNA-9 is associated with HES1 oncogenic activity and poor prognosis of medulloblastoma. Br J Cancer. 2014; 110:636–47. https://doi.org/10.1038/bjc.2013.764 [PubMed]
-
68.
Cuevas IC, Slocum AL, Jun P, Costello JF, Bollen AW, Riggins GJ, McDermott MW, Lal A. Meningioma transcript profiles reveal deregulated Notch signaling pathway. Cancer Res. 2005; 65:5070–5. https://doi.org/10.1158/0008-5472.CAN-05-0240 [PubMed]
-
69.
Hopfer O, Zwahlen D, Fey MF, Aebi S. The Notch pathway in ovarian carcinomas and adenomas. Br J Cancer. 2005; 93:709–18. https://doi.org/10.1038/sj.bjc.6602719 [PubMed]
-
70.
Sang L, Coller HA, Roberts JM. Control of the reversibility of cellular quiescence by the transcriptional repressor HES1. Science. 2008; 321:1095–100. https://doi.org/10.1126/science.1155998 [PubMed]
-
71.
Lin J, Zhai S, Zou S, Xu Z, Zhang J, Jiang L, Deng X, Chen H, Peng C, Zhang J, Shen B. Positive feedback between lncRNA FLVCR1-AS1 and KLF10 may inhibit pancreatic cancer progression via the PTEN/AKT pathway. J Exp Clin Cancer Res. 2021; 40:316. https://doi.org/10.1186/s13046-021-02097-0 [PubMed]
-
72.
Mu M, Niu W, Zhang X, Hu S, Niu C. LncRNA BCYRN1 inhibits glioma tumorigenesis by competitively binding with miR-619-5p to regulate CUEDC2 expression and the PTEN/AKT/p21 pathway. Oncogene. 2020; 39:6879–92. https://doi.org/10.1038/s41388-020-01466-x [PubMed]
-
73.
He Y, Yue H, Cheng Y, Ding Z, Xu Z, Lv C, Wang Z, Wang J, Yin C, Hao H, Chen C. ALKBH5-mediated m6A demethylation of KCNK15-AS1 inhibits pancreatic cancer progression via regulating KCNK15 and PTEN/AKT signaling. Cell Death Dis. 2021; 12:1121. https://doi.org/10.1038/s41419-021-04401-4 [PubMed]
-
74.
Li C, Li X. circPTEN suppresses colorectal cancer progression through regulating PTEN/AKT pathway. Mol Ther Nucleic Acids. 2021; 26:1418–32. https://doi.org/10.1016/j.omtn.2021.05.018 [PubMed]
-
75.
Chen WK, Zhang HJ, Zou MX, Wang C, Yan YG, Zhan XL, Li XL, Wang WJ. LncRNA HOTAIR influences cell proliferation via miR-130b/PTEN/AKT axis in IDD. Cell Cycle. 2022; 21:323–39. https://doi.org/10.1080/15384101.2021.2020042 [PubMed]
-
76.
Zhou H, Du Y, Wei X, Song C, Song J, Xu N, Huang W, Chen L, Yao F, Du D, Qiu C, Zhong L, Liu Y, et al. DDX56 transcriptionally activates MIST1 to facilitate tumorigenesis of HCC through PTEN-AKT signaling. Theranostics. 2022; 12:6069–87. https://doi.org/10.7150/thno.72471 [PubMed]
-
77.
Wang MH, Sun R, Zhou XM, Zhang MY, Lu JB, Yang Y, Zeng LS, Yang XZ, Shi L, Xiao RW, Wang HY, Mai SJ. Epithelial cell adhesion molecule overexpression regulates epithelial-mesenchymal transition, stemness and metastasis of nasopharyngeal carcinoma cells via the PTEN/AKT/mTOR pathway. Cell Death Dis. 2018; 9:2. https://doi.org/10.1038/s41419-017-0013-8 [PubMed]
-
78.
Hao WC, Zhong QL, Pang WQ, Dian MJ, Li J, Han LX, Zhao WT, Zhang XL, Xiao SJ, Xiao D, Lin XL, Jia JS. MST4 inhibits human hepatocellular carcinoma cell proliferation and induces cell cycle arrest via suppression of PI3K/AKT pathway. J Cancer. 2020; 11:5106–17. https://doi.org/10.7150/jca.45822 [PubMed]
-
79.
Li X, Zhao Z, Zhang X, Yang S, Lin X, Yang X, Lin X, Shi J, Wang S, Zhao W, Li J, Gao F, Liu M, et al. Klf4 reduces stemness phenotype, triggers mesenchymal-epithelial transition (MET)-like molecular changes, and prevents tumor progression in nasopharygeal carcinoma. Oncotarget. 2017; 8:93924–41. https://doi.org/10.18632/oncotarget.21370 [PubMed]
-
80.
Liu Y, Li YQ, Huang SH, Li YL, Xia JW, Jia JS, Wei F, Wang JH, Dai GQ, Wang YC, Li XY, Han LX, Zhang XL, et al. Liver-specific over-expression of Cripto-1 in transgenic mice promotes hepatocyte proliferation and deregulated expression of hepatocarcinogenesis-related genes and signaling pathways. Aging (Albany NY). 2021; 13:21155–90. https://doi.org/10.18632/aging.203402 [PubMed]
-
81.
Zhao WT, Lin XL, Liu Y, Han LX, Li J, Lin TY, Shi JW, Wang SC, Lian M, Chen HW, Sun Y, Xu K, Jia JS, et al. miR-26a promotes hepatocellular carcinoma invasion and metastasis by inhibiting PTEN and inhibits cell growth by repressing EZH2. Lab Invest. 2019; 99:1484–500. https://doi.org/10.1038/s41374-019-0270-5 [PubMed]
-
82.
Qin YJ, Lin TY, Lin XL, Liu Y, Zhao WT, Li XY, Lian M, Chen HW, Li YL, Zhang XL, Xiao D, Jia JS, Sun Y. Loss of PDK4 expression promotes proliferation, tumorigenicity, motility and invasion of hepatocellular carcinoma cells. J Cancer. 2020; 11:4397–405. https://doi.org/10.7150/jca.43459 [PubMed]
-
83.
Rong XX, Wei F, Lin XL, Qin YJ, Chen L, Wang HY, Shen HF, Jia LT, Xie RY, Lin TY, Hao WC, Yang J, Yang S, et al. Recognition and killing of cancer stem-like cell population in hepatocellular carcinoma cells by cytokine-induced killer cells via NKG2d-ligands recognition. Oncoimmunology. 2015; 5:e1086060. https://doi.org/10.1080/2162402X.2015.1086060 [PubMed]
-
84.
Wei F, Rong XX, Xie RY, Jia LT, Wang HY, Qin YJ, Chen L, Shen HF, Lin XL, Yang J, Yang S, Hao WC, Chen Y, et al. Cytokine-induced killer cells efficiently kill stem-like cancer cells of nasopharyngeal carcinoma via the NKG2D-ligands recognition. Oncotarget. 2015; 6:35023–39. https://doi.org/10.18632/oncotarget.5280 [PubMed]
-
85.
Xiao D, Fang TX, Lei Y, Xiao SJ, Xia JW, Lin TY, Li YL, Zhai JX, Li XY, Huang SH, Jia JS, Tian YG, Lin XL, et al. m6A demethylase ALKBH5 suppression contributes to esophageal squamous cell carcinoma progression. Aging (Albany NY). 2021; 13:21497–512. https://doi.org/10.18632/aging.203490 [PubMed]
-
86.
Wang SC, Lin XL, Li J, Zhang TT, Wang HY, Shi JW, Yang S, Zhao WT, Xie RY, Wei F, Qin YJ, Chen L, Yang J, et al. MicroRNA-122 triggers mesenchymal-epithelial transition and suppresses hepatocellular carcinoma cell motility and invasion by targeting RhoA. PLoS One. 2014; 9:e101330. https://doi.org/10.1371/journal.pone.0101330 [PubMed]
-
87.
Dian MJ, Li J, Zhang XL, Li ZJ, Zhou Y, Zhou W, Zhong QL, Pang WQ, Lin XL, Liu T, Liu YA, Li YL, Han LX, et al. MST4 negatively regulates the EMT, invasion and metastasis of HCC cells by inactivating PI3K/AKT/Snail1 axis. J Cancer. 2021; 12:4463–77. https://doi.org/10.7150/jca.60008 [PubMed]