


Introduction
A-kinase anchoring proteins (AKAPs) are a family of proteins with different structures and related functions [1]. Their main function is to anchor cyclic adenosine monophosphate (cAMP)-dependent protein kinase A to specific subcellular structures [2]. In addition, AKAPs play a key role in creating spatial boundaries for the combination of multiple signals. AKAPs serve as an organizing center for various protein kinases and phosphatases in G protein-coupled receptors, creating a signal device that can send signals, regulate and transport within cells [1, 3]. Therefore, AKAPs involve many biological processes [4–6]. Recently, studies have verified that AKAPs may regulate the proliferation, invasion as well as survival of tumor cells and play different roles in different cancers [7, 8].
With the gradual deepening of the research on AKAPs gene, the functions of AKAP family members have garnered attention from many researchers. AKAP8 belongs to the AKAP family and participates in a variety of biological processes [9]. Some studies have proved that the zinc finger domain (ZF) of AKAP8 could combine with lots of factors in RNA processing / transcription to regulate biological processes such as transcription and RNA splicing [10, 11]. Sho et al. demonstrated that AKAP8 participated in the regulation of chromatin structure changes through nuclear tyrosine phosphorylation [12]. Recent studies have confirmed that AKAP8 could suppress the metastasis of tumors via adjusting the splicing isomer of CLSTN1, a molecule that controls epithelial mesenchymal transition [13]. Despite of that, Li et al. confirmed that AKAP8 might promote tumorigenesis by forming a liquid condensate in the nucleus of cancer and modulating selective splicing [14].
The protein sequence of AKAP8L exhibits a similarity of up to 61% with that of AKAP8, suggesting that AKAP8L and AKAP8 may have similar functions in tumor genesis and metastasis. It has been previously proved that the high AKAP8L expression is associated with poor prognosis in esophageal squamous cell carcinoma, serving as an independent prognostic factor for the disease [9]. Zhang et al. found that AKAP8L can enhance the dryness and chemoresistance of gastric cancer cells by stabilizing the expression of SCD1 mRNA [15]. A previous study proved that AKAP8L can promote cell growth by interacting with mTORC1 [16].
As previously reported, AKAP8L may play a part in different cancers. Currently, there has been limited research on the role of AKAP8L in various types of malignancies. Thus, its function in most types of cancers remains unclear. To gain a comprehensive understanding of AKAP8L, we explored its expression as well as biological function of AKAP8L across various types of cancer, with a focus on its potential as a marker for early diagnosis and outcome prediction. We found that AKAP8L was up-regulated or down-regulated in 14 human cancers, and its expression varied across molecular subtypes of 11 cancer types as well as immune subtypes of 7 cancer types. Furthermore, AKAP8L exhibited a strong predictive value for the identification of testicular germ cell tumors (TGCT), liver hepatocellular carcinoma (LIHC), rectum adenocarcinoma (READ) and colon adenocarcinoma (COAD), and has significant correlation with the total survival rate (OS), disease-specific survival rate (DSS) and progression-free interval (PFI) of COAD, kidney renal clear cell carcinoma (KIRC), kidney renal papillary cell carcinoma (KIRP), as well as prostate adenocarcinoma (PRAD). Then, we laid an emphasis on KIRC and determine AKAP8L as the independent risk factor of OS, DSS as well as PFI in uterine corpus endometrial cancer (UCEC). Besides, we conducted further analyses on the co-expression genes related to AKAP8L, as well as the differentially expressed genes (DEG) between the high and low expression groups of AKAP8L. In conclusion, AKAP8L has the potential to serve as a valuable biomarker for the early diagnosis and outcome prediction of pancancer and may represent a prospective molecular target of KIRC.
Results
AKAP8L expression in pan-cancer
HPA database was adopted to analyze AKAP8L expression within normal tissues, which revealed the expression of AKAP8L in the majority of normal tissues, with the highest in the skeletal muscle (Figure 1A). Similarly, AKAP8L was also expressed among most tumor cell lines (Figure 1B). Compared to adjacent normal tissues using TCGA datasets, a significant up-regulation of AKAP8L expression was observed in 12 cancer types, such as bladder urothelial carcinoma (BLCA), breast invasive carcinoma (BRCA), cholangiocarcinoma (CHOL), COAD, esophageal carcinoma (ESCA), head and neck squamous cell carcinoma (HNSC), renal chromophobe (HNSC), KIRC, LIHC, lung squamous cell carcinoma (LUSC), READ, and stomach adenocarcinoma (STAD) (Figure 1C). In addition, compared to non-adjacent normal tissues using TCGA datasets, a significant up-regulation of AKAP8L expression was observed in 14 cancer types, such as BRCA, CHOL, COAD, ESCA, HNSC, KICH, KIRC, kidney renal papillary cell carcinoma (KIRP), LIHC, Lung adenocarcinoma (LUAD), LUSC, Prostate adenocarcinoma (PRAD), READ, as well as STAD (Figure 1D).
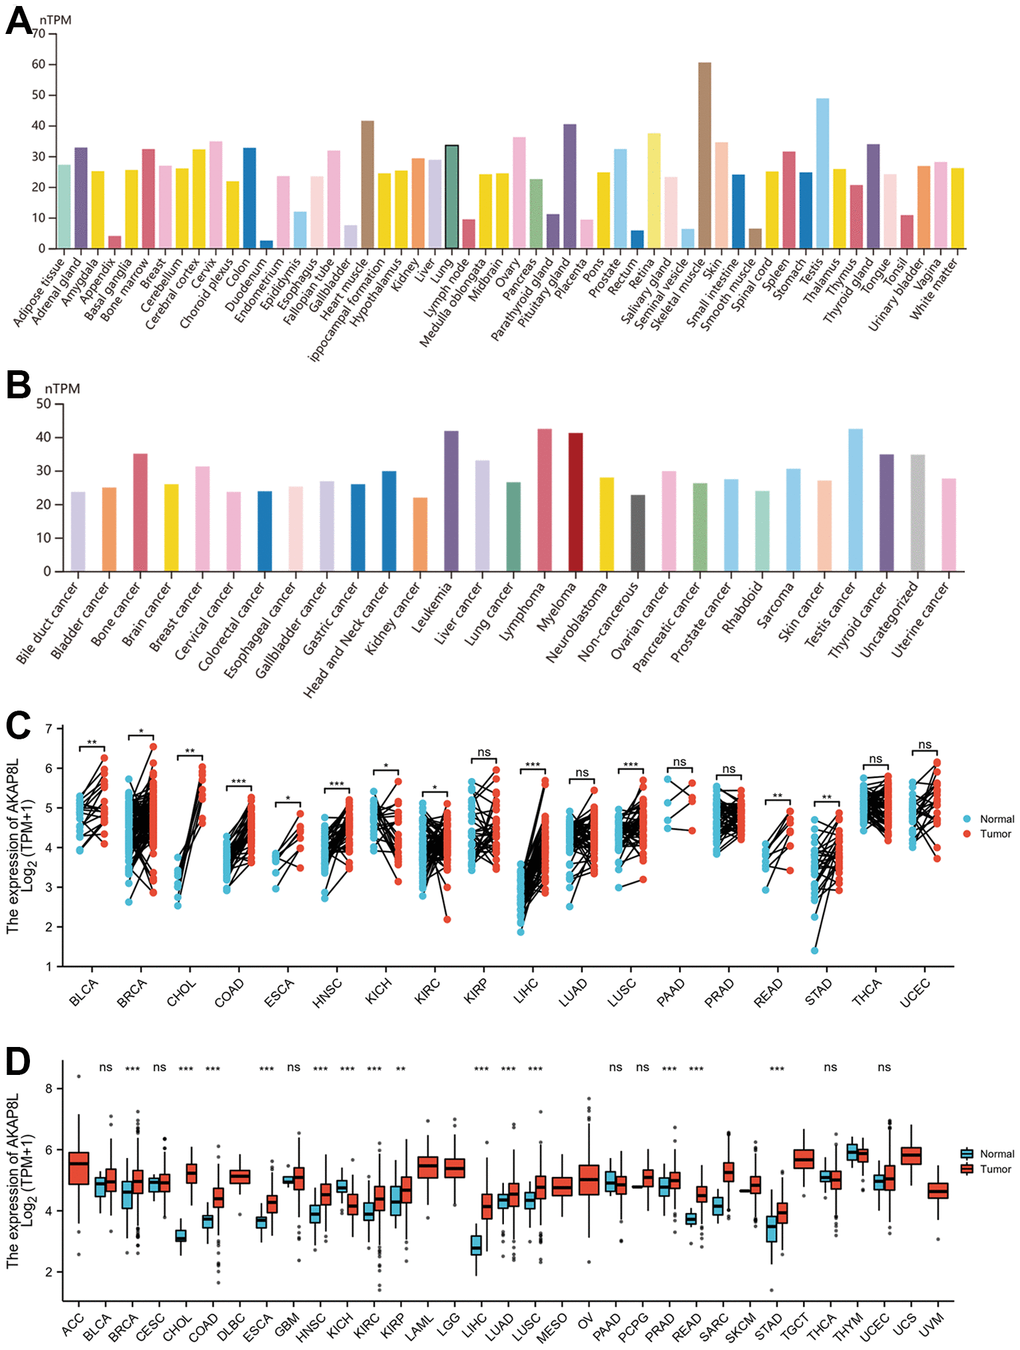
Figure 1. Expression level of AKAP8L gene in tumors and normal tissues. (A) AKAP8L expression in normal tissues; (B) AKAP8L expression in tumor cell lines; (C) AKAP8L expression in TCGA tumors and adjacent normal tissues; (D) AKAP8L expression in TCGA tumors and normal tissues (*p < 0.05, **p < 0.01, ***p < 0.001).
Association of AKAP8L with molecular or immune subtypes of cancers/carcinoma
TISDB database was adopted to analyze the association of AKAP8L expression with molecular subtypes across various types of cancer, and our results indicated that AKAP8L expression was significantly varied among distinct molecular subtypes of 11 cancer types (UCEC, BRCA, LUSC, OV, LGG, STAD, KIRP, ACC, COAD and glioblastoma multiforme [GBM]).
In addition, AKAP8L expression was the highest in the subtypes of CN_ HIGH, LumA, primitive molecular subtypes, classical molecular subtypes, proliferative subtypes, G-CIMP-low subtypes, CIN molecular subtypes, C2a molecular subtypes, CIMP-high subtypes, CIN molecular subtypes, and Classic-like subtypes (Figure 2A–2K) for UCEC (P=7.68e-21), BRCA (P=2.46e-07), LUSC (P=4.83e-02), HNSC (P=1.63e-03), OV (P=6.32e-09), LGG (P=6.29e-08), STAD (P=8.92e-05), KIRP (P=4.74e-02), ACC (P=8.63e-05), COAD (P=3.42e-06), and GBM (P=8.89e-03), respectively.
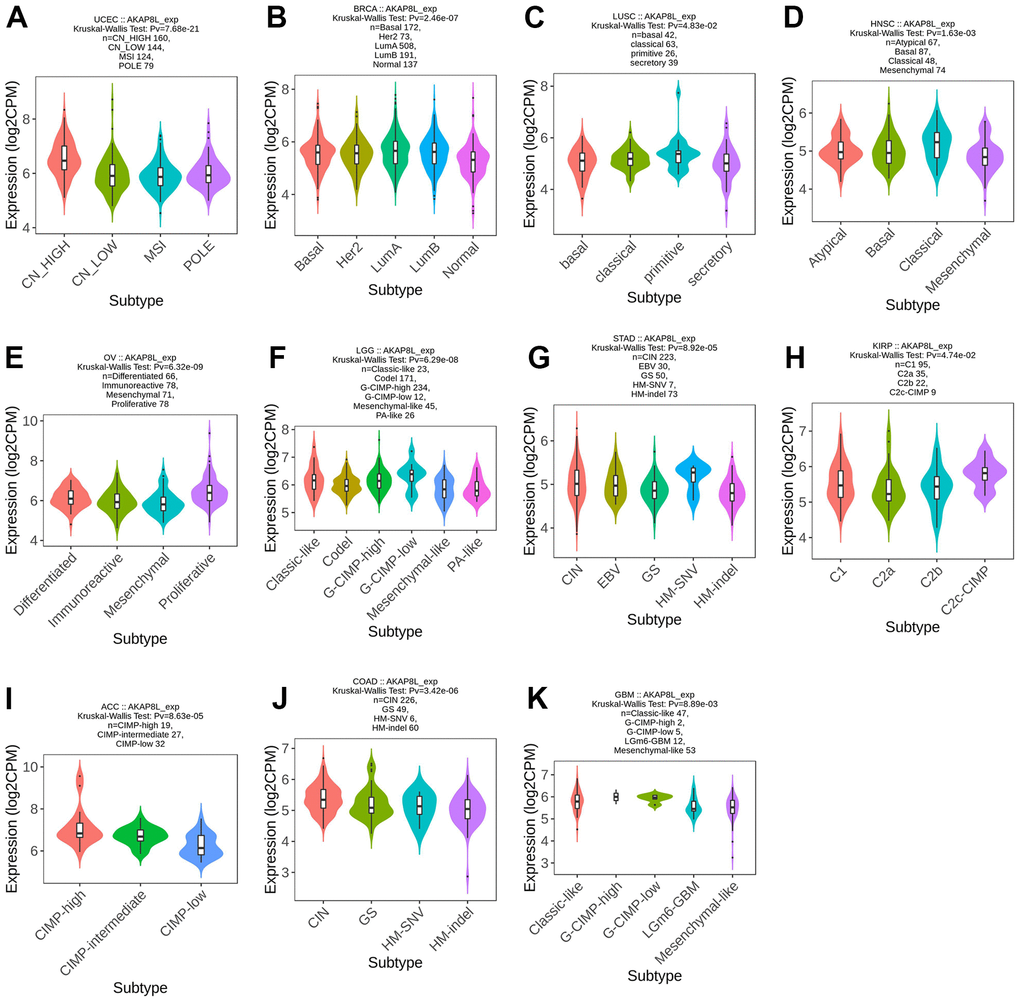
Figure 2. Correlations between AKAP8L expression and molecular subtypes across TCGA tumors. (A) UCEC; (B) BRCA; (C) LUSC; (D) HNSC; (E) OV; (F) LGG; (G) STAD; (H) KIRP; (I) ACC; (J) COAD; (K) GBM.
Meanwhile, AKAP8L expression was found to be related to different immune subtypes (C1: wound healing, C2: IFN- γ Dominant, C3: inflammation, C4: lymphocyte depletion, C5: immune silence, C6: TGF-b dominance) of 7 tumor types, including BLCA (P=2.35e-05), KICH (P=3.25e-02), KIRC (P=9.01e-03), HNSC (P=3.17e-02), LICH (P=5.39e-03), COAD (P=2.4e-02), and BRCA (P=2.03e-02) (Figure 3A–3G).
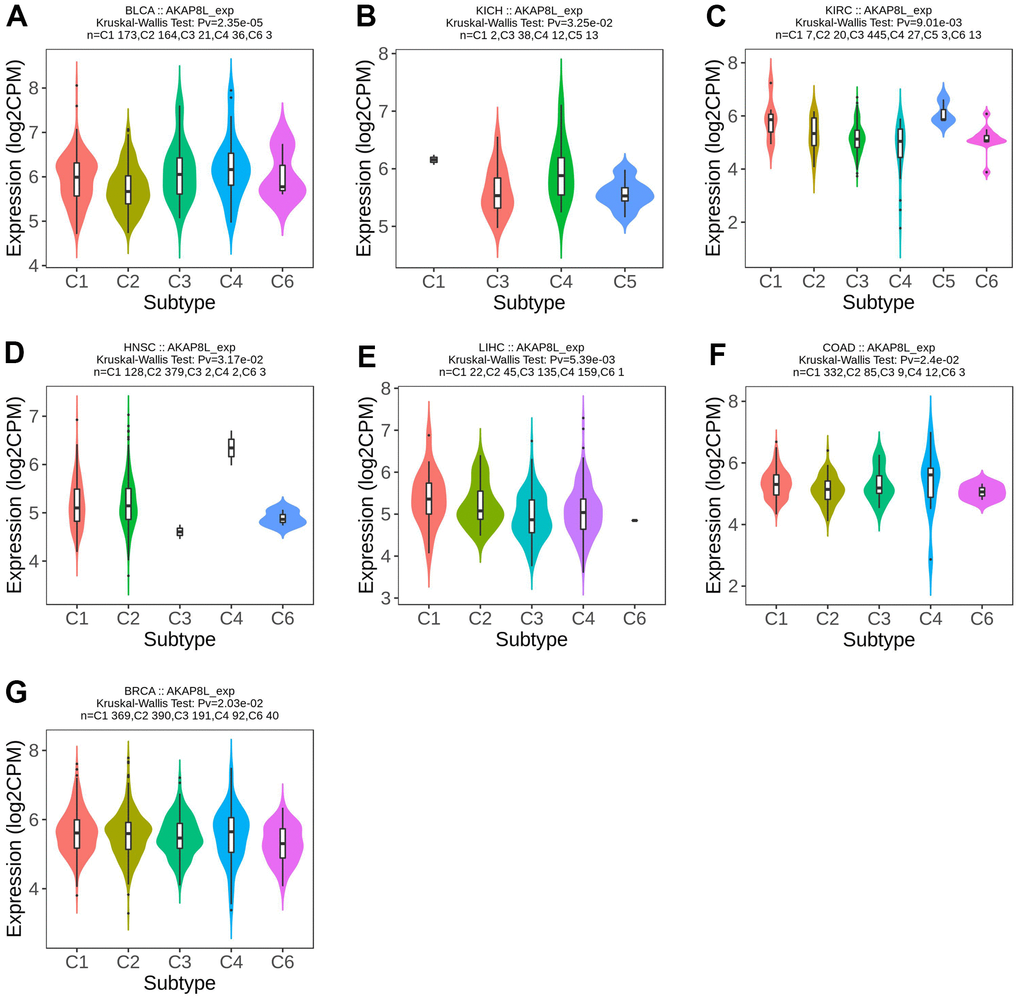
Figure 3. Correlations between AKAP8L expression and immune subtypes across TCGA tumors. (A) BLCA; (B) KICH; (C) KIRC; (D) HNSC; (E) LICH; (F) COAD; (G) BRCA.
AKAP8L promoter methylation level in pan-cancer
UALCAN database was adopted for the assessment of the methylation level of AKAP8L across various types of cancer [17, 18] and found a close relationship between the methylation of AKAP8L promoter and the progression of various tumors, including BLCA, CHOL, KIRP, KIRC, LIHC and LUSC. We found that AKAP8L promoter was hypermethylated in CHOL (Figure 4B), KIRP (Figure 4C), KIRC (Figure 4D) and LIHC (Figure 4E); in contrast, AKAP8L promoter was hypomethylated in BLCA (Figure 4A) as well as LUSC (Figure 4F).
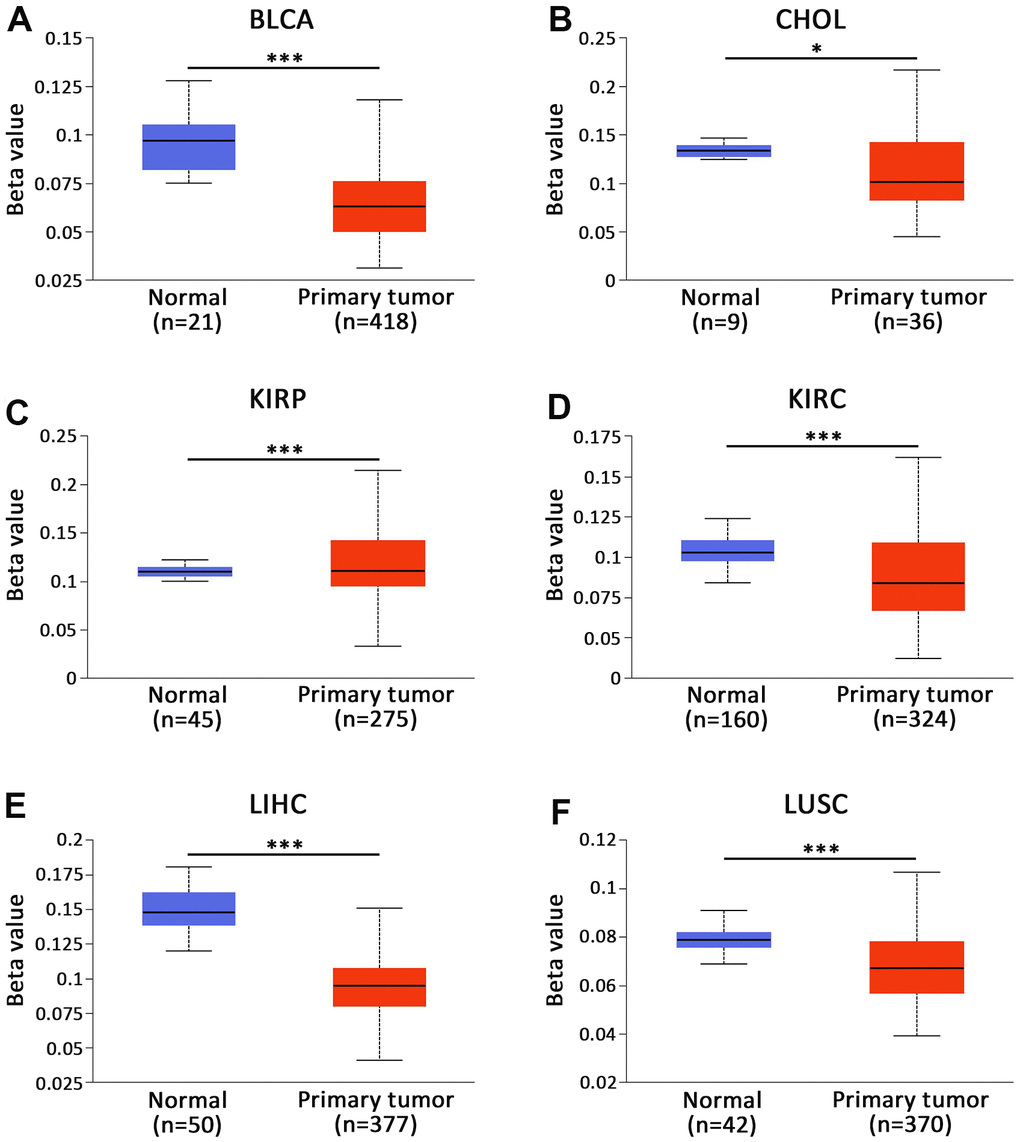
Figure 4. Promoter methylation status of CBXs in BLCA (UALCAN). The promoter of AKAP8L was hypomethylated in (A) BLCA and (B) CHOL tissues. The promoter of AKAP8L was hypermethylated in (C) KIRP tissues. The promoter of AKAP8L was hypomethylated in (D) KIRC, (E) LIHC and (F) LUSC tissues. * p < 0.05, *** p < 0.001.
PPI network and enrichment analysis of GO and KEGG
STRING database was adopted to screen 50 target binding proteins (Figure 5A). Subsequently, we carried out GO enrichment analysis on 50 target binding proteins, demonstrating that the primary biological process (BP) included protein deacetylation, histone deacetylation, along with RNA splicing. Besides, cell components (CC) were mainly enriched in nuclear speck, nuclear periphery, nuclear inner membrane, as well as nuclear envelope. In addition, molecular function (MF) mainly involved double-stranded RNA binding, lamin binding, protein kinase A regulatory subunit binding, together with protein kinase A binding (Figure 5B, 5C). However, results of KEGG pathway enrichment analysis proved that there was no relevant enrichment pathway.
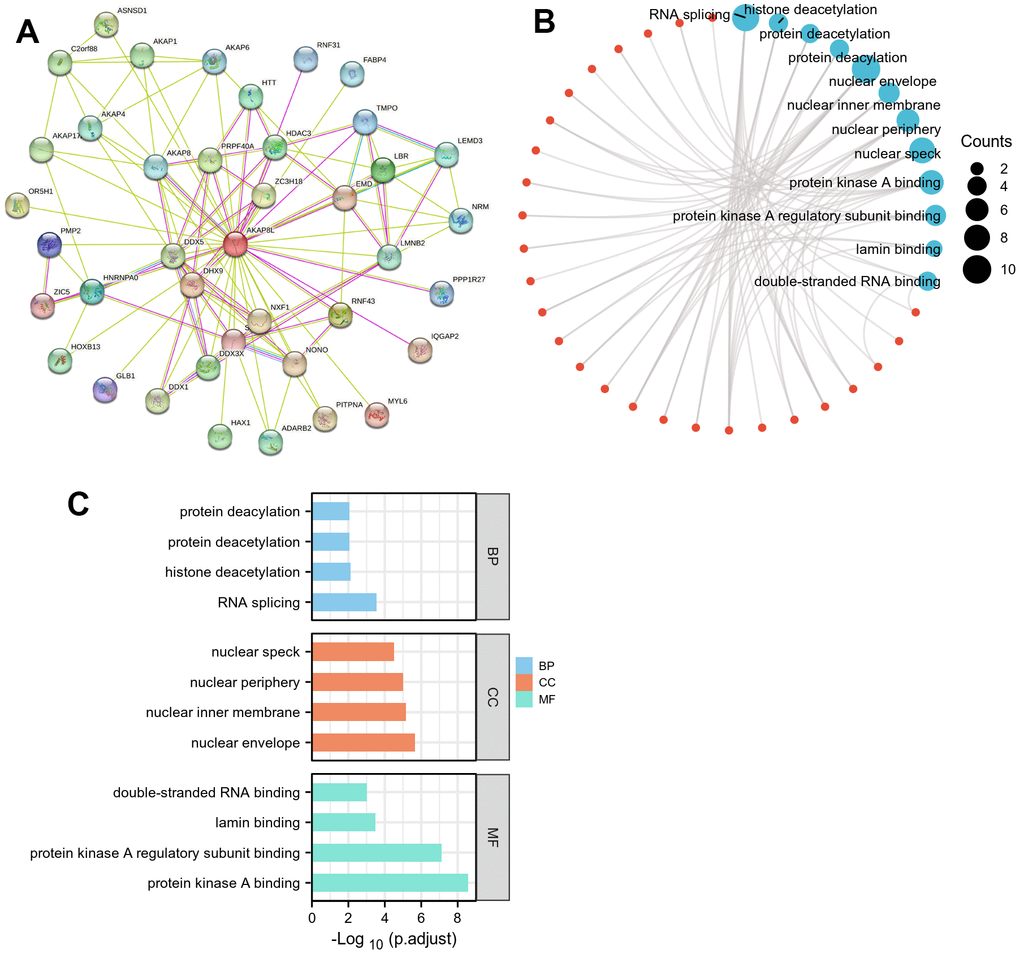
Figure 5. Protein–protein interaction (PPI) network, GO analysis, and KEGG analysis of 50 targeted binding proteins of AKAP8L. (A) PPI network; (B) visual network of GO and KEGG analyses; (C) GO analysis.
Diagnostic value of AKAP8L in pan-cancer
We employed receiver operating characteristic (ROC) curve to evaluate AKAP8L’s diagnostic ability across various cancer types, and our results indicated that AKAP8L demonstrated a certain level of accuracy in diagnosing 15 cancer types with an area under the curve (AUC) greater than 0.7. The AUCs for these cancer types were as follows: ACC (AUC=0.803), BRCA (AUC=0.713), COAD (AUC=0.901), CESC (AUC=0.815), ESCA (AUC=0.883), KIRC (AUC=0.709), KICH (AUC=0.819), HNSC (AUC=0.855), LIHC (AUC=0.969), LUAD (AUC=0.876), OV (AUC=0.893), READ (AUC=0.935), SKCM (AUC=0.851), STAD (AUC=0.737) and TGCT (AUC=0.998) (Figure 6A–6O).
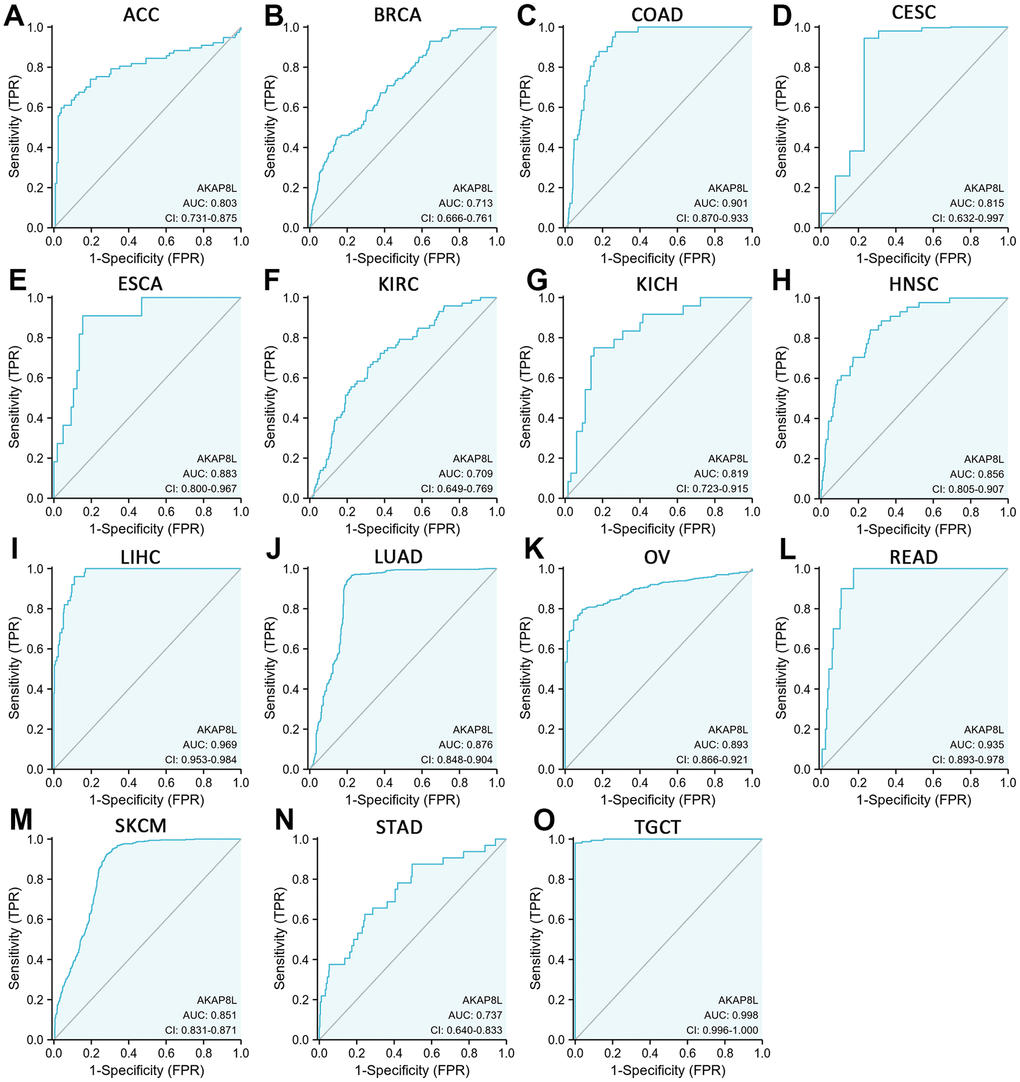
Figure 6. Receiver operating characteristic (ROC) curve for AKAP8L expression in pan-cancer. (A) ACC; (B) BRCA; (C) COAD; (D) CESC; (E) ESCA; (F) KIRC; (G) KICH; (H) HNSC; (I) LIHC; (J) LUAD; (K) OV; (L) READ; (M) SKCM; (N) STAD; (O) TGCT.
Prognostic value of AKAP8L for cancers
Based on cox regression analysis, we observed that a higher expression of AKAP8L was significantly associated with a worse prognosis in COAD, KIRC, KIRP, and PRAD. Specifically, the prognostic markers included OS [hazard ratio (HR)=1.90, 95% confidence interval (CI): 1.28 – 2.84, p=0.002], DSS (HR=2.47, 95% CI: 1.26 – 4.85, p=0.009), PFI (HR=1.62, 95% CI=1.10 – 2.39, p=0.014) for COAD (Figure 7A–7C); OS (HR=2.02, 95% CI: 1.50-2.73, p<0.001), DSS (HR=2.00, 95% CI: 1.37-2.93, p<0.001) and PFI (HR=1.47, 95% CI: 1.04-2.07, p=0.027) for KIRC (Figure 7D–7F); OS (HR=2.50, 95% CI: 1.12-5.62, p=0.026), DSS (HR=2.84, 95% CI: 1.08-7.48, p=0.034) and PFI (HR=2.35, 95% CI: 1.11-4.98, p=0.025) for KIRP (Figure 7G–7I); Finally, OS (HR=6.73, 95% CI: 1.68-26.92, p=0.007), DSS (HR=11.36, 95% CI: 1.22-105.96, p=0.033) and PFI (HR=3.25, 95% CI: 1.73-6.10, p<0.001) for PRAD (Figure 7J–7L).
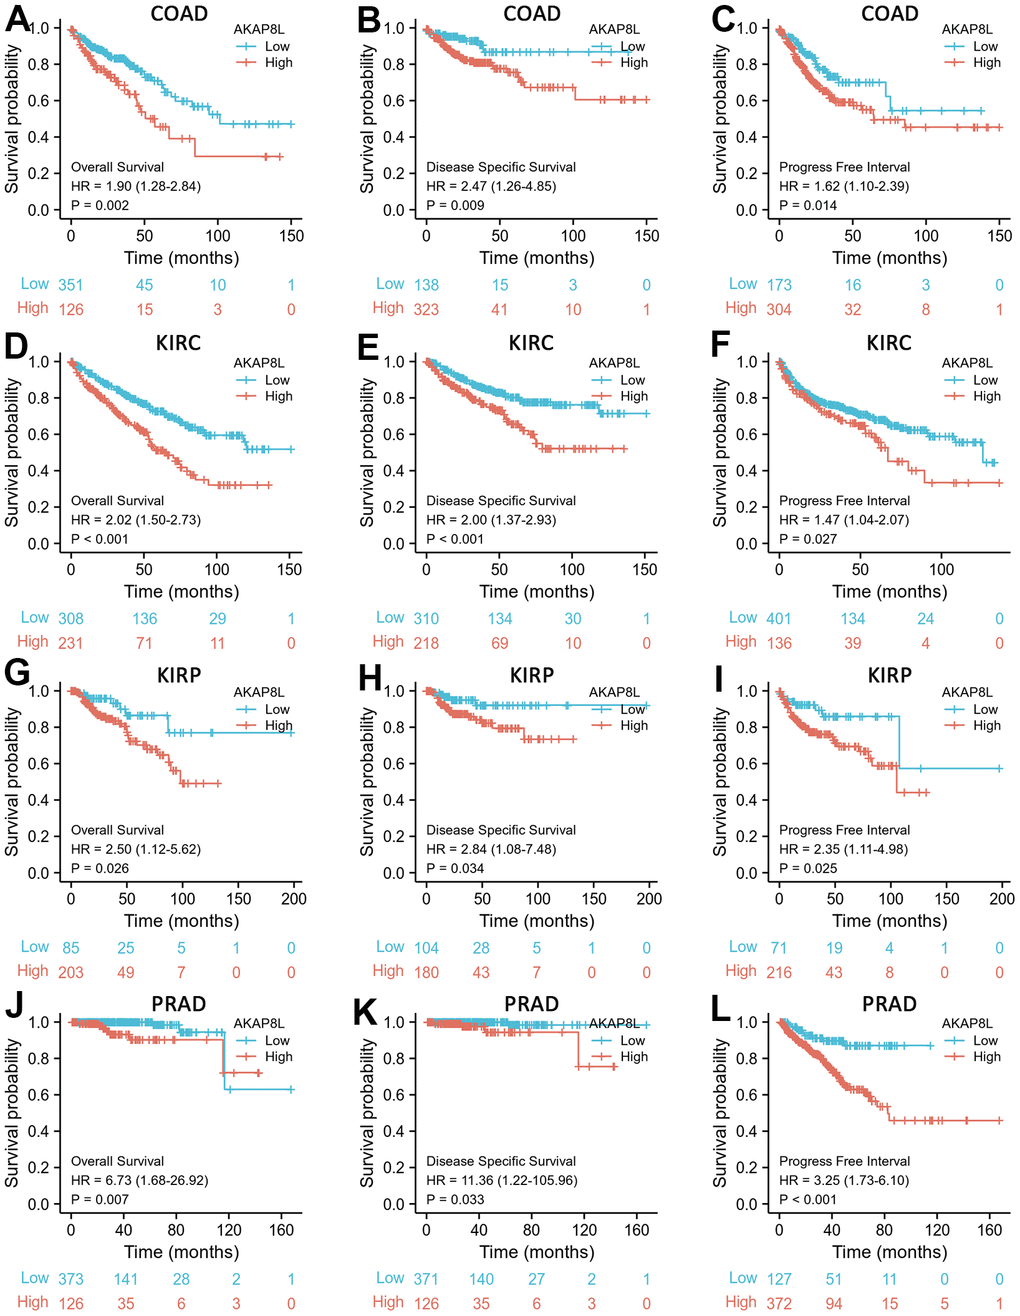
Figure 7. Correlations between AKAP8L expression and the prognosis (OS, DSS, and PFI) of cancers. (A–C) COAD; (D–F) KIRC; (G–I) KIRP; (J–L) PRAD.
Besides, we investigated the correlation between AKAP8L and the prognosis of distinct clinical subgroups of KIRC (OS, DSS and PFI), and observed a higher AKAP8L expression as well as the worse OS in subgroups with an age > 60, white race, lower serum calcium and hemoglobin, no lymphatic metastasis (N0), distant metastasis (M1), clinical tumor staging of T3-T4, histologically graded G3-G4 and pathologically graded Stage III-IV, as demonstrated in Figure 8A–8H. The relationship of AKAP8L expression with DSS were consistent with that with OS, as shown in Figure 9A–9I. A higher AKAP8L expression was associated with the worse PFI among the subgroups with an age>60, white race, lower hemoglobin and histological grade of G3-G4 (Figure 10A–10D).
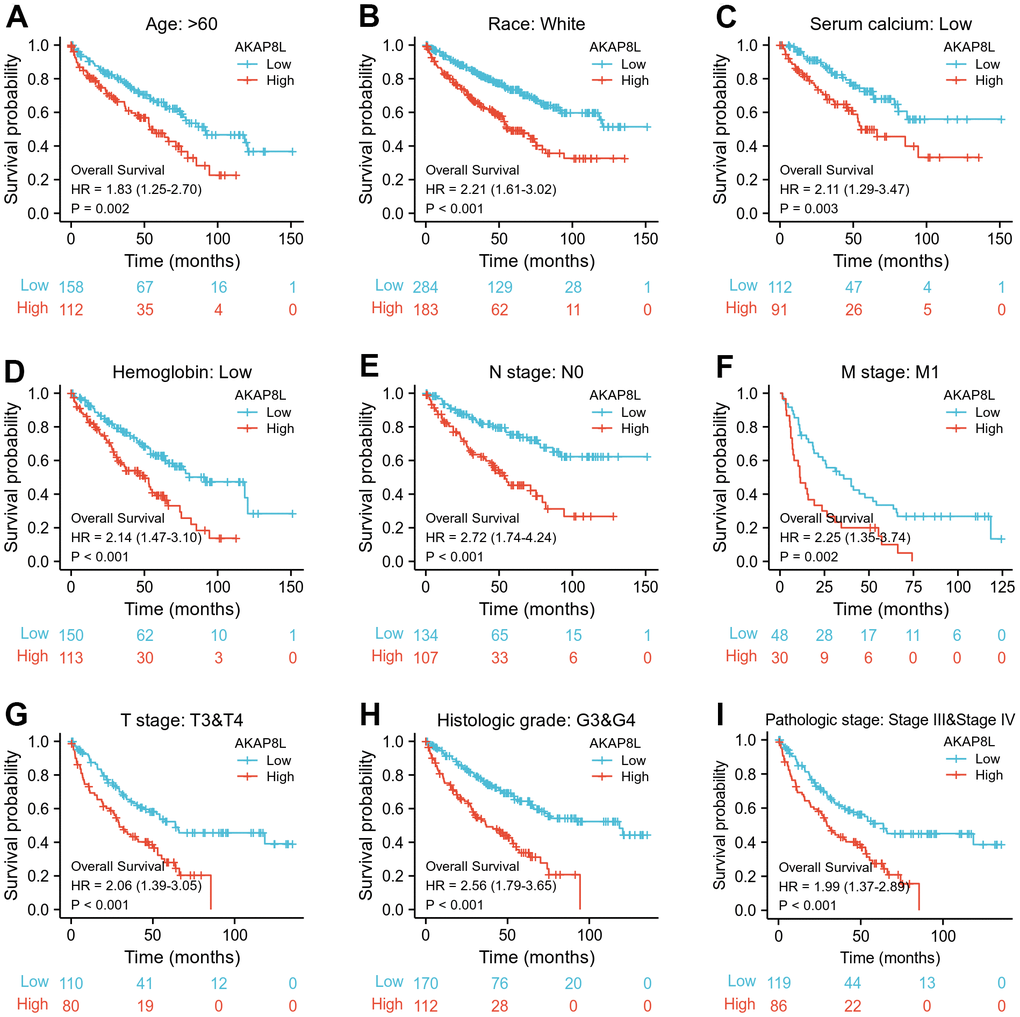
Figure 8. Associations between AKAP8L expression and the OS in different clinical subgroups of KIRC. (A) Age > 60; (B) Race: White; (C) Serum calcium: Low; (D) Hemoglobin: Low; (E) N stage: N0; (F) M stage: M1; (G) T stage: T3&T4; (H) Histologic grade: G3&G4; (I) Pathologic stage: Stage III & Stage IV.
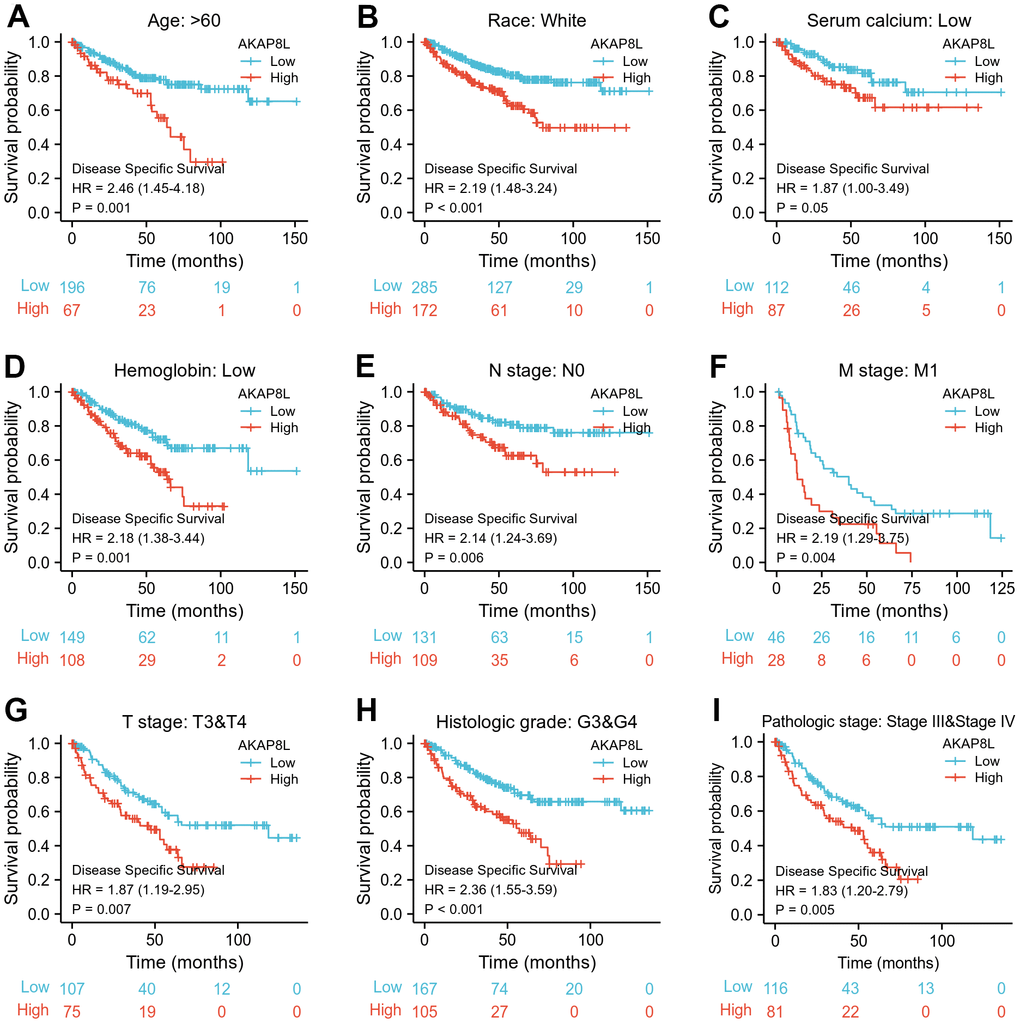
Figure 9. Associations between AKAP8L expression and the DSS in different clinical subgroups of KIRC. (A) Age > 60; (B) Race: White; (C) Serum calcium: Low; (D) Hemoglobin: Low; (E) N stage: N0; (F) M stage: M1; (G) T stage: T3&T4; (H) Histologic grade: G3&G4; (I) Pathologic stage: Stage III & Stage IV.
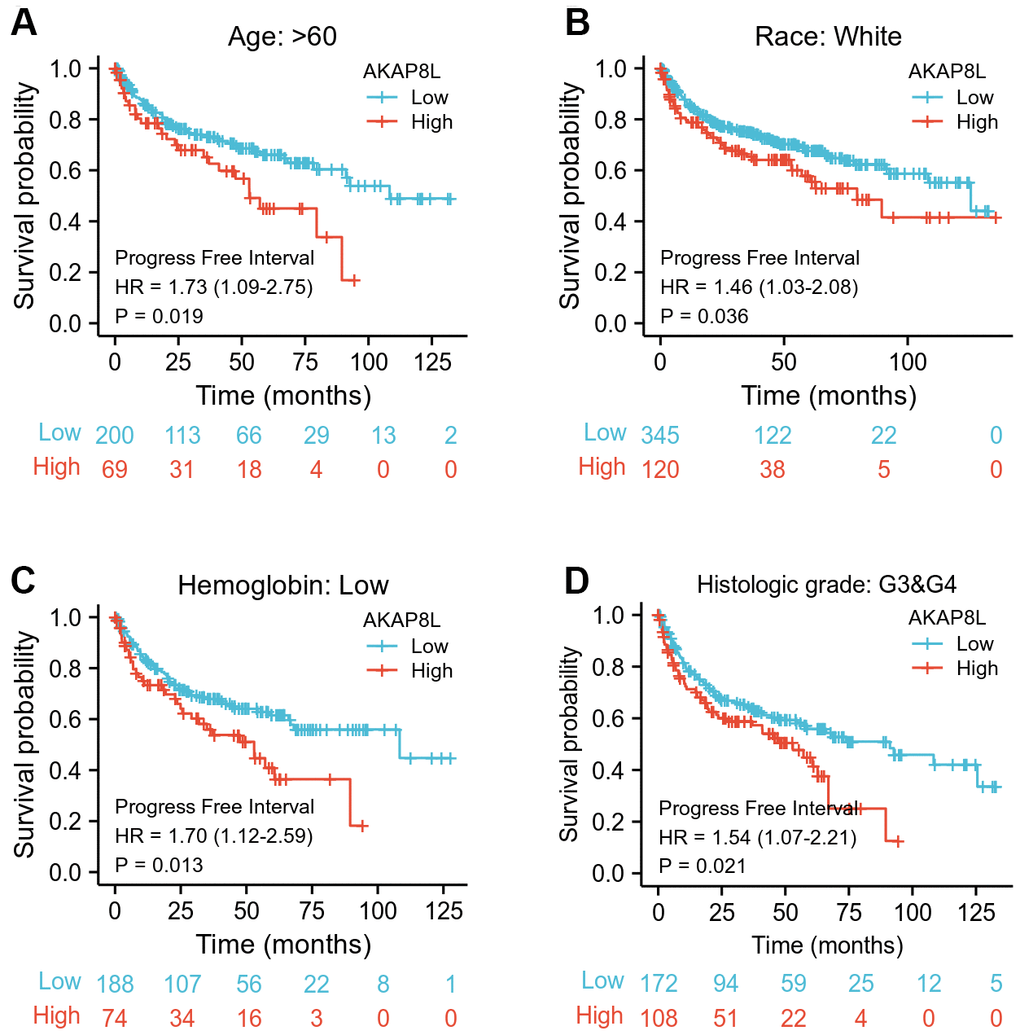
Figure 10. Associations between AKAP8L expression and the PFI in different clinical subgroups of KIRC. (A) Age > 60; (B) Race: White; (C) Hemoglobin: Low; (D) Histologic grade: G3&G4.
The AKAP8L expression in KIRC
IHC analysis revealed that in all 10 pairs of samples, compared to adjacent normal tissue, AKAP8L protein expression was higher in KIRC tumor tissues with statistical significance (Figure 11A, 11B). Consistent with the aforementioned results, RT-qPCR and Western blot (WB) analysis also showed a higher AKAP8L expression in KIRC (A498 and 786-O) cells compared to normal human kidney (HK2) cells with statistical significance (Figure 11C–11E).
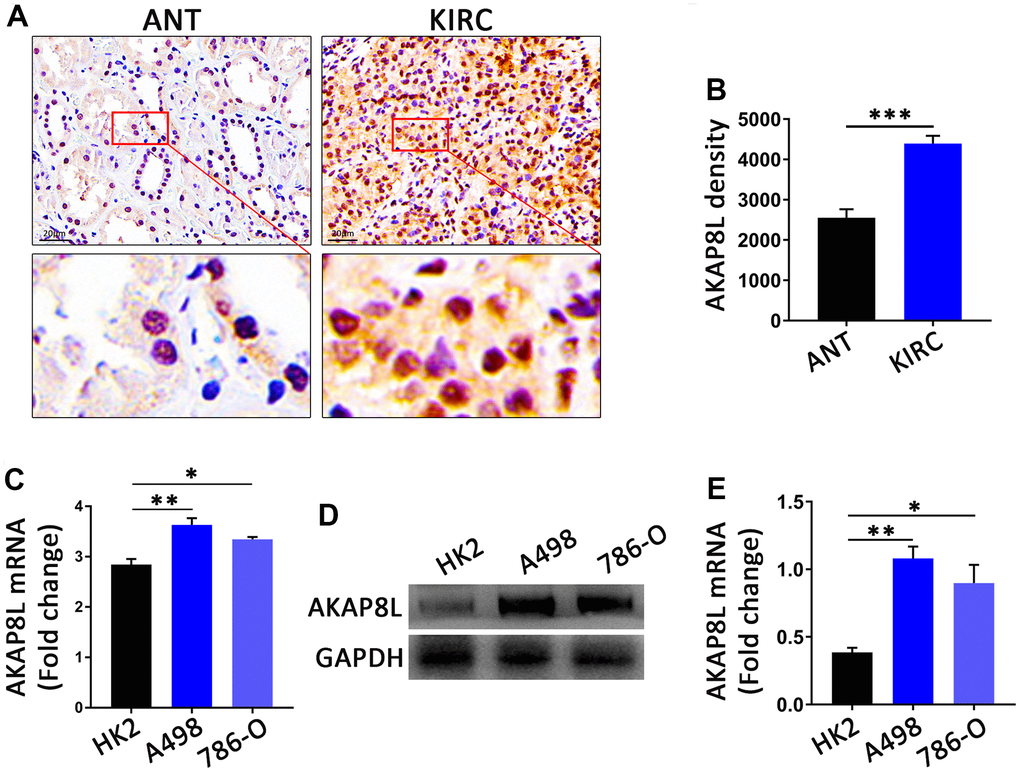
Figure 11. The AKAP8L expression in KIRC. (A) Representative images showing immunohistochemica (IHC) staining results of AKAP8L in KIRC tissues (KIRC) and adjacent normal tissues (ANT) (scale bar, 20 μm). (B) Semiquantitative analysis of IHC staining (n=10). (C) The mRNA expression levels of AKAP8L in different cell types (n≥3). (D) Protein expression levels of AKAP8L and GAPDH in different cell types. (E) Semi-quantification of AKAP8L protein expression level determined by densitometry normalized to GAPDH. *P<0.05, **P<0.01, ***P<0.001. KIRC, Kidney renal clear cell carcinoma.
Relationship of AKAP8L with different clinical characteristics of KIRC
The expression of AKAP8L was associated with the sex, race as well as histological grade of KIRC with statistical significance (Table 1).
Table 1. Clinical characteristics of KRIC patients.
| Characteristic | Levels | Low expression of AKAP8L | High expression of AKAP8L | p |
| n | 269 | 270 | ||
| Gender, n (%) | Female | 78 (14.5%) | 108 (20%) | 0.009 |
| Male | 191 (35.4%) | 162 (30.1%) | ||
| Race, n (%) | Asian | 1 (0.2%) | 7 (1.3%) | < 0.001 |
| Black or African American | 16 (3%) | 41 (7.7%) | ||
| White | 249 (46.8%) | 218 (41%) | ||
| Histologic grade, n (%) | G1 | 0 (0%) | 14 (2.6%) | 0.002 |
| G2 | 119 (22.4%) | 116 (21.8%) | ||
| G3 | 107 (20.2%) | 100 (18.8%) | ||
| G4 | 39 (7.3%) | 36 (6.8%) | ||
| Hemoglobin, n (%) | Elevated | 2 (0.4%) | 3 (0.7%) | 0.046 |
| Low | 125 (27.2%) | 138 (30.1%) | ||
| Normal | 112 (24.4%) | 79 (17.2%) | ||
| OS event, n (%) | Alive | 196 (36.4%) | 170 (31.5%) | 0.018 |
| Dead | 73 (13.5%) | 100 (18.6%) | ||
| DSS event, n (%) | Alive | 220 (41.7%) | 200 (37.9%) | 0.026 |
| Dead | 43 (8.1%) | 65 (12.3%) |
Co-expression gene analysis of AKAP8L in KIRC
The first 50 co-expression genes related to the expression of AKAP8L in KIRC, were investigated, and results showed the association of AKAP8L expression with the expression of the top 10 genes in the heat map, including CLASRP (r=0.883), TAF1C (r=0.858), CLK3 (r=0.848), ZNF276 (r=0.854), SNRNP70 (r=0.842), ZNF335 (r=0.831), CCDC130 (r=0.849), TUBGCP6 (r=0.837), CENPT (r=0.849), and CLK2 (r=0.850) (Figure 12A–12K).
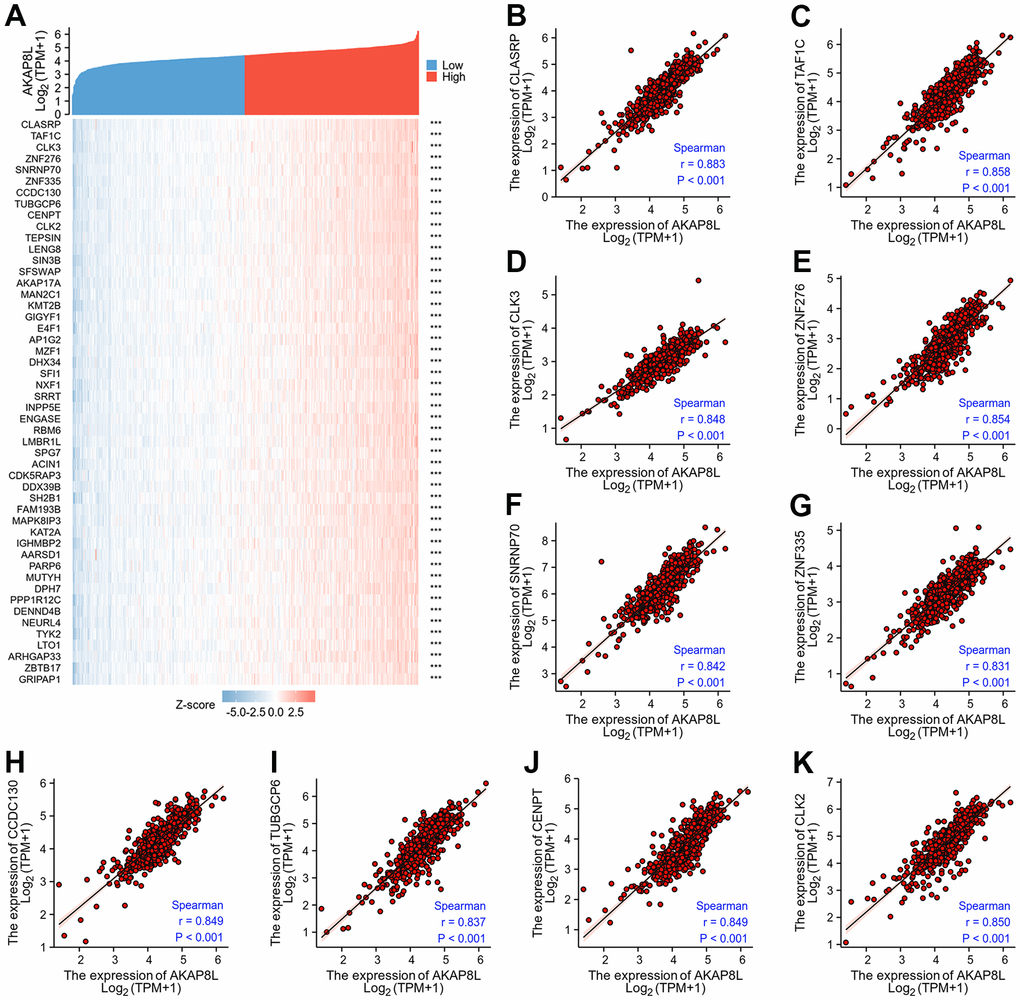
Figure 12. Top 50 genes correlated with AKAP8L expression in KIRC. (A) The gene co-expression heatmap of the top 50 genes correlated with AKAP8L in KIRC; (B–K) correlation analysis of the top 10 genes and AKAP8L in the heatmap.
DEGs between AKAP8L high and low expression groups in KIRC
In total, 855 DEGs were obtained with a threshold of | log2 fold-change (FC) |>1.0 and adjusted p value<0.05, among which 709 were up-regulated and 146 were down-regulated in KIRC compared to normal tissues (Figure 13A). Subsequently, GO and KEGG enrichment analysis were conducted on DEGs identified in KIRC (Figure 13B, 13C). Our analysis revealed that primary BP enriched by the DEGs included acute-phase response, cellular process involved in reproduction in multicellular organism, exogenous drug catabolic process, terpenoid metabolic process and negative regulation of epithelial cell apoptotic process. CC was primarily involved in high-density lipoprotein particle, plasma lipoprotein particle, lipoprotein particle, protein-lipid complex and blood microparticle. MF enrichment was mainly related to receptor ligand activity, serine-type endopeptidase activity, hormone activity, serine hydrolase activity and serine-type peptidase activity. KEGG pathway was mainly enriched in the interactions between neuroactive ligands and receptors, the metabolism of linoleic and alpha-Linolenic acids, Ras signaling pathway as well as phototransduction.
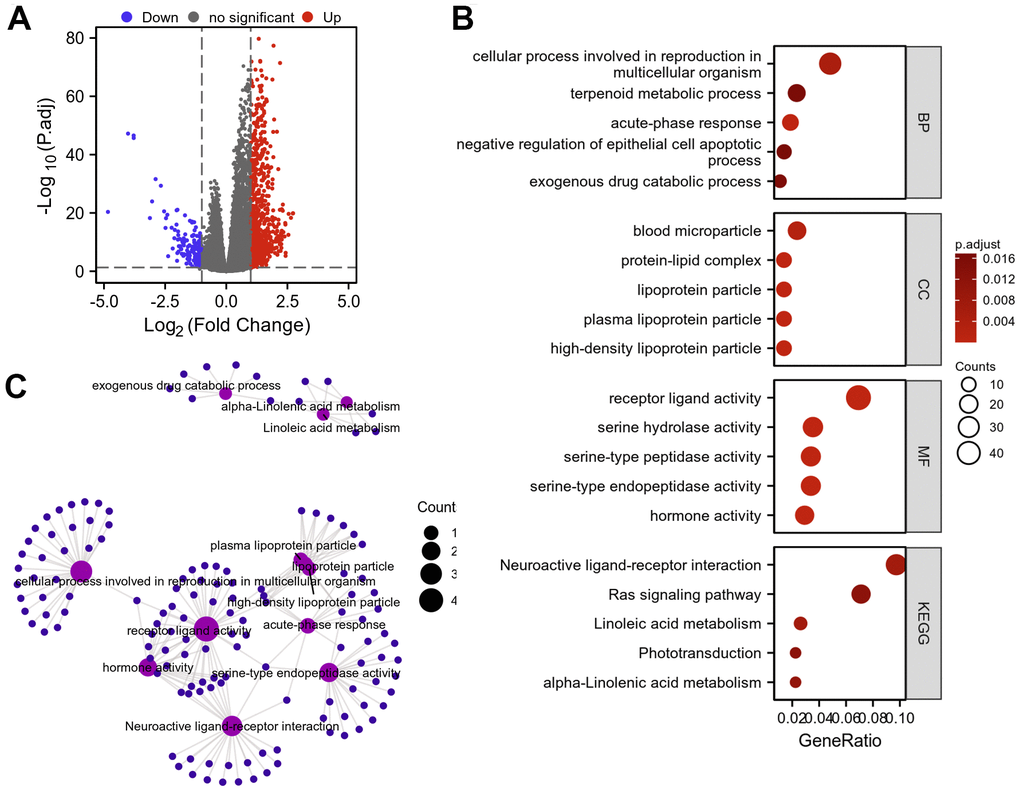
Figure 13. Protein–protein interaction (PPI) network building and GO and KEGG analyses of DEGs between AKAP8L high expression and low expression groups in KIRC. (A) The volcano map of DEGs (red: upregulation; blue: downregulation); (B, C) GO and KEGG analyses of DEGs.
Relationship of AKAP8L expression with tumor-infiltrating immune cells
Spearman correlation was adopted to investigate the relationship between the expression level of AKAP8L (TPM) and the level of GSEA quantitative immune cell infiltration in tumor microenvironment of KIRC (Figure 14A). We found that AKAP8L was pivotal in immune infiltration. AKAP8L was positively correlated with CD8 T cells, T helper cells, pDC cells, Tem cells, NK CD56bright cells, and NK cells (Figure 14B–14G), but negatively related to Eosinophils, T cells, Th1 cells, TFH cells, Mast cells, Neutrophils, DC cells, B cells, iDC cells, Th2 cells, Tgd cells, and Macrophages (Figure 14H–14S).
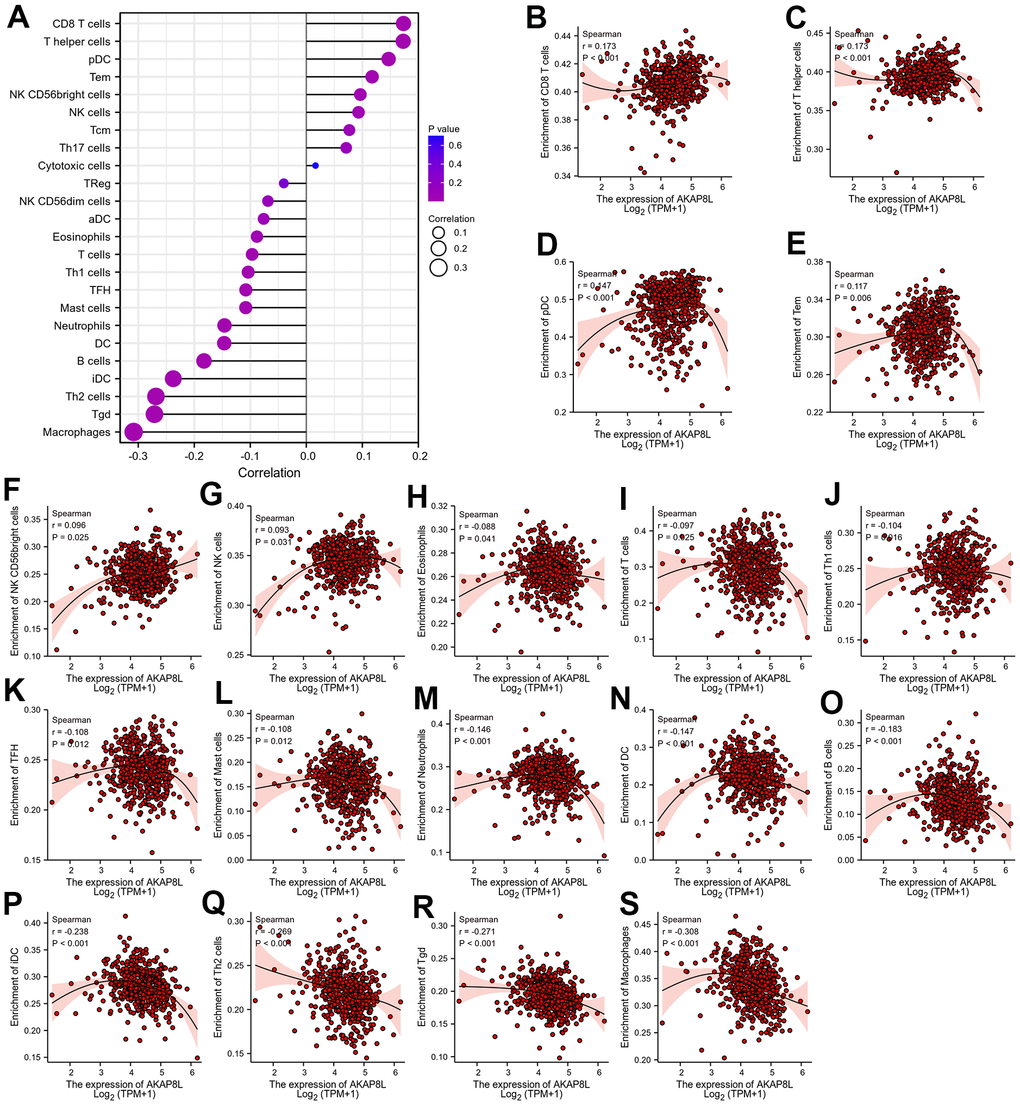
Figure 14. Relationship between AKAP8L expression and tumor-infiltrating immune cells. (A) The lollipop diagram of the correlation between AKAP8L expression and tumor-infiltrating immune cells. Relationship between AKAP8L expression and tumor-infiltrating immune cells, including (B) CD8 T cells, (C) T helper cells, and (D) pDC cells, (E) Tem, (F) CD56bright cells, (G) NK cells, (H) Eosinophils, (I) T cells, (J) Th1 cells, (K) TFH, (L) Mast cells, (M) Neutrophil, (N) DC, (O) B cells, (P) iDC, (Q) Th2 cells, (R) Tgd, (S) Macrophages.
Discussion
AKAPs belong to various scaffold protein families, and these proteins are crucial in establishing the space of multivalent signal combinations [19, 20]. In particular, for g protein-coupled receptors, AKAPs serve as a central hub in tissues for G protein-coupled receptors, allowing for the assembly of multiple protein kinases and phosphatases to create signal devices able to send signals, regulate and transport within cells [21, 22]. It has been proved that AKAPs are pivotal for the initiation / progression of tumors and serve as potential targets of drug therapy [7, 23]. For example, Zhang et al. confirmed that AKAP4 was up-regulated in the tissues of non-small cell lung cancer, and the knockdown of AKAP4 inhibited tumor growth as well as epithelial-mesenchymal transformation, suggesting that AKAP4 might be a pivotal target in treating this disease [24]. As demonstrated by studies, AKAP8L stimulates cell proliferation / migration in various cancers, such a sd colon cancer, gastric cancer and esophageal squamous cell carcinoma, and can interact with mTORC1 and promote cell growth. Thus, it may be a prospective target for the treatment of cancers [9, 15, 16, 25].
Currently, no study has investigated the significance of AKAP8L in a pan-cancer context. To investigate AKAP8L’s expression level in pancancer, we examined the HPA database and TCGA database. Our analysis revealed that AKAP8L was significantly up-regulated in 13 human cancers, but down-regulated in KICH. AKAP8L has played the role of oncogene in most malignant tumors and may take part in the initiation and progression of tumors. In addition, the expression level of AKAP8L was related to the molecular subtypes of 9 kinds of tumors. For example, AKAP8L expression was the highest in the C1 molecular subtype of KIRP, the basal molecular subtype of HNSC, as well as the CIN molecular subtype of COAD. At the same time, AKAP8L was related to distinct immune subtypes of 7 kinds of tumors. Previous studies have proved that AKAP8L was linked to the molecular subtypes of breast cancer [13]. Thus, our study on different cancer molecular subtypes or immune subtypes may provide a suitable entry point for the exploration of the role of AKAP8L. Besides, we also conducted an evaluation of the methylation level of AKAP8L among the tissues of pancancer and found AKAP8L the promoter was hypermethylated in CHOL, KIRP, KIRC and LIHC, but hypomethylated in BLCA and LUSC.
Various studies have demonstrated that AKAPs can impact the prognosis of multiple types of cancers [26–28]. In our study, we investigated whether AKAP8L could serve as a valuable diagnostic and prognostic marker in pancancer using ROC curves and Kaplan - Meier survival curves. Our analysis revealed that AKAP8L has a certain accuracy in predicting 15 types of cancer, with particularly higher accuracy in the prediction of COAD, LIHC, READ and TGCT. In addition, AKAP8L was significantly related to the prognostic markers of COAD, KIRC, KIRP as well as PRAD. Based on the above findings, it could be inferred that AKAP8L may possess significant diagnostic and prognostic value in a number of different tumor types, making it a potentially promising target for precision oncology. Thus, AKAP8L was crucial in mediating signal transduction both inside and outside the cell.
Furthermore, our study focused on analyzing the specific role of AKAP8L in KIRC, and found that high AKAP8L expression may lead to worse OS, DSS or PFI in clinical subgroups of KIRC with an age greater than 80, white, hemoglobin low, or histologic grade in G3 or G4. Thus, our results comprehensively and deeply analyzed the role of AKAP8L in KIRC. In addition, we accurately explored the relationship between AKAP8L expression and distinct outcomes of clinical subgroups of KIRC.
Subsequently, we identified the top 10 co-expression genes of AKAP8L, including CLASRP, TAF1C, CLK3, ZNF276, SNRNP70, ZNF335, CCDC130, TUBGCP6, CENPT, and CLK2. In addition, we carried out GO and KEGG pathway analysis on DEGs between AKAP8L high and low expression group, and revealed that BP was mainly related to acute-phase response, cellular process involved in reproduction in multicellular organism, exogenous drug catabolic process, terpenoid metabolic process, negative regulation of epithelial cell apoptotic process as well as diterpenoid metabolic process. MF was mainly involved in receptor ligand activity, serine-type endopeptidase activity, hormone activity, serine hydrolase activity, growth factor activity along with substrate-specific channel activity. The main pathways were concentrated in interactions between neuroactive ligands and receptors, the metabolism of linoleic and alpha-Linolenic acids, Ras signaling pathway as well as phototransduction.
Analysis of genes involved in cancer development at the immune level may be able to increase our understanding of potential prognostic factors. Currently, many studies have proved a close relationship of immune infiltration with the prognosis and treatment response of various human cancers [29–31]. Studies have shown that AKAPs affect the immune infiltration and immunotherapeutic effects of several cancers [32–34]. Based on these facts, we conducted an analysis to examine the association between AKAP8L expression and the extent of immune cell infiltration in KIRC tumors, and proved the association of AKAP8L with the infiltration of numerous immune cells, including B cells, T cells, NK cells, Macrophages, Neutrophils, and Eosinophils, et al. Our results suggested that AKAP8L may influence the prognosis of patients with KIRC by mediating the level of immune cell infiltration in the microenvironment of KIRC.
Our research still had some limitations. We only used online database when exploring AKAP8L, and actual clinical data were unavailable. More research would be needed to verify our results in future.
In conclusion, AKAP8L may be related to the progression and prognosis of various tumors, especially KIRC. Our research provided a new dimension for a comprehensive understanding of the key role of AKAP8L in tumor progression, and a solid theoretical basis for the discovery of novel targets as well as prognostic markers for cancer treatment, with a particular emphasis on KIRC.
Materials and Methods
The expression analysis of gene
We used HPA (https://www.proteinatlas.org) to analyze the expression of AKAP8L in normal tissues and in tumor cell lines [35]. We downloaded RNA-seq data and related clinical data of 33 tumor types and normal tissues of 10534 samples from the Cancer Genome Map (TCGA) database through UCSC XENA, used R software v3.6.3 for statistical analysis, and used ggplot2 package for visualization. Wilcoxon rank sum test was used to detect two groups of data, p< 0.05 is statistically significant (ns, p ≥ 0.05; *, p < 0.05;**, p < 0.01; ***, p < 0.001) [36].
AKAP8L expression in molecular subtypes and immune subtypes of cancers
TISIDB database is used to explore the correlation between AKAP8L expression and molecular subtypes or immune subtypes in pan cancer [37]. The database integrates a variety of data used to evaluate the interaction between tumor and immune system.
Protein–protein interaction network building
We obtained 50 AKAP8L binding proteins from STRING web, of which the parameters were set as the minimum required interaction score [medium confidence interval (0.400)] and active interaction source (“experiment, text mining, database”) [38, 39].
Gene ontology and Kyoto encyclopedia of genes and genomes enrichment analyses
We used cluster profiler package for statistical analysis, ggplot2 package for visualization, and gene ontology (GO) and Kyoto Encyclopedia of Genes and Genomes (KEGG) enrichment analysis of 50 AKAP8L binding proteins [40].
Diagnostic value analysis
The receiver operating characteristic (ROC) curve was used to evaluate the diagnostic value of AKAP8L in pan cancer. The closer the area under the curve (AUC) is to (1), the better the diagnostic effect is. AUC has a low accuracy in 0.5~0.7, a certain accuracy in 0.7~0.9, and a high accuracy above 0.9.
Prognosis analysis
We used Kaplan-Meier plots to analyze the relationship between AKAP8L expression and tumor prognosis (OS, DSS, PFI). In addition, we further studied the relationship between AKAP8L expression and the prognosis of different clinical subtypes of KIRC (OS, DSS and PFI). We use survival package for statistical analysis and survivin package for visualization. We use Cox regression to test hypothesis, p< 0.05 is statistically significant [41].
Patients
The tumor and adjacent normal tissues of 10 patients with confirmed KIRC were collected. This study was approved by the ethics committee of the First Affiliated Hospital of Nanchang University.
Cell culture
Human kidney cell line (HK2) and human kidney cancer cell lines (A498 and 786-O) were obtained from American Type Culture Collection. Human kidney cell line (HK2) and human kidney cancer cell lines (A498) were cultured in MEM (minimum essential medium) media with supplements at 37° C with 5% CO2 in humidified air. Human kidney cancer cell lines (786-O) cultured in RPMI-1640 media with supplements at 37° C with 5% CO2 in humidified air.
Reverse transcription-quantitative PCR (RT-qPCR)
Total RNA (from HK2, A498 and 786-O cells) was isolated using the total RNA extraction kit (Takara Bio, Inc). The Bestar™ qPCR RT Kit (Takara Bio, Inc) was used to synthesize cDNA from isolated total RNA. Samples were processed in the Applied Biosystems 7500 Real-Time PCR System using TB Green Premix Ex Taq II (cat. no. RR820A; Takara Bio, Inc). The reaction steps were as follows: i) Pre-denaturation, 95° C for 30 seconds; and ii) PCR reaction (40 cycles), 95° C for 5 seconds, 60° C for 30 seconds. The primer sequences for β-actin and AKAP8L are shown in Supplementary Table 1. Cycle threshold values were collected to calculate the relative expression of target genes.
Tissue preparation and histopathological examination
Renal carcinoma and adjacent carcinoma samples were fixed in 10% formalin for 24 hours, then embedded in paraffin and cut into 3 μM thick sections for immunohistochemistry staining.
Immunohistochemistry and immunofluorescence analysis
Paraffin sections were deparaffinized, rehydrated, immersed in antigen retrieval solution, and autoclaved at 121° C for 10 min for antigen retrieval. Sections were incubated with Serum-Free Protein Block (Dako) and pretreated with 100% methanol containing 3% hydrogen peroxide. Then, sections were incubated with the AKAP8L antibody (36068; Signalway Antibody). Primary-stained sections were incubated with appropriate peroxidase-conjugated secondary antibodies (GB23303; Servicebio) and diaminobenzidine substrate.
Univariate and multivariate Cox regression analyses in KIRC
We used univariate and multivariate Cox regression to analyze AKAP8L and clinical features to determine its prognostic value in OS, DSS and PFI of KIRC. We use survival packages for statistical analysis.
Co-expression gene analysis of AKAP8L in KIRC
We seeked the first 50 co-expressed genes related to AKAP8L expression in KIRC, and used stat package to display gene co-expression heatmap. We also used Pearson correlation coefficient to show the correlation between the first 10 genes and AKAP8L expression.
DEGs between AKAP8L high expression and low expression groups in KIRC
We used the deseq2 package to study the DEG between different AKAP8L expression groups (low expression group: 0 – 50%; high expression group: 50 – 100%) in KIRC. We used ggplot2 package to draw the volcano map. The threshold value | log 2 times change (FC) |>1.0, and the adjusted p value<0.05.
Promoter methylation analysis of AKAP8L
We used UALCAN (http://ualcan.path.uab.edu) to obtain the data on AKAP8L promoter methylation level in 33 tumor patients. Differences were compared by the Student’s t-test, and a p < 0.05 was set as statistically significant [17, 18].
Relationship between AKAP8L expression and tumor-infiltrating immune cells
We used ssGSEA (single sample gene set enrichment analysis) method in GSVA package to analyze the immune infiltration of KIRC. And we quantified the relative enrichment fraction of each immune cell from the gene expression profile of each tumor sample based on the characteristic genes of 24 immune cells [42, 43]. We used Spearman correlation analysis to analyze the correlation between AKAP8L and these immune cells, and used Wilcoxon test to analyze the infiltration of immune cells between AKAP8L high expression group and low expression group.
Statistical analysis
All collected data were analyzed using SPSS (IBM SPSS Statistics, version 20.0) and are expressed as the mean ± SEM. The difference between indicated groups was evaluated by Student’s t-test, Mann-Whitney U test, ANOVA or Kruskal-Wallis test. Student’s t-test (parametric) or Mann-Whitney U test (non-parametric) were used to compare the datasets of two groups. ANOVA (parametric) or Kruskal-Wallis test (non-parametric) were used to compare the datasets of multiple groups. P<0.05 was considered to indicate a statistically significant difference.
Availability of data and materials
The datasets used and analyzed during the current study are available from the corresponding author on reasonable request.
Supplementary Materials
Author Contributions
LBZ, XM, JHM, RFC and BF generated the idea and wrote the article. XQL, LML, MM, BBG, YFL and QQZ performed the literature search and data analysis. LBZ and YFL performed experiments mentioned in the paper. All authors contributed to the article and approved the submitted version.
Conflicts of Interest
The authors declare that the research was conducted in the absence of any commercial or financial relationships that could be construed as a potential conflict of interest.
Ethical Statement and Consent
The present study was approved by the ethics and research committee of the first affiliated hospital of Nanchang University (Nanchang, China). Written informed consent was provided from all patients.
Funding
This work was supported by National Natural Science Foundation of China (82060007).
References
- 1. Malbon CC, Tao J, Shumay E, Wang HY. AKAP (A-kinase anchoring protein) domains: beads of structure-function on the necklace of G-protein signalling. Biochem Soc Trans. 2004; 32:861–4. https://doi.org/10.1042/BST0320861 [PubMed]
- 2. Nishimura T, Fujii W, Sugiura K, Naito K. Cytoplasmic anchoring of cAMP-dependent protein kinase (PKA) by A-kinase anchor proteins (AKAPs) is required for meiotic arrest of porcine full-grown and growing oocytes. Biol Reprod. 2014; 90:58. https://doi.org/10.1095/biolreprod.113.114736 [PubMed]
- 3. Kritzer MD, Li J, Dodge-Kafka K, Kapiloff MS. AKAPs: the architectural underpinnings of local cAMP signaling. J Mol Cell Cardiol. 2012; 52:351–8. https://doi.org/10.1016/j.yjmcc.2011.05.002 [PubMed]
- 4. Gopalan J, Wordeman L, Scott JD. Kinase-anchoring proteins in ciliary signal transduction. Biochem J. 2021; 478:1617–29. https://doi.org/10.1042/BCJ20200869 [PubMed]
- 5. Colombe AS, Pidoux G. Cardiac cAMP-PKA Signaling Compartmentalization in Myocardial Infarction. Cells. 2021; 10:922. https://doi.org/10.3390/cells10040922 [PubMed]
- 6. Omar MH, Scott JD. AKAP Signaling Islands: Venues for Precision Pharmacology. Trends Pharmacol Sci. 2020; 41:933–46. https://doi.org/10.1016/j.tips.2020.09.007 [PubMed]
- 7. Reggi E, Diviani D. The role of A-kinase anchoring proteins in cancer development. Cell Signal. 2017; 40:143–55. https://doi.org/10.1016/j.cellsig.2017.09.011 [PubMed]
- 8. Bucko PJ, Scott JD. Drugs That Regulate Local Cell Signaling: AKAP Targeting as a Therapeutic Option. Annu Rev Pharmacol Toxicol. 2021; 61:361–79. https://doi.org/10.1146/annurev-pharmtox-022420-112134 [PubMed]
- 9. Luo QY, Di T, Qiu MZ, Xia ZF, Du Y, Lin RD, Yang LQ, Sun YT, Yang DJ, Sun J, Zhang L. High AKAP8L expression predicts poor prognosis in esophageal squamous cell carcinoma. Cancer Cell Int. 2022; 22:90. https://doi.org/10.1186/s12935-022-02492-3 [PubMed]
- 10. Hu J, Khodadadi-Jamayran A, Mao M, Shah K, Yang Z, Nasim MT, Wang Z, Jiang H. AKAP95 regulates splicing through scaffolding RNAs and RNA processing factors. Nat Commun. 2016; 7:13347. https://doi.org/10.1038/ncomms13347 [PubMed]
- 11. Jiang H, Lu X, Shimada M, Dou Y, Tang Z, Roeder RG. Regulation of transcription by the MLL2 complex and MLL complex-associated AKAP95. Nat Struct Mol Biol. 2013; 20:1156–63. https://doi.org/10.1038/nsmb.2656 [PubMed]
- 12. Kubota S, Morii M, Yuki R, Yamaguchi N, Yamaguchi H, Aoyama K, Kuga T, Tomonaga T, Yamaguchi N. Role for Tyrosine Phosphorylation of A-kinase Anchoring Protein 8 (AKAP8) in Its Dissociation from Chromatin and the Nuclear Matrix. J Biol Chem. 2015; 290:10891–904. https://doi.org/10.1074/jbc.M115.643882 [PubMed]
- 13. Hu X, Harvey SE, Zheng R, Lyu J, Grzeskowiak CL, Powell E, Piwnica-Worms H, Scott KL, Cheng C. The RNA-binding protein AKAP8 suppresses tumor metastasis by antagonizing EMT-associated alternative splicing. Nat Commun. 2020; 11:486. https://doi.org/10.1038/s41467-020-14304-1 [PubMed]
- 14. Li W, Hu J, Shi B, Palomba F, Digman MA, Gratton E, Jiang H. Biophysical properties of AKAP95 protein condensates regulate splicing and tumorigenesis. Nat Cell Biol. 2020; 22:960–72. https://doi.org/10.1038/s41556-020-0550-8 [PubMed]
- 15. Zhang R, Liu L, Wang F, Zhao W, Liu K, Yu H, Zhao S, Xu B, Zhang X, Chai J, Hao J. AKAP8L enhances the stemness and chemoresistance of gastric cancer cells by stabilizing SCD1 mRNA. Cell Death Dis. 2022; 13:1041. https://doi.org/10.1038/s41419-022-05502-4 [PubMed]
- 16. Melick CH, Meng D, Jewell JL. A-kinase anchoring protein 8L interacts with mTORC1 and promotes cell growth. J Biol Chem. 2020; 295:8096–105. https://doi.org/10.1074/jbc.AC120.012595 [PubMed]
- 17. Chandrashekar DS, Bashel B, Balasubramanya SAH, Creighton CJ, Ponce-Rodriguez I, Chakravarthi BV, Varambally S. UALCAN: A Portal for Facilitating Tumor Subgroup Gene Expression and Survival Analyses. Neoplasia. 2017; 19:649–58. https://doi.org/10.1016/j.neo.2017.05.002 [PubMed]
- 18. Chandrashekar DS, Karthikeyan SK, Korla PK, Patel H, Shovon AR, Athar M, Netto GJ, Qin ZS, Kumar S, Manne U, Creighton CJ, Varambally S. UALCAN: An update to the integrated cancer data analysis platform. Neoplasia. 2022; 25:18–27. https://doi.org/10.1016/j.neo.2022.01.001 [PubMed]
- 19. Colledge M, Scott JD. AKAPs: from structure to function. Trends Cell Biol. 1999; 9:216–21. https://doi.org/10.1016/s0962-8924(99)01558-5 [PubMed]
- 20. Suryavanshi SV, Jadhav SM, McConnell BK. Polymorphisms/Mutations in A-Kinase Anchoring Proteins (AKAPs): Role in the Cardiovascular System. J Cardiovasc Dev Dis. 2018; 5:7. https://doi.org/10.3390/jcdd5010007 [PubMed]
- 21. Yu X, Li F, Klussmann E, Stallone JN, Han G. G protein-coupled estrogen receptor 1 mediates relaxation of coronary arteries via cAMP/PKA-dependent activation of MLCP. Am J Physiol Endocrinol Metab. 2014; 307:E398–407. https://doi.org/10.1152/ajpendo.00534.2013 [PubMed]
- 22. Malbon CC, Tao J, Wang HY. AKAPs (A-kinase anchoring proteins) and molecules that compose their G-protein-coupled receptor signalling complexes. Biochem J. 2004; 379:1–9. https://doi.org/10.1042/BJ20031648 [PubMed]
- 23. Mohapatra T, Dixit M. IQ Motif Containing GTPase Activating Proteins (IQGAPs), A-Kinase Anchoring Proteins (AKAPs) and Kinase Suppressor of Ras Proteins (KSRs) in Scaffolding Oncogenic Pathways and Their Therapeutic Potential. ACS Omega. 2022; 7:45837–48. https://doi.org/10.1021/acsomega.2c05505 [PubMed]
- 24. Zhang B, Hu Q, Zhang J, Jin Z, Ruan Y, Xia L, Wang C. Silencing of A-kinase anchor protein 4 inhibits the metastasis and growth of non-small cell lung cancer. Bioengineered. 2022; 13:6895–907. https://doi.org/10.1080/21655979.2021.1977105 [PubMed]
- 25. Luo QY, Di T, Chen ZG, Peng JH, Sun J, Xia ZF, Pan WT, Luo F, Lu FT, Sun YT, Yang LQ, Zhang L, Qiu MZ, Yang DJ. Novel prognostic model predicts overall survival in colon cancer based on RNA splicing regulation gene expression. Cancer Sci. 2022; 113:3330–46. https://doi.org/10.1111/cas.15480 [PubMed]
- 26. Rinaldi L, Sepe M, Delle Donne R, Conte K, Arcella A, Borzacchiello D, Amente S, De Vita F, Porpora M, Garbi C, Oliva MA, Procaccini C, Faicchia D, et al. Mitochondrial AKAP1 supports mTOR pathway and tumor growth. Cell Death Dis. 2017; 8:e2842. https://doi.org/10.1038/cddis.2017.241 [PubMed]
- 27. Li X, Wang C, Zhang G, Liang M, Zhang B. AKAP2 is upregulated in ovarian cancer, and promotes growth and migration of cancer cells. Mol Med Rep. 2017; 16:5151–6. https://doi.org/10.3892/mmr.2017.7286 [PubMed]
- 28. Esmaeili R, Majidzadeh-A K, Farahmand L, Ghasemi M, Salehi M, Khoshdel AR. AKAP3 correlates with triple negative status and disease free survival in breast cancer. BMC Cancer. 2015; 15:681. https://doi.org/10.1186/s12885-015-1668-0 [PubMed]
- 29. Mao X, Xu J, Wang W, Liang C, Hua J, Liu J, Zhang B, Meng Q, Yu X, Shi S. Crosstalk between cancer-associated fibroblasts and immune cells in the tumor microenvironment: new findings and future perspectives. Mol Cancer. 2021; 20:131. https://doi.org/10.1186/s12943-021-01428-1 [PubMed]
- 30. Dieci MV, Miglietta F, Guarneri V. Immune Infiltrates in Breast Cancer: Recent Updates and Clinical Implications. Cells. 2021; 10:223. https://doi.org/10.3390/cells10020223 [PubMed]
- 31. Sokratous G, Polyzoidis S, Ashkan K. Immune infiltration of tumor microenvironment following immunotherapy for glioblastoma multiforme. Hum Vaccin Immunother. 2017; 13:2575–82. https://doi.org/10.1080/21645515.2017.1303582 [PubMed]
- 32. Jagadish N, Parashar D, Gupta N, Agarwal S, Sharma A, Fatima R, Suri V, Kumar R, Gupta A, Lohiya NK, Suri A. A novel cancer testis antigen target A-kinase anchor protein (AKAP4) for the early diagnosis and immunotherapy of colon cancer. Oncoimmunology. 2016; 5:e1078965. https://doi.org/10.1080/2162402X.2015.1078965 [PubMed]
- 33. Kong X, An P, Xu J, Liu W, Lin F, Yang Y. A-Kinase Anchor Protein 95 Is Involved in ERK1/2-Elk-1 Signal Transduction in Colon Cancer. Anal Cell Pathol (Amst). 2023; 2023:8242646. https://doi.org/10.1155/2023/8242646 [PubMed]
- 34. Liang Q, Peng J, Xu Z, Li Z, Jiang F, Ouyang L, Wu S, Fu C, Liu Y, Liu Y, Yan Y. Pan-cancer analysis of the prognosis and immunological role of AKAP12: A potential biomarker for resistance to anti-VEGF inhibitors. Front Genet. 2022; 13:943006. https://doi.org/10.3389/fgene.2022.943006 [PubMed]
- 35. Asplund A, Edqvist PH, Schwenk JM, Pontén F. Antibodies for profiling the human proteome-The Human Protein Atlas as a resource for cancer research. Proteomics. 2012; 12:2067–77. https://doi.org/10.1002/pmic.201100504 [PubMed]
- 36. Vivian J, Rao AA, Nothaft FA, Ketchum C, Armstrong J, Novak A, Pfeil J, Narkizian J, Deran AD, Musselman-Brown A, Schmidt H, Amstutz P, Craft B, et al. Toil enables reproducible, open source, big biomedical data analyses. Nat Biotechnol. 2017; 35:314–6. https://doi.org/10.1038/nbt.3772 [PubMed]
- 37. Ru B, Wong CN, Tong Y, Zhong JY, Zhong SSW, Wu WC, Chu KC, Wong CY, Lau CY, Chen I, Chan NW, Zhang J. TISIDB: an integrated repository portal for tumor-immune system interactions. Bioinformatics. 2019; 35:4200–2. https://doi.org/10.1093/bioinformatics/btz210 [PubMed]
- 38. Szklarczyk D, Gable AL, Lyon D, Junge A, Wyder S, Huerta-Cepas J, Simonovic M, Doncheva NT, Morris JH, Bork P, Jensen LJ, Mering CV. STRING v11: protein-protein association networks with increased coverage, supporting functional discovery in genome-wide experimental datasets. Nucleic Acids Res. 2019; 47:D607–13. https://doi.org/10.1093/nar/gky1131 [PubMed]
- 39. Szklarczyk D, Gable AL, Nastou KC, Lyon D, Kirsch R, Pyysalo S, Doncheva NT, Legeay M, Fang T, Bork P, Jensen LJ, von Mering C. The STRING database in 2021: customizable protein-protein networks, and functional characterization of user-uploaded gene/measurement sets. Nucleic Acids Res. 2021; 49:D605–12. https://doi.org/10.1093/nar/gkaa1074 [PubMed]
- 40. Yu G, Wang LG, Han Y, He QY. clusterProfiler: an R package for comparing biological themes among gene clusters. OMICS. 2012; 16:284–7. https://doi.org/10.1089/omi.2011.0118 [PubMed]
- 41. Liu J, Lichtenberg T, Hoadley KA, Poisson LM, Lazar AJ, Cherniack AD, Kovatich AJ, Benz CC, Levine DA, Lee AV, Omberg L, Wolf DM, Shriver CD, et al, and Cancer Genome Atlas Research Network. An Integrated TCGA Pan-Cancer Clinical Data Resource to Drive High-Quality Survival Outcome Analytics. Cell. 2018; 173:400–16.e11. https://doi.org/10.1016/j.cell.2018.02.052 [PubMed]
- 42. Hänzelmann S, Castelo R, Guinney J. GSVA: gene set variation analysis for microarray and RNA-seq data. BMC Bioinformatics. 2013; 14:7. https://doi.org/10.1186/1471-2105-14-7 [PubMed]
- 43. Bindea G, Mlecnik B, Tosolini M, Kirilovsky A, Waldner M, Obenauf AC, Angell H, Fredriksen T, Lafontaine L, Berger A, Bruneval P, Fridman WH, Becker C, et al. Spatiotemporal dynamics of intratumoral immune cells reveal the immune landscape in human cancer. Immunity. 2013; 39:782–95. https://doi.org/10.1016/j.immuni.2013.10.003 [PubMed]