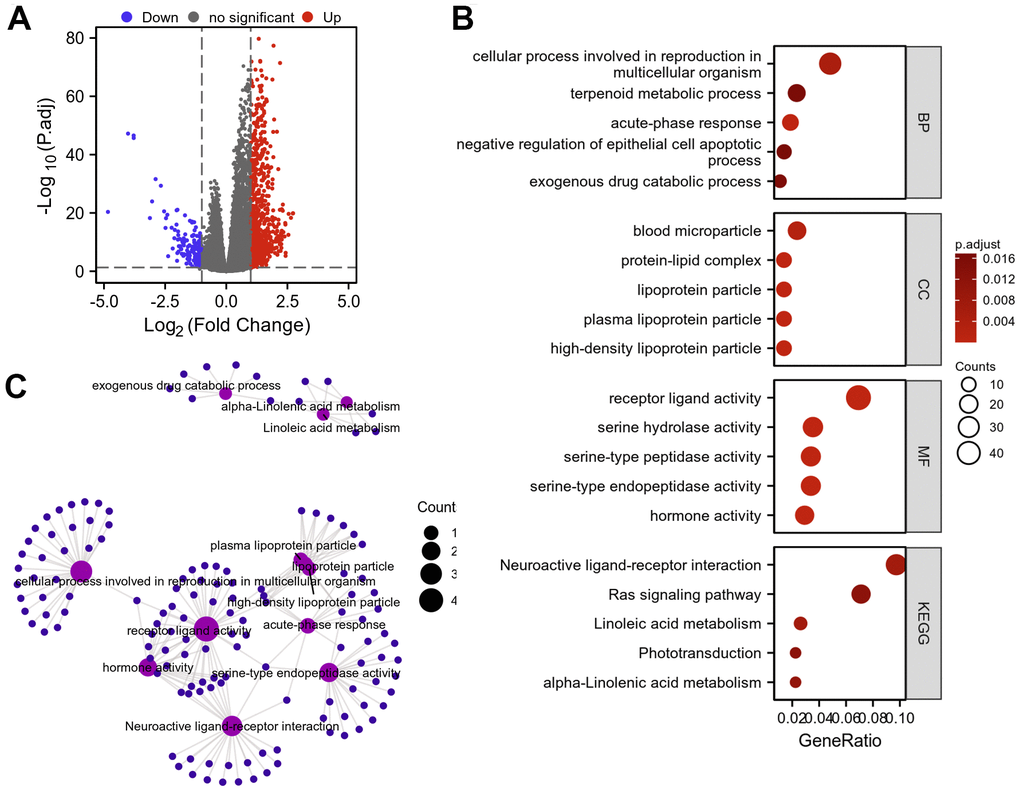
Figure 13.Protein–protein interaction (PPI) network building and GO and KEGG analyses of DEGs between AKAP8L high expression and low expression groups in KIRC. (A) The volcano map of DEGs (red: upregulation; blue: downregulation); (B, C) GO and KEGG analyses of DEGs.