


Introduction
Among primary malignant tumors of the nervous system, gliomas are the most common. In recent years, molecular technology has revealed some of the genetic and chromosomal changes associated with the occurrence, development and prognosis of gliomas [1]. Gliomas can be characterized by several pathological molecular changes, including telomerase reverse transcriptase promoter mutations, isocitrate dehydrogenase mutations, methylguanine methyltransferase promoter methylation, 1p/19q codeletion and alpha thalassemia retardation syndrome X-linked (ATRX) mutations [2].
At tandem repeat sequences in the genome, ATRX helps to prevent replication fork arrest, facilitate histone variant formation and prevent homologous recombination at telomeres [3]. Loss of ATRX causes epigenetic changes, including hypomethylation of repetitive elements such as telomeres [4]. ATRX mutation or loss is common in a variety of tumor types, including low-grade astrocytomas and secondary glioblastomas [5]. A bioinformatic analysis revealed that glioblastoma patients with ATRX loss had longer overall survival and greater benefit from temozolomide treatment than patients without this change [6]. However, it is unclear how the dysregulation of stromal and immune cell infiltration in ATRX-wildtype (ATRX-wt) glioma influences its development and progression. Therefore, identifying specific biomarkers of ATRX-wt glioma may facilitate the treatment of this disease.
The Cancer Gene Atlas (TCGA) is commonly used to identify tumor biomarkers in bioinformatic analyses [7]. Zhu et al. found that a nuclear translocation-associated gene signature combined with isocitrate dehydrogenase mutation status and 1p/19q codeletion status could improve prognostic prediction in glioma patients [8]. Feng et al. identified and validated an autophagy-associated signature to predict survival in low-grade gliomas [9]. In this study, we used TCGA data to construct a specific risk model that predicts the prognosis of ATRX-wt glioma patients and informs immune checkpoint blockade (ICB) therapy. Our results may provide new insights into the diagnosis and treatment of ATRX-wt gliomas.
Results
High- and low-immune/stromal grouping of ATRX-mt and ATRX-wt glioma patients in TCGA
Our workflow to identify, test and validate prognostic and predictive biomarkers of glioma is shown in Figure 1A. The ESTIMATE algorithm was used to calculate immune and stromal scores for ATRX-mutation-type (ATRX-mt) and ATRX-wt glioma patients from TCGA, and the median scores were used to divide patients into high- and low-scoring groups. According to a Kaplan-Meier survival analysis, high vs. low immune/stromal scores did not significantly impact ATRX-mt glioma patient survival (Supplementary Table 1; Figure 1B, 1C). However, high immune and stromal scores were associated with poorer overall survival than low immune/stromal scores in ATRX-wt glioma patients (Figure 1D, 1E).
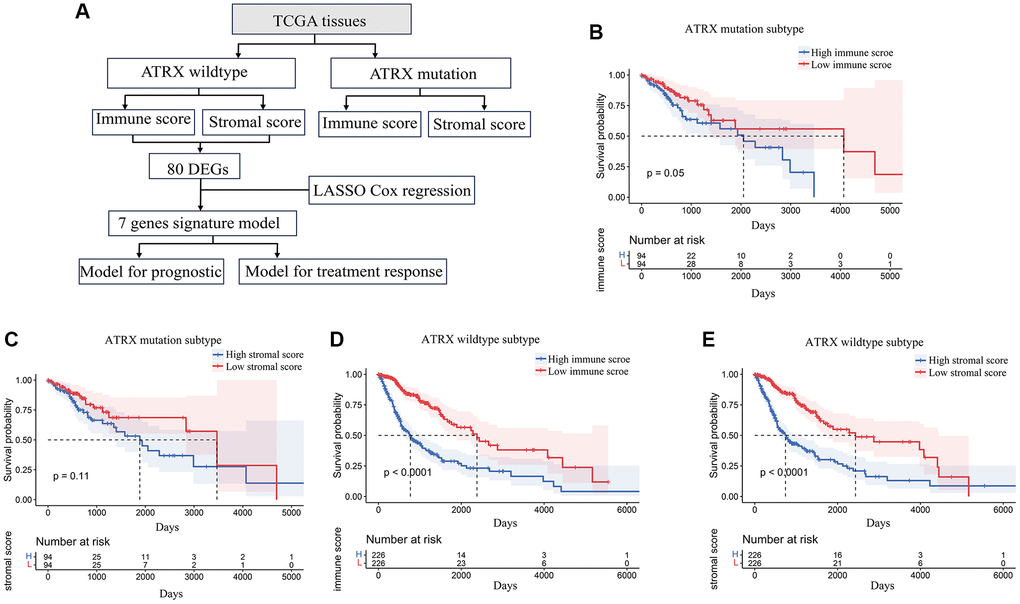
Figure 1. Stromal and immune scores were associated with survival in ATRX-wt glioma patients. (A) Flow chart of the analytical process in this study. (B) Kaplan-Meier survival analysis for ATRX-mt glioma patients in the high- and low-immune-score groups. (C) Kaplan-Meier survival analysis for ATRX-mt glioma patients in the high- and low-stromal-score groups. (D) Kaplan-Meier survival analysis for ATRX-wt glioma patients in the high- and low-immune-score groups. (E) Kaplan-Meier survival analysis for ATRX-wt glioma patients in the high- and low-stromal-score groups.
Next, we compared the gene expression profiles of ATRX-wt glioma patients with high and low immune/stromal scores. We found 166 upregulated and 28 downregulated genes in the high-stromal-score group compared with the low-stromal-score group (Figure 2A, 2B). In addition, we identified 158 upregulated and 44 downregulated genes in high-immune-score patients compared with low-immune-score patients (Figure 2C, 2D). When we analyzed the differentially expressed genes (DEGs) that overlapped between the high-stromal-score and high-immune-score groups of ATRX-wt glioma tissues, we found 136 upregulated and 26 downregulated genes (Supplementary Table 2; Figure 2E, 2F).
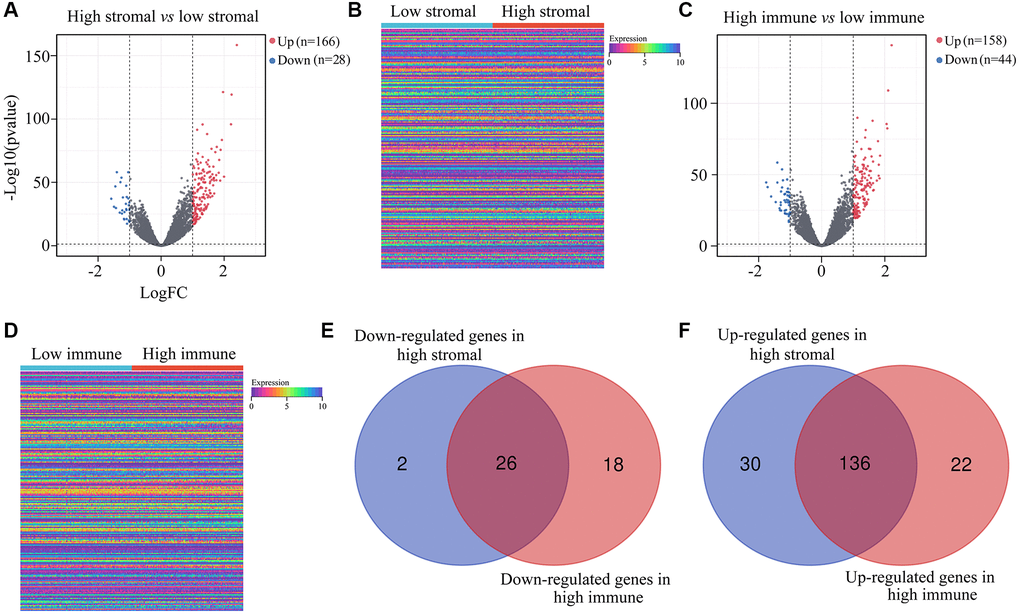
Figure 2. DEGs in ATRX-wt glioma tissues with high vs. low stromal/immune scores. (A) Volcano plot showing the DEGs between the high- and low-stromal-score groups of ATRX-wt glioma tissues. (B) Heat map showing the DEGs between the high- and low-stromal-score groups of ATRX-wt glioma tissues. (C) Volcano plot showing the DEGs between the high- and low-immune-score groups of ATRX-wt glioma tissues. (D) Heat map showing the DEGs between the high- and low-immune-score groups of ATRX-wt glioma tissues. (E) Overlapping downregulated genes between the high-stromal-score and high-immune-score groups of ATRX-wt glioma tissues. (F) Overlapping upregulated genes between the high-stromal-score and high-immune-score groups of ATRX-wt glioma tissues.
We then generated a protein-protein interaction (PPI) network based on the overlapping DEGs in ATRX-wt glioma patients with high stromal and immune scores. The PPI network contained 80 interacting genes (Figure 3A). Candidate hub genes from this network were subjected to Gene Ontology analyses for Molecular Function, Biological Process and Cellular Component. The Molecular Function terms associated with the candidate hub genes were enriched in “RNA polymerase II transcription factor activity”, “RNA polymerase II core promoter proximal region sequence specific”, “sequence specific double stranded”, “DNA binding” and “RNA polymerase II transcription regulatory region sequence specific binding” (Figure 3B). In the Biological Process analysis, the candidate hub genes were found in “regulation of transcription from RNA polymerase II promoter”, “positive regulation of transcription from RNA polymerase II promoter”, “anterior/posterior pattern specification”, “immune response” and “embryonic skeletal system morphogenesis” (Figure 3C). The Cellular Component analysis was enriched in “cell surface”, “external side of plasma membrane”, “nucleoplasm”, “chromatin” and “nucleus” (Figure 3D). We also performed a Kyoto Encyclopedia of Genes and Genomes (KEGG) pathway analysis, which revealed that the candidate hub genes were involved in the “T cell receptor signaling pathway”, “chemokine signaling pathway”, “intestinal immune network for IgA production”, “cell adhesion molecules” and “IL-17 signaling pathway” (Figure 3E).
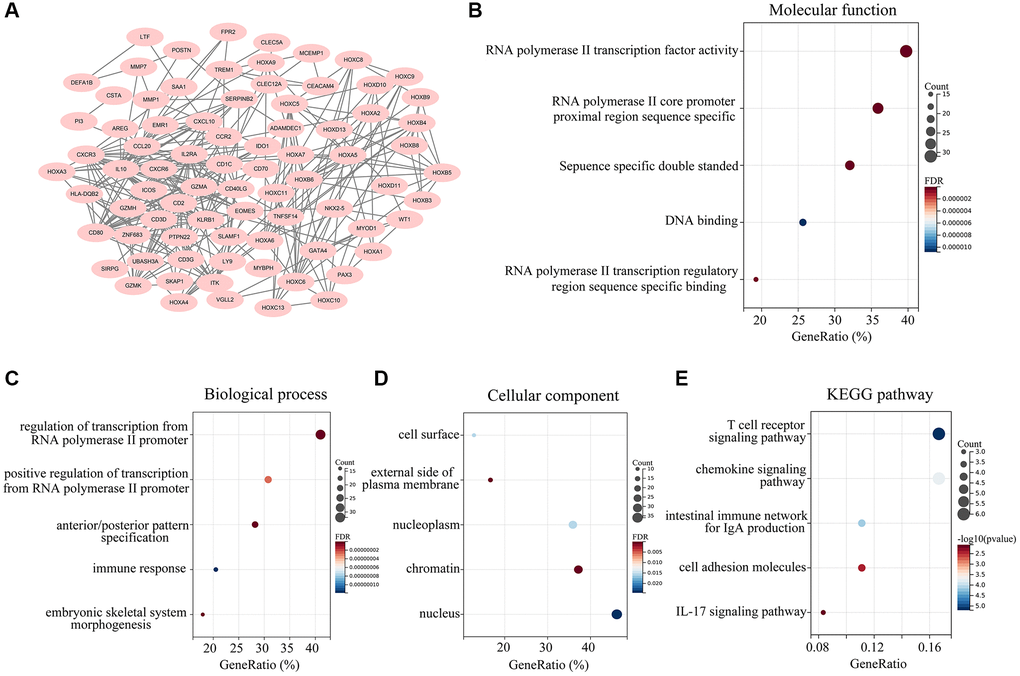
Figure 3. Landscape of the 162 overlapping DEGs. (A) A PPI network was constructed using the 162 overlapping DEGs, and isolated genes were removed. Genes in the PPI network were set as candidate hub genes. (B) Molecular Function analysis of candidate hub genes. (C) Biological Process analysis of candidate hub genes. (D) Cellular Component analysis of candidate hub genes. (E) KEGG analysis of candidate central genes.
Constructing the immune profiles of ATRX-wt glioma patients
Next, we performed a univariate Cox regression analysis, which revealed that seven of the 80 aforementioned candidate genes were associated with survival in ATRX-wt glioma patients (Table 1). We subsequently conducted a LASSO analysis (Figure 4A, 4B) and a multivariate Cox analysis (Figure 4C), which identified homeobox A5 (HOXA5), protein tyrosine phosphatase non-receptor type 2 (PTPN2I, WT1 transcription factor (WT1), homeobox D10 (HOXD10), periostin (POSTN), ADAM like decysin 1 (ADAMDEC1) and myosin binding protein H (MYBPH) as independent predictors of survival in ATRX-wt glioma patients. These results were used to develop a risk model capable of predicting survival in ATRX-wt glioma patients. After computer optimization, and the following risk score expression was obtained: 0.11 × HOXA5 expression + 0.41 × PTPN2 expression + 0.14 × WT1 expression + 0.08 HOXD10 expression + 0.14 × POSTN expression + 0.11 × ADAMDEC1 expression + 0.10 × MYBPH expression.
Table 1. The hazard rate of genes for glioma patients with ATRX wild type.
| ID | HR | HR.95L | HR.95H | p-value |
| IL10 | 1.63484617 | 1.412942779 | 1.891599604 | 3.99005E-11 |
| CD2 | 1.611050947 | 1.433723056 | 1.810311372 | 1.09872E-15 |
| CD80 | 1.7382012 | 1.499705417 | 2.01462459 | 2.10213E-13 |
| CD40LG | 1.8853422 | 1.569864227 | 2.264218236 | 1.14512E-11 |
| CD3D | 1.511986167 | 1.357567997 | 1.683968814 | 5.41101E-14 |
| CXCR3 | 1.689515301 | 1.466473383 | 1.946480574 | 3.86946E-13 |
| GZMA | 1.533573702 | 1.368230012 | 1.718898341 | 2.03829E-13 |
| IL2RA | 1.420618668 | 1.310610237 | 1.539860855 | 1.37017E-17 |
| CXCL10 | 1.444697765 | 1.327141928 | 1.572666485 | 1.9634E-17 |
| KLRB1 | 1.424623253 | 1.252339783 | 1.620607633 | 7.38551E-08 |
| CD1C | 1.304011289 | 1.106812658 | 1.536344413 | 0.001508233 |
| ITK | 1.304789296 | 1.212904297 | 1.403635153 | 9.29442E-13 |
| CCL20 | 1.528458983 | 1.379381296 | 1.693648355 | 5.37739E-16 |
| EOMES | 1.850243392 | 1.563956973 | 2.18893529 | 7.26351E-13 |
| HOXA5 | 1.487580596 | 1.37233437 | 1.612504996 | 4.77108E-22 |
| HOXB4 | 1.356548073 | 1.268566382 | 1.450631752 | 4.961E-19 |
| HOXC5 | 1.355479717 | 1.247924496 | 1.47230483 | 5.56712E-13 |
| HOXC6 | 1.398363699 | 1.299196088 | 1.505100771 | 4.09751E-19 |
| CCR2 | 1.515505644 | 1.3446989 | 1.708008654 | 9.46906E-12 |
| CD3G | 1.97053978 | 1.675350136 | 2.317740596 | 2.56698E-16 |
| CXCR6 | 1.632790049 | 1.434214112 | 1.858860069 | 1.25766E-13 |
| GZMK | 1.463623123 | 1.304237832 | 1.642486205 | 9.46095E-11 |
| SLAMF1 | 1.819797159 | 1.547395713 | 2.140151786 | 4.58977E-13 |
| HOXA6 | 1.662424064 | 1.494113871 | 1.849694204 | 1.03216E-20 |
| HOXA7 | 1.345855826 | 1.259788559 | 1.437803106 | 1.26014E-18 |
| HOXB5 | 1.358497599 | 1.260754795 | 1.46381813 | 8.83251E-16 |
| HOXB6 | 1.326695547 | 1.210956287 | 1.453496788 | 1.28002E-09 |
| ICOS | 1.920980315 | 1.636669811 | 2.254679195 | 1.36592E-15 |
| PTPN2 | 3.495063245 | 2.621384416 | 4.659929698 | 1.50998E-17 |
| SERPINB2 | 1.066398994 | 0.956099402 | 1.189423205 | 0.248475874 |
| HLA-DQB2 | 1.429799876 | 1.289408444 | 1.585477196 | 1.19892E-11 |
| TREM1 | 1.396376391 | 1.288781934 | 1.512953412 | 3.31576E-16 |
| GZMH | 1.543481182 | 1.366668852 | 1.743168549 | 2.70548E-12 |
| HOXA4 | 1.378181402 | 1.288339219 | 1.474288719 | 1.09728E-20 |
| IDO1 | 1.394241778 | 1.279359915 | 1.519439612 | 3.58653E-14 |
| EMR1 | 1.339801159 | 1.22325332 | 1.467453319 | 2.97954E-10 |
| HOXA3 | 1.411515491 | 1.315087781 | 1.515013681 | 1.33904E-21 |
| HOXC13 | 1.393680779 | 1.295503313 | 1.499298454 | 5.26971E-19 |
| HOXC8 | 1.37465946 | 1.281366075 | 1.474745327 | 7.04381E-19 |
| MMP1 | 1.306961437 | 1.19148689 | 1.433627355 | 1.41002E-08 |
| SAA1 | 1.283128792 | 1.219917417 | 1.349615534 | 3.95869E-22 |
| CLEC12A | 1.644937171 | 1.464824546 | 1.847196174 | 4.04077E-17 |
| HOXA2 | 1.394805161 | 1.299252034 | 1.497385716 | 3.92337E-20 |
| HOXC10 | 1.341228692 | 1.261587965 | 1.425896927 | 5.45794E-21 |
| HOXC11 | 1.403993146 | 1.302969576 | 1.512849409 | 5.28754E-19 |
| HOXC9 | 1.436720784 | 1.331802034 | 1.549904985 | 7.54091E-21 |
| ZNF688 | 0.874617662 | 0.624701343 | 1.224514824 | 0.435228095 |
| GATA4 | 1.241703748 | 1.167891593 | 1.32018092 | 4.40649E-12 |
| HOXA9 | 1.39322244 | 1.289617922 | 1.505150273 | 4.05828E-17 |
| HOXB8 | 1.254756043 | 1.176395478 | 1.338336261 | 5.29039E-12 |
| HOXB9 | 1.500349523 | 1.367894648 | 1.645630162 | 7.75209E-18 |
| LY9 | 1.67557693 | 1.427630369 | 1.966586106 | 2.66302E-10 |
| MYOD1 | 0.539023747 | 0.439750921 | 0.660707202 | 2.67179E-09 |
| UBASH3A | 1.567325372 | 1.384392666 | 1.774430682 | 1.27879E-12 |
| WT1 | 1.335635519 | 1.234997982 | 1.44447381 | 4.46098E-13 |
| CD70 | 1.432034962 | 1.309320043 | 1.566251234 | 3.96289E-15 |
| HOXB3 | 1.345372479 | 1.266243377 | 1.429446454 | 8.59509E-22 |
| HOXD10 | 1.379600692 | 1.288315904 | 1.477353546 | 3.17174E-20 |
| MMP7 | 1.226784337 | 1.142975571 | 1.316738388 | 1.50129E-08 |
| NKX2-5 | 1.444403467 | 1.34504005 | 1.551107252 | 4.9136E-24 |
| PAX3 | 1.387602684 | 1.296537487 | 1.485064048 | 3.12651E-21 |
| POSTN | 1.278881874 | 1.215527437 | 1.345538405 | 2.32988E-21 |
| SKAP2 | 1.895375614 | 1.597045547 | 2.249434103 | 2.52333E-13 |
| CEACAM4 | 1.476404054 | 1.258849233 | 1.731556785 | 1.66575E-06 |
| FPR2 | 1.490163867 | 1.326673876 | 1.67380122 | 1.72684E-11 |
| HOXA1 | 1.697129654 | 1.52345432 | 1.890604152 | 7.77973E-22 |
| HOXD11 | 1.38815997 | 1.295848113 | 1.487047814 | 9.49276E-21 |
| C19orf59 | 1.546978426 | 1.394142512 | 1.716569311 | 2.02504E-16 |
| TNFSF14 | 1.608910103 | 1.441944692 | 1.795208744 | 1.78337E-17 |
| ADAMDEC1 | 1.389433804 | 1.281737235 | 1.506179459 | 1.35046E-15 |
| AREG | 1.38785747 | 1.242507701 | 1.550210397 | 6.36893E-09 |
| CLEC5A | 1.470656313 | 1.341530655 | 1.612210637 | 1.93109E-16 |
| CSTA | 1.556115415 | 1.37713758 | 1.758353864 | 1.3108E-12 |
| DEFA1B | 1.272612393 | 1.15436257 | 1.402975412 | 1.26672E-06 |
| HOXD13 | 1.347733466 | 1.262427352 | 1.438803979 | 3.71652E-19 |
| LTF | 1.211324452 | 1.157232844 | 1.26794442 | 1.9472E-16 |
| MYBPH | 1.51820243 | 1.390962593 | 1.657081672 | 8.83792E-21 |
| PI3 | 1.274011507 | 1.196291544 | 1.356780735 | 4.67323E-14 |
| SIRPG | 1.908303098 | 1.607189367 | 2.26583176 | 1.63867E-13 |
| VGLL2 | 1.455690311 | 1.328701794 | 1.594815549 | 7.47498E-16 |
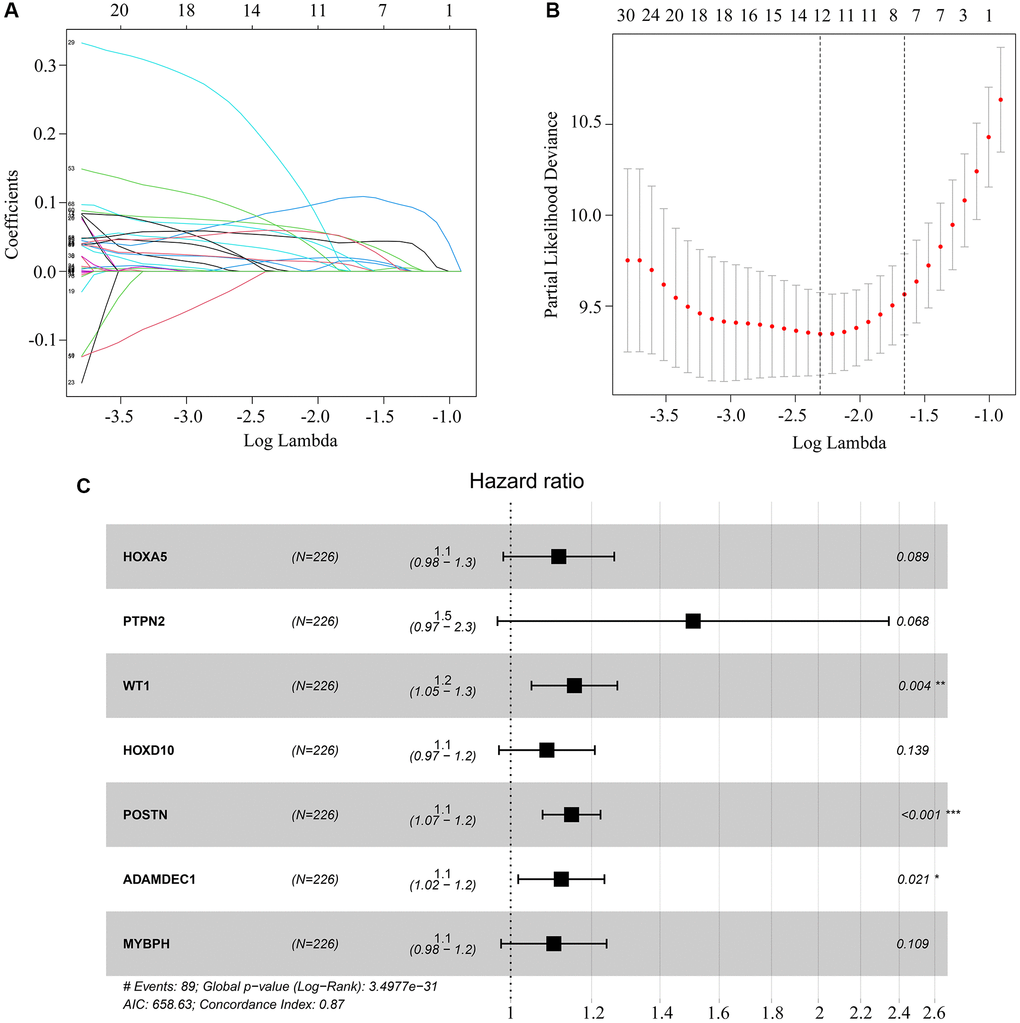
Figure 4. Key genes selected for risk model construction. (A, B) LASSO analysis of key genes associated with survival in ATRX-wt glioma patients. (C) Multivariate Cox regression analysis of HOXA5, PTPN2, WT1, HOXD10, POSTN, ADAMDEC1 and MYBPH. These seven genes were used for risk model construction.
Risk model validation for ATRX-wt glioma patients from TCGA
Next, we randomized ATRX-wt glioma patients from TCGA into training and testing groups to evaluate the applicability of the risk model. The median risk score of ATRX-wt glioma patients in the training cohort was used to divide patients into high-risk and low-risk groups (Figure 5A). The overall survival rate was lower in the high-risk group than in the low-risk group (Figure 5B). The area under the curve (AUC) values for predicting survival after one, three and five years in ATRX-wt glioma patients from TCGA were 0.905, 0.917 and 0.883, respectively (Figure 5C–5E). The proportion of deaths among ATRX-wt glioma patients in the training cohort was higher in the high-risk-score group than in the low-risk-score group (Figure 5F). In glioma tissues from the high-risk group of the training cohort, HOXA5, PTPN2, WT1, HOXD10, POSTN, ADAMDEC1 and MYBPH were highly expressed (Figure 5G).
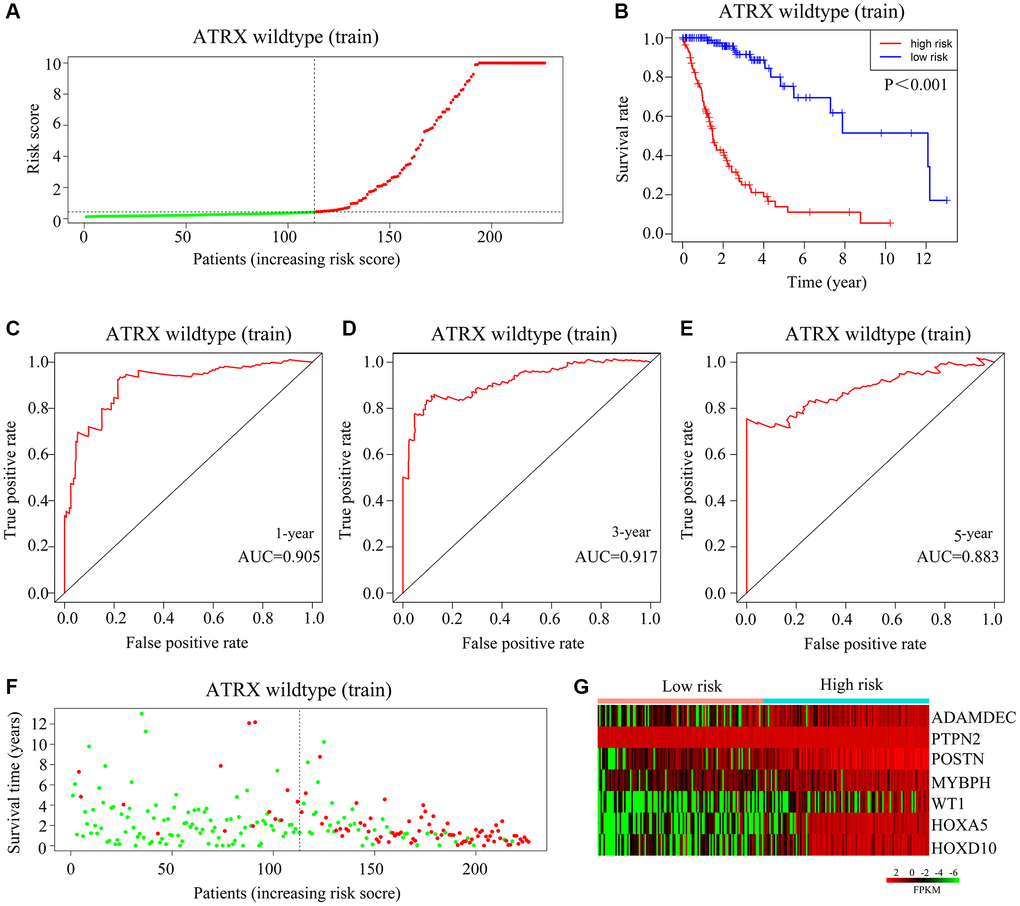
Figure 5. Validation of the applicability of the risk model in the training cohort of ATRX-wt glioma patients. (A) ATRX-wt glioma patients in the training cohort were divided into high- and low-risk-score groups based on the median risk score. (B) Survival differences between ATRX-wt glioma patients in the high- and low-risk-score groups in the training cohort. (C–E) Prognostic value of the risk model for the one-, three- and five-year survival of ATRX-wt glioma patients in the training cohort. (F) Deaths of ATRX-wt glioma patients in the high- and low-risk-score groups in the training cohort (green dots represent living cases; red dots represent dead cases). (G) Expression of HOXA5, PTPN2, WT1, HOXD10, POSTN, ADAMDEC1 and MYBPH in glioma patients in the high- and low-risk-score groups in the training cohort.
We then validated the model using the test cohort. Again, ATRX-wt glioma patients were divided into high- and low-risk groups based on the median risk score (Figure 6A). Glioma patients with high-risk scores were more likely to die than those with low-risk scores (Figure 6B). The AUCs for predicting survival after one, three and five years in ATRX-wt glioma patients from the test cohort were 0.882, 0.885 and 0.825, respectively (Figure 6C–6E). The death rate of the high-risk group of glioma patients was higher in the test cohort than in the high-risk-score group than in the low-risk-score group (Figure 6F). In the test cohort, HOXA5, PTPN2, WT1, HOXD10, POSTN, ADAMDEC1 and MYBPH levels were elevated in glioma tissues with high-risk scores (Figure 6G). Thus, our risk model exhibited significant prognostic value in ATRX-wt glioma patients.
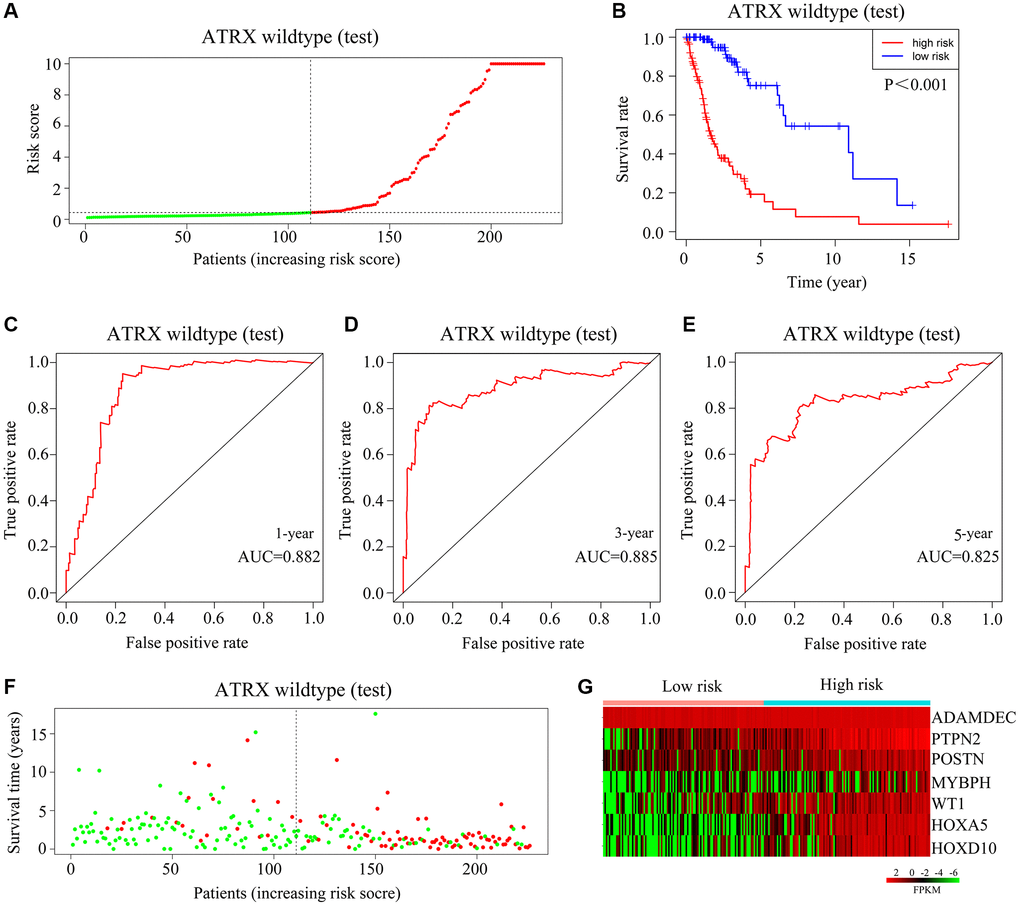
Figure 6. Validation of the applicability of the risk model in the test cohort of ATRX-wt glioma patients. (A) ATRX-wt glioma patients in the test cohort were divided into high- and low-risk-score groups based on the median risk score. (B) Survival differences between ATRX-wt glioma patients in the high- and low-risk-score groups in the test cohort. (C–E) Prognostic value of the risk model for one-, three- and five-year survival in ATRX-wt glioma patients in the test cohort. (F) Deaths of ATRX-wt glioma patients in the high- and low-score groups in the test cohort (green dots represent living cases; red dots represent dead cases). (G) Expression of HOXA5, PTPN2, WT1, HOXD10, POSTN, ADAMDEC1 and MYBPH in glioma patients in the high- and low-risk-score groups of the test cohort.
Exploring the applicability of the risk model for ATRX-mt glioma patients from TCGA
Next, we classified ATRX-mt patients from TCGA into high- and low-risk groups based on the median risk score (Figure 7A). High risk scores were associated with a lower survival rate than low risk scores (Figure 7B). However, the AUCs for predicting one-, three- and five-year survival among ATRX-mt glioma patients were 0.53, 0.543 and 0.524, respectively (Figure 7C–7E). Moreover, the death rates for ATRX-mt glioma patients did not differ significantly between the high- and low-risk groups (Figure 7F). Nevertheless, HOXA5, PTPN2, WT1, HOXD10, POSTN, ADAMDEC1 and MYBPH were overexpressed in ATRX-mt glioma tissues with high-risk scores compared with low-risk scores (Figure 7G). These results demonstrated that the risk model constructed with HOXA5, PTPN2, WT1, HOXD10, POSTN, ADAMDEC1 and MYBPH could not accurately predict survival in ATRX-mt glioma patients, although it could in ATRX-wt glioma patients.
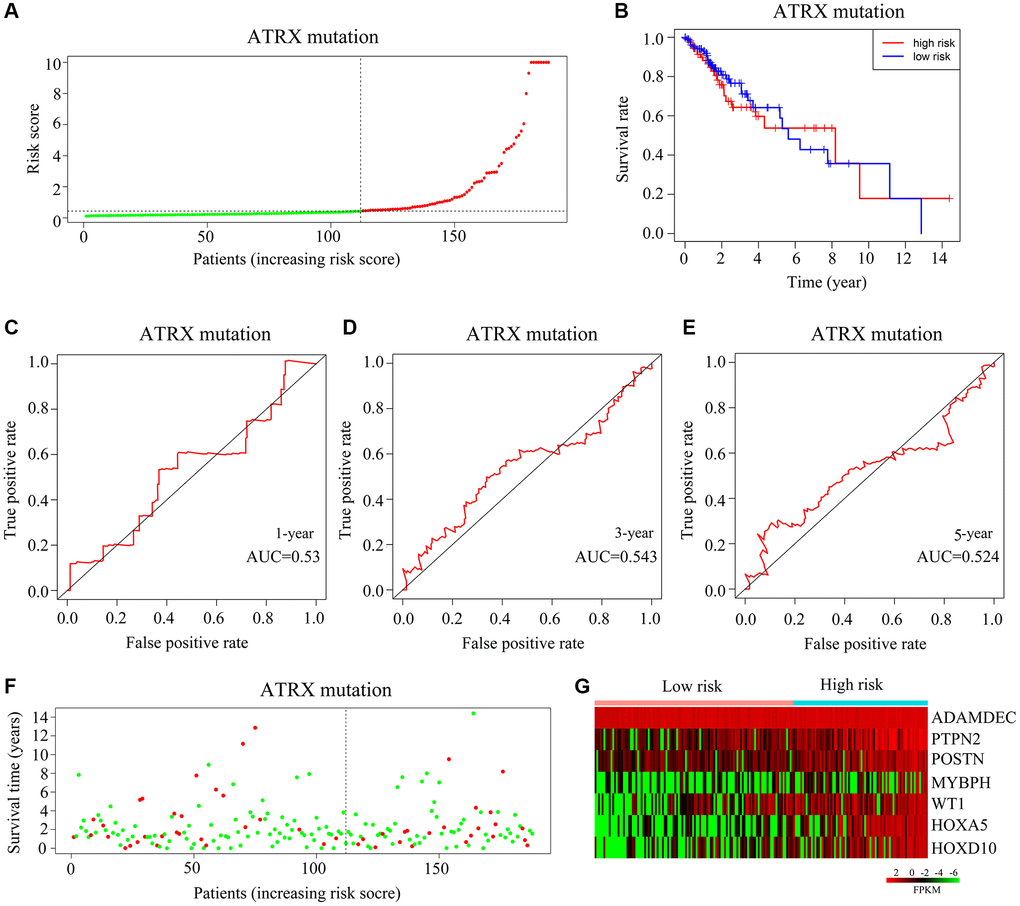
Figure 7. Validation of the applicability of the risk model in ATRX-mt glioma patients from TCGA. (A) ATRX-mt glioma patients from TCGA were divided into high- and low-risk-score groups based on the median risk score. (B) Survival differences between the high- and low-risk-score groups of ATRX-mt glioma patients from TCGA. (C–E) Prognostic value of the risk model for the one-, three- and five-year survival of ATRX-mt glioma patients from TCGA. (F) Deaths of ATRX-mt glioma patients from TCGA in the high- and low-risk-score groups (green dots represent living cases; red dots represent dead cases). (G) Expression of HOXA5, PTPN2, WT1, HOXD10, POSTN, ADAMDEC1 and MYBPH in ATRX-mt glioma tissues from the high- and low-risk-score groups.
Immune characteristics as an independent prognostic factor for ATRX-wt glioma patients
Our multivariate Cox regression analysis indicated that the HOXA5-derived immune signature was independently associated with the outcomes of ATRX-wt glioma patients. We used this signature risk score and patients’ clinical characteristics to create a nomogram (Figure 8A), which had high prognostic value for survival at one, three and five years (Figure 8B).
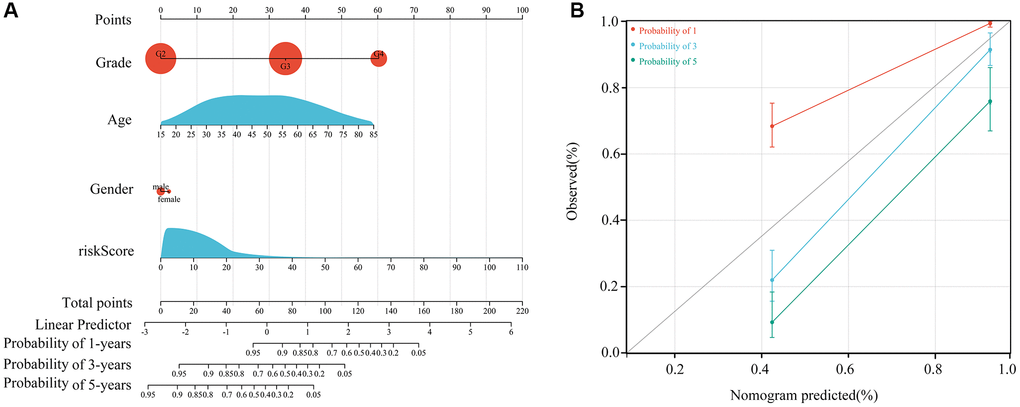
Figure 8. Construction of the nomogram. (A) Construction of a nomogram using age, sex, grade and risk score. (B) Nomogram in glioma patients with one-, three- and five-year survival.
Expression of HOXA5, PTPN2, WT1, HOXD10, POSTN, ADAMDEC1 and MYBPH in ATRX-wt glioma tissues
Next, we obtained 54 glioma tissues from patients at Guizhou Medical University Affiliated Hospital, and divided them according to whether the patients survived long-term (≥15 months) or short-term (<15 months). Then, we performed quantitative real-time PCR and immunohistochemical analyses to detect the mRNA and protein levels of HOXA5, PTPN2, WT1, HOXD10, POSTN, ADAMDEC1 and MYBPH in these tissues. These genes were expressed at significantly higher levels in glioma tissues from short-term survivors than in those from long-term survivors (Supplementary Figure 1; Figure 9A, 9B). A receiver operating characteristic curve analysis indicated that HOXA5, PTPN2, WT1, HOXD10, POSTN, ADAMDEC1 and MYBPH had significant prognostic value for the survival of ATRX-wt glioma patients (AUC = 0.84, 0.81, 0.79, 0.91, 0.80, 0.79 and 0.85, respectively) (Figure 9C).
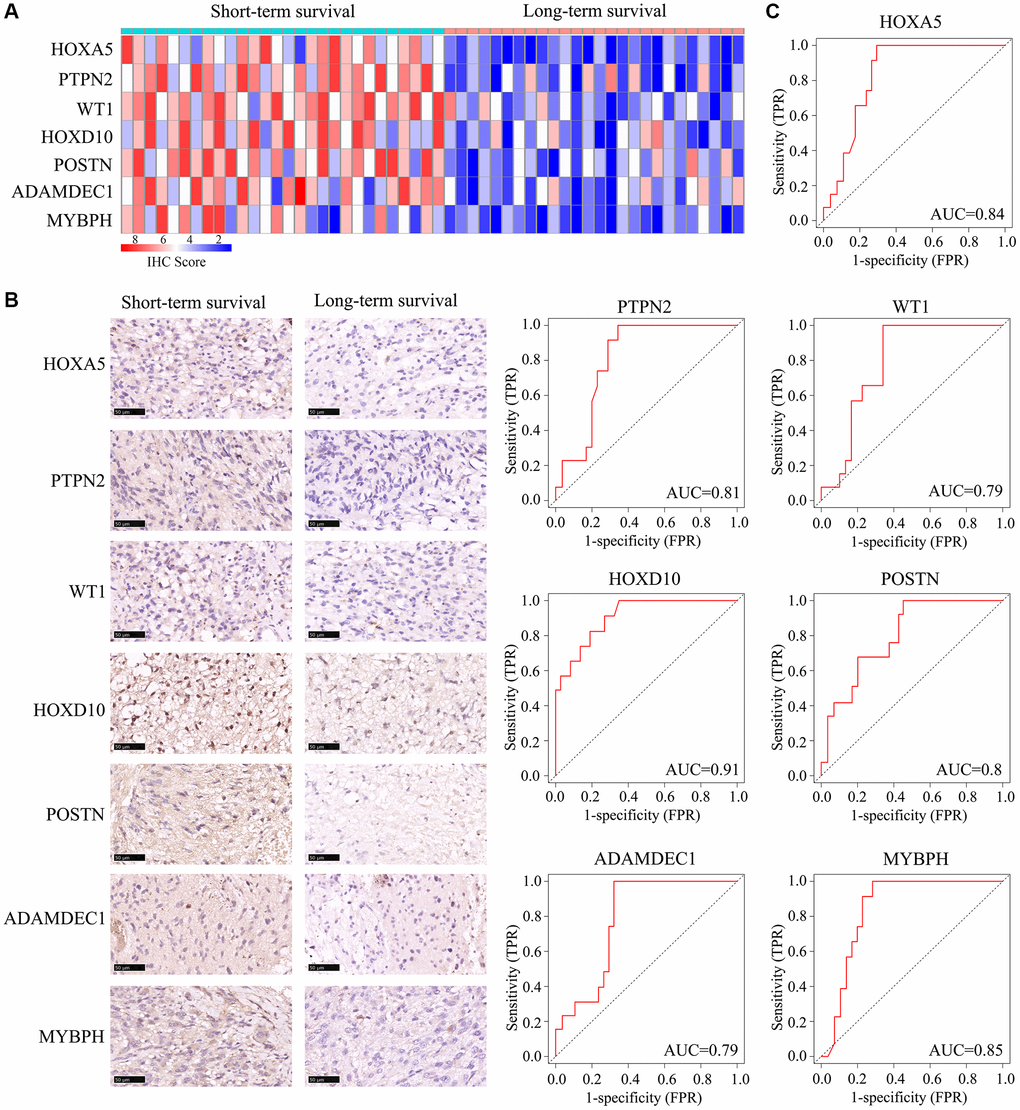
Figure 9. Expression of HOXA5, PTPN2, WT1, HOXD10, POSTN, ADAMDEC1 and MYBPH in ATRX-wt glioma tissues. ATRX-wt patients were divided into long-term and short-term survival groups based on a cut-off of 15 months. (A) Immunohistochemistry scores for HOXA5, PTPN2, WT1, HOXD10, POSTN, ADAMDEC1 and MYBPH in ATRX-wt glioma tissues. (B) Representative plots of HOXA5, PTPN2, WT1, HOXD10, POSTN, ADAMDEC1 and MYBPH expression in ATRX-wt glioma tissues from the long- and short-term survival groups. (C) Prognostic value of HOXA5, PTPN2, WT1, HOXD10, POSTN, ADAMDEC1 and MYBPH1 in distinguishing ATRX-wt glioma patients with long- and short-term survival.
Immunological properties of immune markers
We then used the “CIBERSORT” R package to evaluate immune cell infiltration in ATRX-wt glioma tissues from TCGA, and found that 22 types of immune cells infiltrated differently in the high- vs. low-risk groups. CD8+ T cells, naive CD4+ T cells, monocytes, M1 macrophages and M0 macrophages were in higher proportion in glioma tissues with low-risk scores (Figure 10A–10C). We also evaluated the response to ICB treatment in the high- and low-risk ATRX-wt groups, and found that patients in the low-risk group had a higher response rate to ICB treatment (Figure 10D). Thus, our risk model can be used to predict the prognosis and treatment responsiveness of ATRX-wt patients.
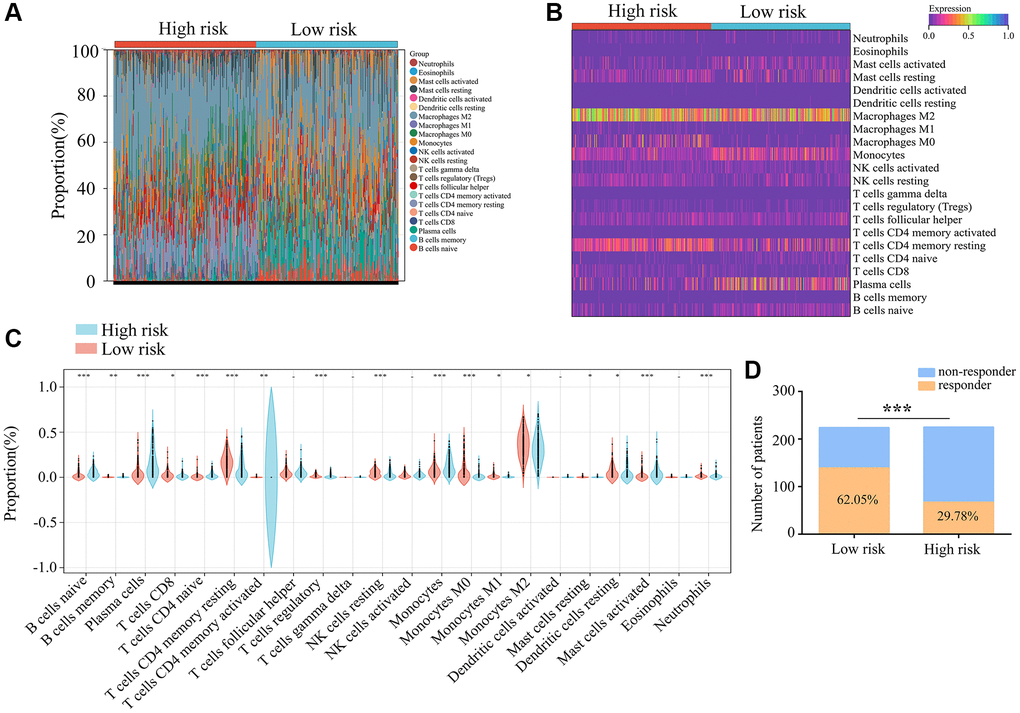
Figure 10. Immunological characteristics of the three immune features. (A, B) Gene expression profiles of the high- and low-risk-score groups of ATRX-wt glioma tissues from TCGA were transformed into 22 immune cell expression matrices. (C) Immune cell differences between the high- and low-risk groups of ATRX-wt glioma tissues from TCGA. (D) Responders and non-responders to ICB treatment among ATRX-wt glioma patients in the high- and low-risk groups. *P < 0.05; **P < 0.01; ***P < 0.001.
Patients with high-risk glioma may benefit from rapamycin, dasatinib, 5-fluorouracil and gemcitabine
Lastly, we used the OncoPredict algorithm to derive a drug sensitivity model from the gene expression data in the ATRX-wt atlas. We evaluated a total of 198 inhibitors, and noted that high-risk glioma tissues were predicted to be sensitive to rapamycin, dasatinib, 5-fluorouracil and gemcitabine (Supplementary Table 3; Figure 11A–11E). This evidence suggests that rapamycin, dasatinib, 5-fluorouracil and gemcitabine may be useful drugs for patients with high-risk gliomas.

Figure 11. Selection of appropriate drugs for glioma patients in the high-risk group. (A–E) OncoPredict showed that the drug scores for rapamycin, dasatinib, 5-fluorouracil and gemcitabine differed between glioma patients in the high- and low-risk groups. ***P < 0.001.
Discussion
Abnormal ATRX expression has been detected in a variety of malignant tumors [10, 11]. ATRX mutations have been observed in neuroblastomas, pancreatic neuroendocrine tumors and pediatric osteosarcomas [12, 13]. ATRX protein contains a C-terminal helicase/ATPase domain, and belongs to the SWI/SNF2 chromatin remodeling protein family [14]. The N-terminal ATRX–DNA methyltransferase 3–DNA methyltransferase 3-like (‘ADD’) domain contains a plant homeodomain and a GATA zinc finger structure [15]. The GATA zinc finger can bind to DNA or chromatin, while the plant homeodomain participates in chromatin regulation and transcription [16, 17].
Previous studies have indicated that the immune microenvironment influences the progression of ATRX-wt gliomas [12]. We compared the survival of ATRX-wt glioma patients with high and low stromal/immune scores, and found that patients with low scores had a higher survival rate. We also assessed the DEGs between ATRX-wt glioma patients with high and low stromal/immune scores, and used them to generate a PPI network. We found that 80 of the 162 DEGs interacted with other genes and were significantly associated with patients’ prognoses. Using LASSO and Cox regression analyses, we identified HOXA5, PTPN2, WT1, HOXD10, POSTN, ADAMDEC1 and MYBPH as independent predictors of survival. Based on the expression of these genes, we then generated immune profiles to classify ATRX-wt glioma patients as high- or low-risk.
The seven genes identified in this study have been associated with cancer in previous studies. For instance, alterations in the HOX family members HOXA5 and HOXD10 have been implicated in the development and progression of cancer [18, 19]. In non-small cell lung cancer, HOXA5 was found to promote apoptosis and inhibit proliferation by upregulating linc00312 expression [20]. HOXD10 was identified as a biological correlate of tumor suppressor DNA and an inducer of miRNA-7 and insulin-like growth factor binding protein 3 in colorectal cancer [21]. In tumor cells, PTPN2 was shown to enhance antigen presentation and growth arrest [22]. WT1 has been detected in hematologic malignancies and solid tumors (breast, lung, pancreatic and prostate cancers). Furthermore, WT1 protein has high immunogenicity, suggesting that it may be a useful therapeutic agent in patients with WT1 gene amplification [23]. Ovarian cancer cells incorporating POSTN from cancer-associated fibroblasts were reported to migrate and invade more effectively due to phosphoinositide 3-kinase/Akt pathway activation [24]. In the same study, the pro-metastatic and fibroblast-activating properties of transforming growth factor β1 were shown to depend partially on POSTN [24]. MYBPH was found to suppress Rho-associated coiled-coil containing protein kinase 1 and inhibit actin organization, thus impairing single cell motility, increasing collective cell migration, and reducing cancer invasion and metastasis [25]. Downregulation of ADAMDEC1 was shown to upregulate active caspases 3 and 9, inhibit proliferation and induce apoptosis in glioma cells [26]. We constructed a risk model using HOXA5, PTPN2, WT1, HOXD10, POSTN, ADAMDEC1 and MYBPH expression data from a cohort of patients in TCGA, and found that it had significant prognostic value for ATRX-wt glioma patients.
The tumor environment consists of cancer cells, immune cells, inflammatory cells, tumor-associated fibroblasts and various cytokines [27]. Immune cells within the tumor microenvironment influence the progression of glioma [27]. Glioma tissues contain a high proportion of M2 macrophages, which have the potential to promote glioma cell invasion through angiogenesis, while M1 cells have the potential to suppress angiogenesis [28, 29]. Natural killer cells and CD8+ T cells are susceptible to senescence in gliomas [30, 31]. Little has been known about the immune signature of ATRX-wt glioma, but we found that ATRX-wt patients with low risk scores tended to have higher levels of M1 and CD8+ T cells, suggesting that these infiltrating cells were able to kill cancer cells.
In order for the host to kill cancer cells, immune checkpoints need to be blocked so that deactivated cells can be reactivated. ICB therapy has shown significant curative effects in hepatocellular carcinoma and breast cancer patients [32, 33]. We found evidence that CD8+ T cell and M1 cell inactivation were inhibited in the tumor microenvironment of ATRX-wt glioma patients with low risk scores; thus, we analyzed whether ICB therapy was beneficial for low-risk ATRX-wt glioma patients. ICB therapy response rates were higher among low-risk patients than among high-risk patients, suggesting that ATRX-wt glioma patients with low risk scores may benefit from ICB therapy. An OncoPredict analysis predicted that high-risk glioma patients would be more sensitive to rapamycin, dasatinib, 5-fluorouracil and gemcitabine.
In conclusion, our study revealed that an immune signature based on HOXA5, PTPN2, WT1, HOXD10, POSTN, ADAMDEC1 and MYBPH expression effectively predicted the prognosis of ATRX-wt glioma patients, and demonstrated that immunotherapy was effective for low-risk patients. Our immune signature may be helpful in diagnosing and treating ATRX-wt glioma patients.
Materials and Methods
Downloading and preprocessing gene expression profiles
The gene expression profiles and clinical characteristics of 452 ATRX-wt and 188 ATRX-mt glioma patients were obtained from TCGA. The gene expression profiles were normalized and centralized, and gene names were assigned to the probes. The immune and stromal scores of the ATRX-wt glioma tissues were calculated using the ESTIMATE algorithm.
DEG analysis
The median immune and stromal scores from the dataset in TCGA were used to divide patients into high- or low-scoring groups. DEG analysis was performed using EdgeR, with an adjusted P-value of 0.05 and a |logFold-Change| <1 set as the threshold for significance. Volcano plots and heat maps were used to visualize gene expression changes in the groups with high immune/stromal scores [34].
PPI network
A PPI network was constructed by mapping DEG information to the Search Tool for the Retrieval of Interacting Genes (STRING) database. Isolated genes were removed from the original PPI network using Cytoscape software. A visual analysis was performed, and reciprocally related genes were designated as hub genes and included in the next step.
Functional and pathway enrichment analysis
The Database for Annotation, Visualization and Integrated Discovery was used to analyze the enriched KEGG and Gene Ontology terms of genes. Three categories were used for the Gene Ontology analysis: Biological Processes, Cellular Components and Molecular Functions. A bubble diagram was used to present the terms to determine significance.
Immune signature construction and verification
In ATRX-wt patients, a univariate Cox regression analysis with a significance threshold was used to construct an immune signature. A LASSO operator with an appropriate penalty was used to eliminate genes with the same genetic information. A prognostic risk model was developed using multivariate Cox regression analysis with the Akaike information criterion. Kaplan-Meier survival analyses and receiver operating characteristic curve analyses were used for ATRX-wt and ATRX-mt glioma patients [35].
Construction of column line diagrams
The “rms” package in R was used to create column line plots and conduct a multi-factor regression analysis. Asymptotic lines were then used to plot on the same plane at a certain scale. The accuracy of the line plot was predicted, and the prognostic value of the line plot was determined.
Immune cell analysis
Using the “CIBERSORT” R package, we examined 22 immune cells infiltrating ATRX-wt glioma tissues in TCGA. Differentially infiltrated cells in the high- and low-risk-score groups were analyzed using the unpaired t-test, with significance set as P < 0.05.
Immunohistochemical analysis
Throughout Guizhou Medical University Affiliated Second People Hospital of Guiyang, 54 ATRX-wt glioma tissues were collected with approval from the Guizhou Medical University Human Ethics Committee. All participants provided informed consent before they were given radiotherapy or chemotherapy. Immunohistochemical staining was performed as described in a previous study [36]. The sections were probed with the following antibodies: HOXA5 (1:200; ab140636, Abcam, Cambridge, UK), PTPN2 (1:100; 11214-1-AP, Proteintech, Wuhan, China), WT1 (1:100; 12609-1-AP, Proteintech), POSTN (1:100; 66491-1-Ig, Proteintech), ADAMDEC1 (1:100; 17899-1-AP, Proteintech), MYBPH (1:100; ab197216, Abcam) and HOXD10 (1:100; ab138508, Abcam).
Drug score analysis
In vivo drug responses can be predicted using OncoPredict, an algorithm developed by Maeser et al. [37]. In order to calculate the drug sensitivity of gliomas, OncoPredict scripts were used to match the gene expression matrix of each glioma sample to the chemotherapeutic effects of drugs recorded in Cancer and the gene expression information for cancer lines in the Broad Institute Cancer Cell Line Encyclopedia. Glioma patients with higher drug scores are less sensitive to drugs. The limma package was used to analyze the differences in drug scores between those at high and low risk. A |logFold-Change| ≥1 and adjusted P < 0.05 were used as cut-offs for determining significance.
Availability of data and materials
The datasets used and/or analyzed during the current study are available from the corresponding author on reasonable request.
Supplementary Materials
Author Contributions
Wenfeng Yu, Wenpeng Cao and Shan Lei designed the experiments and wrote the manuscript; Zhirui Zeng and Shipeng Luo prepared Figures 1–6; Wenpeng Cao, Ping Sun, Shan Lei and Chaolun Xiao prepared Figures 7–11. The final version of the manuscript was reviewed and approved by all of the authors.
Conflicts of Interest
The authors declare that this research was conducted in the absence of any commercial or financial relationships that could be construed as a potential conflict of interest.
Ethical Statement and Consent
The Human Research Ethics Review Committee of Guizhou Medical University approved the use of the 54 glioma tissues samples (approval number: 2022-42). This study was performed according to the tenets of the Declaration of Helsinki. All participants provided informed consent before they were given radiotherapy or chemotherapy.
Funding
This study was supported by the National Natural Science Foundation of China (82160567), Department of Education of Guizhou Province (Guizhou Teaching and Technology (2023) 015).
References
- 1. Friedrich M, Hahn M, Michel J, Sankowski R, Kilian M, Kehl N, Günter M, Bunse T, Pusch S, von Deimling A, Wick W, Autenrieth SE, Prinz M, et al. Dysfunctional dendritic cells limit antigen-specific T cell response in glioma. Neuro Oncol. 2023; 25:263–76. https://doi.org/10.1093/neuonc/noac138 [PubMed]
- 2. Śledzińska P, Bebyn MG, Furtak J, Kowalewski J, Lewandowska MA. Prognostic and Predictive Biomarkers in Gliomas. Int J Mol Sci. 2021; 22:10373. https://doi.org/10.3390/ijms221910373 [PubMed]
- 3. Cantero D, Mollejo M, Sepúlveda JM, D'Haene N, Gutiérrez-Guamán MJ, Rodríguez de Lope Á, Fiaño C, Castresana JS, Lebrun L, Rey JA, Salmon I, Meléndez B, Hernández-Laín A. TP53, ATRX alterations, and low tumor mutation load feature IDH-wildtype giant cell glioblastoma despite exceptional ultra-mutated tumors. Neurooncol Adv. 2020; 2:vdz059. https://doi.org/10.1093/noajnl/vdz059 [PubMed]
- 4. Cimino PJ, Ketchum C, Turakulov R, Singh O, Abdullaev Z, Giannini C, Pytel P, Lopez GY, Colman H, Nasrallah MP, Santi M, Fernandes IL, Nirschl J, et al. Expanded analysis of high-grade astrocytoma with piloid features identifies an epigenetically and clinically distinct subtype associated with neurofibromatosis type 1. Acta Neuropathol. 2023; 145:71–82. https://doi.org/10.1007/s00401-022-02513-5 [PubMed]
- 5. Aguilera P, López-Contreras AJ. ATRX, a guardian of chromatin. Trends Genet. 2023; 39:505–19. https://doi.org/10.1016/j.tig.2023.02.009 [PubMed]
- 6. Haase S, Garcia-Fabiani MB, Carney S, Altshuler D, Núñez FJ, Méndez FM, Núñez F, Lowenstein PR, Castro MG. Mutant ATRX: uncovering a new therapeutic target for glioma. Expert Opin Ther Targets. 2018; 22:599–613. https://doi.org/10.1080/14728222.2018.1487953 [PubMed]
- 7. Chen J, Wang Z, Wang W, Ren S, Xue J, Zhong L, Jiang T, Wei H, Zhang C. SYT16 is a prognostic biomarker and correlated with immune infiltrates in glioma: A study based on TCGA data. Int Immunopharmacol. 2020; 84:106490. https://doi.org/10.1016/j.intimp.2020.106490 [PubMed]
- 8. Zhu Z, Lan Y, Wang L, Ge J, Wang J, Liu F, He Z, Zhang H, Luo M, Lin D, Tan Y, Xu Y, Luo T. A nuclear transport-related gene signature combined with IDH mutation and 1p/19q codeletion better predicts the prognosis of glioma patients. BMC Cancer. 2020; 20:1072. https://doi.org/10.1186/s12885-020-07552-3 [PubMed]
- 9. Feng S, Liu H, Dong X, Du P, Guo H, Pang Q. Identification and validation of an autophagy-related signature for predicting survival in lower-grade glioma. Bioengineered. 2021; 12:9692–708. https://doi.org/10.1080/21655979.2021.1985818 [PubMed]
- 10. Fan HC, Chen CM, Chi CS, Tsai JD, Chiang KL, Chang YK, Lin SZ, Harn HJ. Targeting Telomerase and ATRX/DAXX Inducing Tumor Senescence and Apoptosis in the Malignant Glioma. Int J Mol Sci. 2019; 20:200. https://doi.org/10.3390/ijms20010200 [PubMed]
- 11. Jiao Y, Shi C, Edil BH, de Wilde RF, Klimstra DS, Maitra A, Schulick RD, Tang LH, Wolfgang CL, Choti MA, Velculescu VE, Diaz LA
Jr , Vogelstein B, et al. DAXX/ATRX, MEN1, and mTOR pathway genes are frequently altered in pancreatic neuroendocrine tumors. Science. 2011; 331:1199–203. https://doi.org/10.1126/science.1200609 [PubMed] - 12. Babikir H, Wang L, Shamardani K, Catalan F, Sudhir S, Aghi MK, Raleigh DR, Phillips JJ, Diaz AA. ATRX regulates glial identity and the tumor microenvironment in IDH-mutant glioma. Genome Biol. 2021; 22:311. https://doi.org/10.1186/s13059-021-02535-4 [PubMed]
- 13. van Gerven MR, Bozsaky E, Matser YAH, Vosseberg J, Taschner-Mandl S, Koster J, Tytgat GAM, Molenaar JJ, van den Boogaard M. Mutational spectrum of ATRX aberrations in neuroblastoma and associated patient and tumor characteristics. Cancer Sci. 2022; 113:2167–78. https://doi.org/10.1111/cas.15363 [PubMed]
- 14. Pang Y, Chen X, Ji T, Cheng M, Wang R, Zhang C, Liu M, Zhang J, Zhong C. The Chromatin Remodeler ATRX: Role and Mechanism in Biology and Cancer. Cancers (Basel). 2023; 15:2228. https://doi.org/10.3390/cancers15082228 [PubMed]
- 15. Argentaro A, Yang JC, Chapman L, Kowalczyk MS, Gibbons RJ, Higgs DR, Neuhaus D, Rhodes D. Structural consequences of disease-causing mutations in the ATRX-DNMT3-DNMT3L (ADD) domain of the chromatin-associated protein ATRX. Proc Natl Acad Sci U S A. 2007; 104:11939–44. https://doi.org/10.1073/pnas.0704057104 [PubMed]
- 16. Gulve N, Su C, Deng Z, Soldan SS, Vladimirova O, Wickramasinghe J, Zheng H, Kossenkov AV, Lieberman PM. DAXX-ATRX regulation of p53 chromatin binding and DNA damage response. Nat Commun. 2022; 13:5033. https://doi.org/10.1038/s41467-022-32680-8 [PubMed]
- 17. Tsai RX, Fang KC, Yang PC, Hsieh YH, Chiang IT, Chen Y, Lee HG, Lee JT, Chu HC. TERRA regulates DNA G-quadruplex formation and ATRX recruitment to chromatin. Nucleic Acids Res. 2022; 50:12217–34. https://doi.org/10.1093/nar/gkac1114 [PubMed]
- 18. Daugaard I, Dominguez D, Kjeldsen TE, Kristensen LS, Hager H, Wojdacz TK, Hansen LL. Identification and validation of candidate epigenetic biomarkers in lung adenocarcinoma. Sci Rep. 2016; 6:35807. https://doi.org/10.1038/srep35807 [PubMed]
- 19. Rodini CO, Xavier FC, Paiva KB, De Souza Setúbal Destro MF, Moyses RA, Michaluarte P, Carvalho MB, Fukuyama EE, Tajara EH, Okamoto OK, Nunes FD, and Head And Neck Genome Project Gencapo. Homeobox gene expression profile indicates HOXA5 as a candidate prognostic marker in oral squamous cell carcinoma. Int J Oncol. 2012; 40:1180–8. https://doi.org/10.3892/ijo.2011.1321 [PubMed]
- 20. Zhu Q, Lv T, Wu Y, Shi X, Liu H, Song Y. Long non-coding RNA 00312 regulated by HOXA5 inhibits tumour proliferation and promotes apoptosis in Non-small cell lung cancer. J Cell Mol Med. 2017; 21:2184–98. https://doi.org/10.1111/jcmm.13142 [PubMed]
- 21. Pan W, Wang K, Li J, Li H, Cai Y, Zhang M, Wang A, Wu Y, Gao W, Weng W. Restoring HOXD10 Exhibits Therapeutic Potential for Ameliorating Malignant Progression and 5-Fluorouracil Resistance in Colorectal Cancer. Front Oncol. 2021; 11:771528. https://doi.org/10.3389/fonc.2021.771528 [PubMed]
- 22. Manguso RT, Pope HW, Zimmer MD, Brown FD, Yates KB, Miller BC, Collins NB, Bi K, LaFleur MW, Juneja VR, Weiss SA, Lo J, Fisher DE, et al. In vivo CRISPR screening identifies Ptpn2 as a cancer immunotherapy target. Nature. 2017; 547:413–8. https://doi.org/10.1038/nature23270 [PubMed]
- 23. Zhang Y, Yan WT, Yang ZY, Li YL, Tan XN, Jiang J, Zhang Y, Qi XW. The role of WT1 in breast cancer: clinical implications, biological effects and molecular mechanism. Int J Biol Sci. 2020; 16:1474–80. https://doi.org/10.7150/ijbs.39958 [PubMed]
- 24. Yue H, Li W, Chen R, Wang J, Lu X, Li J. Stromal POSTN induced by TGF-β1 facilitates the migration and invasion of ovarian cancer. Gynecol Oncol. 2021; 160:530–8. https://doi.org/10.1016/j.ygyno.2020.11.026 [PubMed]
- 25. Hosono Y, Yamaguchi T, Mizutani E, Yanagisawa K, Arima C, Tomida S, Shimada Y, Hiraoka M, Kato S, Yokoi K, Suzuki M, Takahashi T. MYBPH, a transcriptional target of TTF-1, inhibits ROCK1, and reduces cell motility and metastasis. EMBO J. 2012; 31:481–93. https://doi.org/10.1038/emboj.2011.416 [PubMed]
- 26. Liu X, Huang H, Li X, Zheng X, Zhou C, Xue B, He J, Zhang Y, Liu L. Knockdown of ADAMDEC1 inhibits the progression of glioma in vitro. Histol Histopathol. 2020; 35:997–1005. https://doi.org/10.14670/HH-18-227 [PubMed]
- 27. Barthel L, Hadamitzky M, Dammann P, Schedlowski M, Sure U, Thakur BK, Hetze S. Glioma: molecular signature and crossroads with tumor microenvironment. Cancer Metastasis Rev. 2022; 41:53–75. https://doi.org/10.1007/s10555-021-09997-9 [PubMed]
- 28. Li D, Zhang Q, Li L, Chen K, Yang J, Dixit D, Gimple RC, Ci S, Lu C, Hu L, Gao J, Shan D, Li Y, et al. β2-Microglobulin Maintains Glioblastoma Stem Cells and Induces M2-like Polarization of Tumor-Associated Macrophages. Cancer Res. 2022; 82:3321–34. https://doi.org/10.1158/0008-5472.CAN-22-0507 [PubMed]
- 29. Wang X, Ding H, Li Z, Peng Y, Tan H, Wang C, Huang G, Li W, Ma G, Wei W. Exploration and functionalization of M1-macrophage extracellular vesicles for effective accumulation in glioblastoma and strong synergistic therapeutic effects. Signal Transduct Target Ther. 2022; 7:74. https://doi.org/10.1038/s41392-022-00894-3 [PubMed]
- 30. Ma R, Lu T, Li Z, Teng KY, Mansour AG, Yu M, Tian L, Xu B, Ma S, Zhang J, Barr T, Peng Y, Caligiuri MA, Yu J. An Oncolytic Virus Expressing IL15/IL15Rα Combined with Off-the-Shelf EGFR-CAR NK Cells Targets Glioblastoma. Cancer Res. 2021; 81:3635–48. https://doi.org/10.1158/0008-5472.CAN-21-0035 [PubMed]
- 31. Wang J, Toregrosa-Allen S, Elzey BD, Utturkar S, Lanman NA, Bernal-Crespo V, Behymer MM, Knipp GT, Yun Y, Veronesi MC, Sinn AL, Pollok KE, Brutkiewicz RR, et al. Multispecific targeting of glioblastoma with tumor microenvironment-responsive multifunctional engineered NK cells. Proc Natl Acad Sci U S A. 2021; 118:e2107507118. https://doi.org/10.1073/pnas.2107507118 [PubMed]
- 32. Chuah S, Lee J, Song Y, Kim HD, Wasser M, Kaya NA, Bang K, Lee YJ, Jeon SH, Suthen S, A'Azman S, Gien G, Lim CJ, et al. Uncoupling immune trajectories of response and adverse events from anti-PD-1 immunotherapy in hepatocellular carcinoma. J Hepatol. 2022; 77:683–94. https://doi.org/10.1016/j.jhep.2022.03.039 [PubMed]
- 33. Kim IS, Gao Y, Welte T, Wang H, Liu J, Janghorban M, Sheng K, Niu Y, Goldstein A, Zhao N, Bado I, Lo HC, Toneff MJ, et al. Immuno-subtyping of breast cancer reveals distinct myeloid cell profiles and immunotherapy resistance mechanisms. Nat Cell Biol. 2019; 21:1113–26. https://doi.org/10.1038/s41556-019-0373-7 [PubMed]
- 34. Bi N, Sun Y, Lei S, Zeng Z, Zhang Y, Sun C, Yu C. Identification of 40S ribosomal protein S8 as a novel biomarker for alcohol-associated hepatocellular carcinoma using weighted gene co-expression network analysis. Oncol Rep. 2020; 44:611–27. https://doi.org/10.3892/or.2020.7634 [PubMed]
- 35. Ruan WY, Zhang L, Lei S, Zeng ZR, Yang YS, Cao WP, Hao QY, Lu M, Tian XB, Peng PL. An inflammation-associated ferroptosis signature optimizes the diagnosis, prognosis evaluation and immunotherapy options in hepatocellular carcinoma. J Cell Mol Med. 2023; 27:1820–35. https://doi.org/10.1111/jcmm.17780 [PubMed]
- 36. Zeng Z, Lei S, Wang J, Yang Y, Lan J, Tian Q, Chen T, Hao X. A novel hypoxia-driven gene signature that can predict the prognosis of hepatocellular carcinoma. Bioengineered. 2022; 13:12193–210. https://doi.org/10.1080/21655979.2022.2073943 [PubMed]
- 37. Maeser D, Gruener RF, Huang RS. oncoPredict: an R package for predicting in vivo or cancer patient drug response and biomarkers from cell line screening data. Brief Bioinform. 2021; 22:bbab260. https://doi.org/10.1093/bib/bbab260 [PubMed]