


Introduction
Melanoma, a prevalent cutaneous malignancy, arises from melanocytes and exhibits a propensity for metastasis to diverse organs via lymphatic pathways [1, 2]. Heightened aggressiveness has been identified as a primary contributor to mortality in skin cancer cases [3, 4]. Middle-aged individuals are predisposed to melanoma, with males exhibiting a higher incidence than females [5, 6]. Recent years have witnessed an overall rise in melanoma incidence, with varying growth rates observed across different age cohorts [6]. Previously, the primary risk factor for the development of tumors was believed to be excessive exposure to ultraviolet rays [7]. Subsequent research has revealed that the presence of melanocytic nevi, family history, and genetic susceptibility are also significant risk factors [8]. Tumorigenesis is a multifactorial process involving the intricate interplay of various factors, including genes, epigenetics, and the environment [9]. The primary treatment approach for melanoma entails wide local excision, which may be complemented by chemotherapy and targeted therapy. Only a few areas that could not be operated on are treated with radiation therapy due to the radio resistance of melanoma [10].
The immune system assumes a pivotal role in the initiation of tumor formation [11]. During the early stages, melanoma impedes the elimination of cancer cells through two mechanisms of tumor immune evasion. Subsequently, in the advanced stages, cancer cells detach from the primary site via tumor invasion and metastasize to distant regions of the body [12, 13], thereby exacerbating the disease and influencing the prognosis. Tumor infiltrating lymphocytes serve as a crucial role in the immune system’s defense against tumor metastasis [14]. Melanoma exhibits a high frequency of genetic mutations [15, 16], resulting in the generation of neoantigens that trigger the host’s immune response against the tumor. These neoantigens can be utilized for diagnostic, therapeutic, and prognostic purposes [17]. Consequently, personalized care and treatment strategies can be tailored to enhance patients’ physical and psychological well-being and facilitate their recovery.
This study conducted an analysis of immune genes linked to melanoma, resulting in the identification of six genes that were utilized to develop a prognostic model aimed at personalized treatment and prognosis enhancement. The accuracy of this prognostic model was also verified. In addition, the analysis has also revealed that the immune system might regulate the prognosis of melanoma through ‘the regulation of lymphocyte activation’, ‘activation of T cell’, ‘cytotoxicity of NK cell’, and ‘differentiation of Th1 and Th2 cell’ pathways.
Materials and Methods
Data and patients
1793 genes associated with immunity were extracted from the Immunology Database and Analysis Portal (Immport, http://www.immport.org/home). The RNA-sequencing (RNA-seq) data of melanoma Fragments Per Kilobase Million (FPKM) in the Cancer Genome Atlas (TCGA) was obtained from the Xena database [18] and the amount of 455 melanoma patients with complete survival data was screened based on the relative information of patients.
Data analysis
According to patients’ gene expression level and survival information, we identified genes that were relevant to prognosis of melanoma from 1793 immune-related genes via Cox univariate analysis, and then we establish a model which could presage the patients’ prognosis of melanoma by combining the Least Absolute Shrinkage and Selection Operator (LASSO) analysis [19, 20] and Cox multivariate analysis (Supplementary Material 1).
Differential expression analysis
Depending on the prognostic model, risk scores were performed for the patients, and we divided 455 people with melanoma into high risk score (RS) and low RS groups stood on the median of risk scores. The analysis of differential expression was executed on the two groups through the “LIMMA” package [21], and enrichment analysis of differentially expressed genes was executed by the “Clusterprofiler” package [22, 23] (|logFC≥1, P<0.05|).
The miRNA data set of TCGA’s melanoma was downloaded from Xena database, and people with melanoma were split into two groups following the above groups. Differential expression analysis was performed to construct the ceRNA network according to the principle of the ceRNA hypothesis [24] and the miRWalk [25, 26] database (|logFC≥0.7, P<0.05|).
The gene mutation data set of TCGA’s melanoma was downloaded from Xena database, and samples were split into two groups by risk scores. The different of mutation between high RS group and low RS group was analyzed by the “maftools” package [27].
Immune infiltration and treatment
Estimation of Stromal and Immune cells in malignant tumor tissues using Expression data (ESTIMATE) is a biological information software. In the cancer microenvironment, immune cells and stromal cells are the main normal cells in tumor tissues, and ESTIMATE can use gene expression characteristics to speculate the contents of tumor cells and different infiltrations of normal cells [28].
The tumor microenvironment is closely related to the immunotherapy efficacy of tumor patients [29]. Researchers have classified the tumor microenvironment (TME) into four categories using 29 different functional gene sets: immune-enriched, non-fibrotic (IE); immune-enriched, fibrotic (IE/F); fibrotic (F); and immune-depleted (D) [30].
CIBERSORT (https://cibersort.stanford.edu/) is a method on the ground of linear support vector regression, which can describe the abundance of different cell subsets in complicated tissues from gene expression profiles [31].
Tumor Immune Dysfunction and Exclusion (TIDE) is the tool to estimate the potential of tumor immunologic escape from the gene expression profiles of cancer samples. The score of TIDE computed for each sample can predict response to immune checkpoint blockade as a biomarker.
Patients in the high RS group and the low RS group were evaluated by the ESTIMATE score, and their stromal cell immune cells and tumor purity were obtained in the light of their gene expression. And we explored the relationship between risk score and TME. Then the CIBERSORT analysis was fulfilled on the two groups to compare 22 kinds of immune cells’ infiltration. The analysis of TIDE was used to predict the efficacy of immunotherapy in the two groups. Statistical significance was examined using Students t -tests.
Validation
The GEO database GSE65904 and GSE19234 were chosen as validation data sets [13, 32]. Then people with melanoma were divided into two groups depended on the model of prognosis, and survival analysis and ROC test on the high RS group and the low RS group were performed to verify the effectiveness of the model.
Results
Establishment of prognostic model
Cox univariate regression analysis was availed to select genes corresponding to the prognosis of melanoma from 1793 immune-related genes, while Lasso regression analysis to further curtail the number of genes. And then, Cox multivariate regression analysis was used for analyzing the outcome of melanoma. Six genes closely associated with the prognosis of melanoma patients, including ADCYAP1R1, GPI, IFITM1, KIR2DL4, LIF and NTS, were elected to fabricate a prognosis model. The calculation equation of the risk score is as shown below: risk score= (-0.30899*KIR2DL4) + (-0.13892*IFITM1) + (0.28977*GPI) + (-0.16050*LIF) + (0.48867* ADCYAP1R1) + (0.11124*NTS). The consistency index (CI) of this model was 0.67 (Figure 1A). The survival curves of these six biomarkers were consistent with the positive and negative coefficients in the formula (Figure 1B–1G).
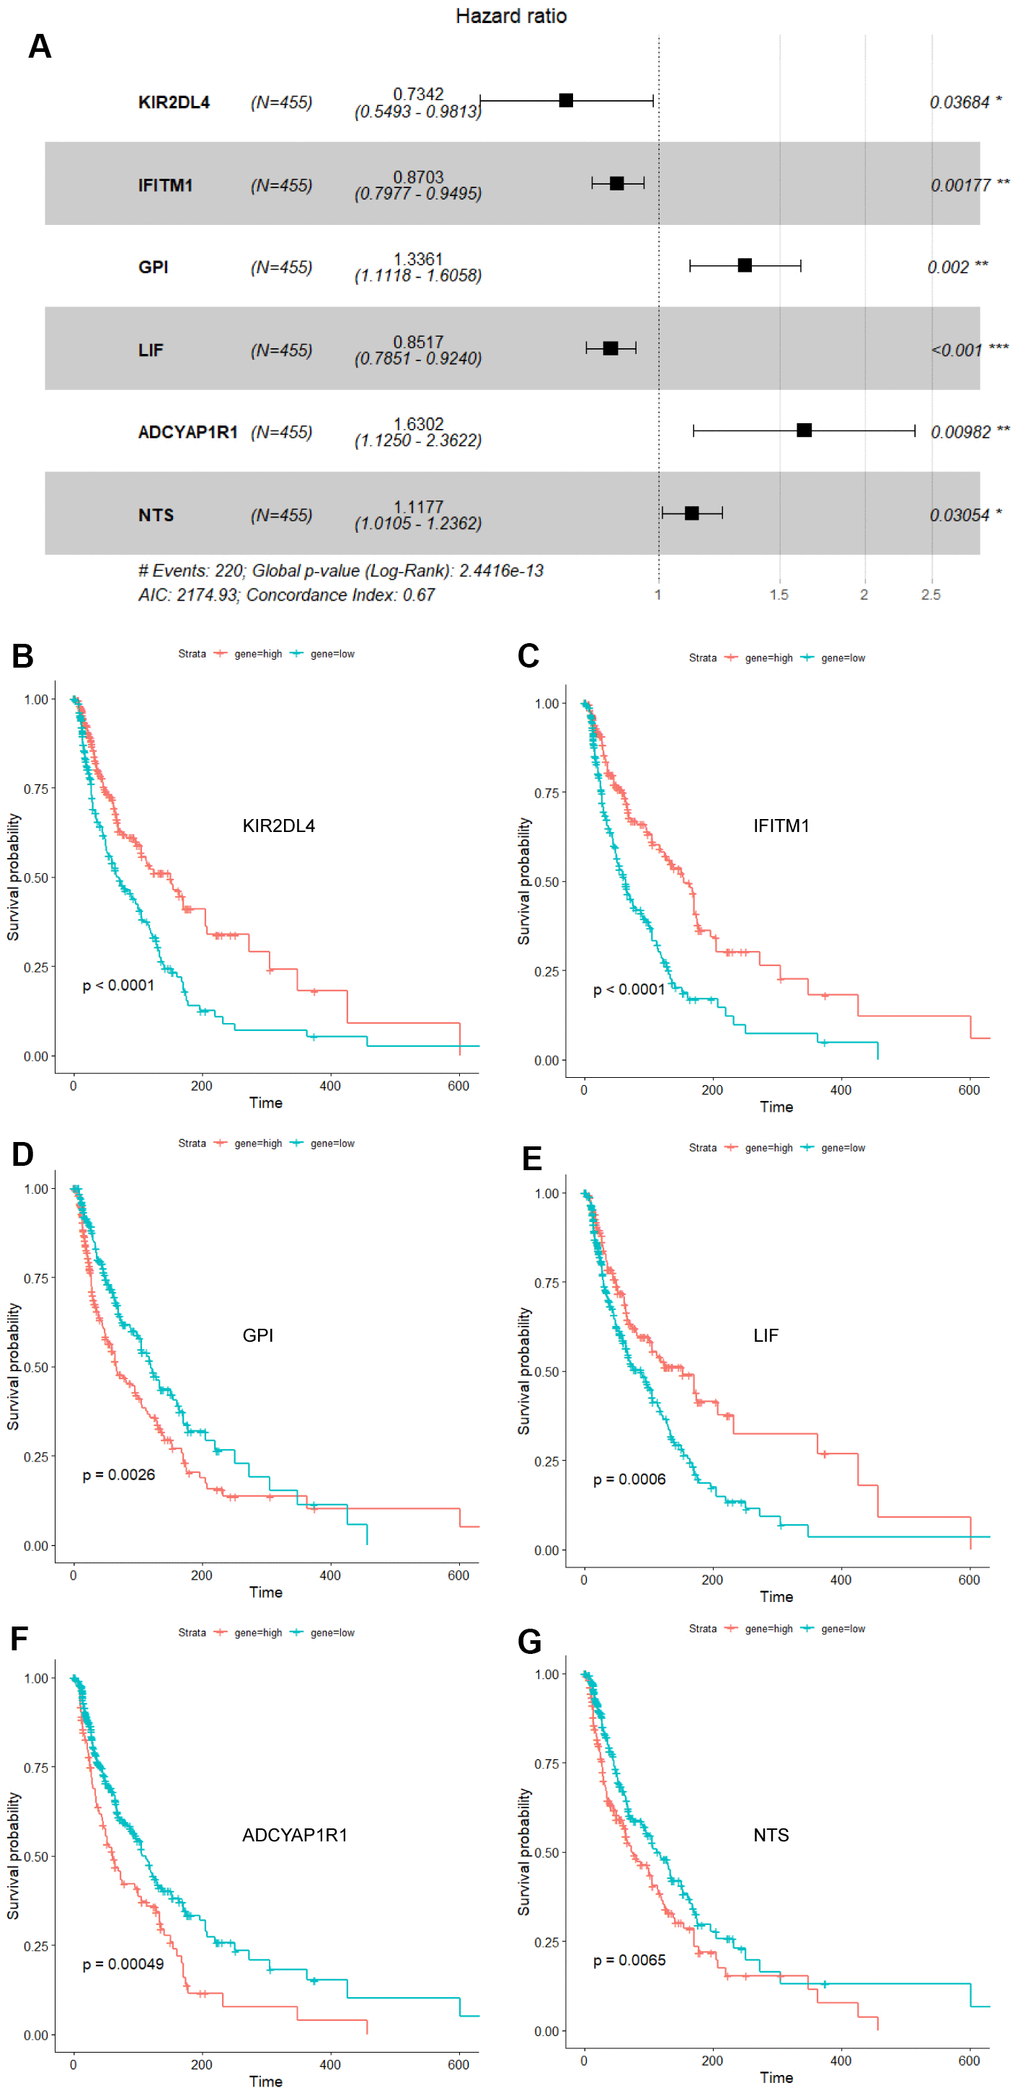
Figure 1. Forest plot and survival analysis of biomarkers. (A) The Cox proportional hazards model based on ADCYAP1R1, GPI, IFITM1, KIR2DL4, LIF and NTS. (B) Survival analysis of KIR2DL4 in melanoma (P<0.0001). (C) Survival analysis of IFITM1 in melanoma (P<0.0001). (D) Survival analysis of GPI in melanoma (P=0.0026). (E) Survival analysis of LIF in melanoma (P=0.0006). (F) Survival analysis of ADCYAP1R1 in melanoma (P=0.00049). (G) Survival analysis of NTS in melanoma (P=0.0065).
Risk score and ROC curve analysis
Each patient received their risk score based on the above model, while their survival situation was marked, and the expression of each gene in the model from patients was shown by a heat map (Figure 2A–2C). Obviously, ADCYAP1R1, GPI and NTS might lead to poor prognosis for melanoma patients, while IFITM1, KIR2DL4 and LIF are more likely to improve outcomes. At the same time, we also analyzed the effectiveness of the model by the ROC time-dependent curve, within the Area Under the Curve (AUC) of 12, 24 and 60 months scored of 0.69, 0.72 and 0.69, respectively (Figure 2D).
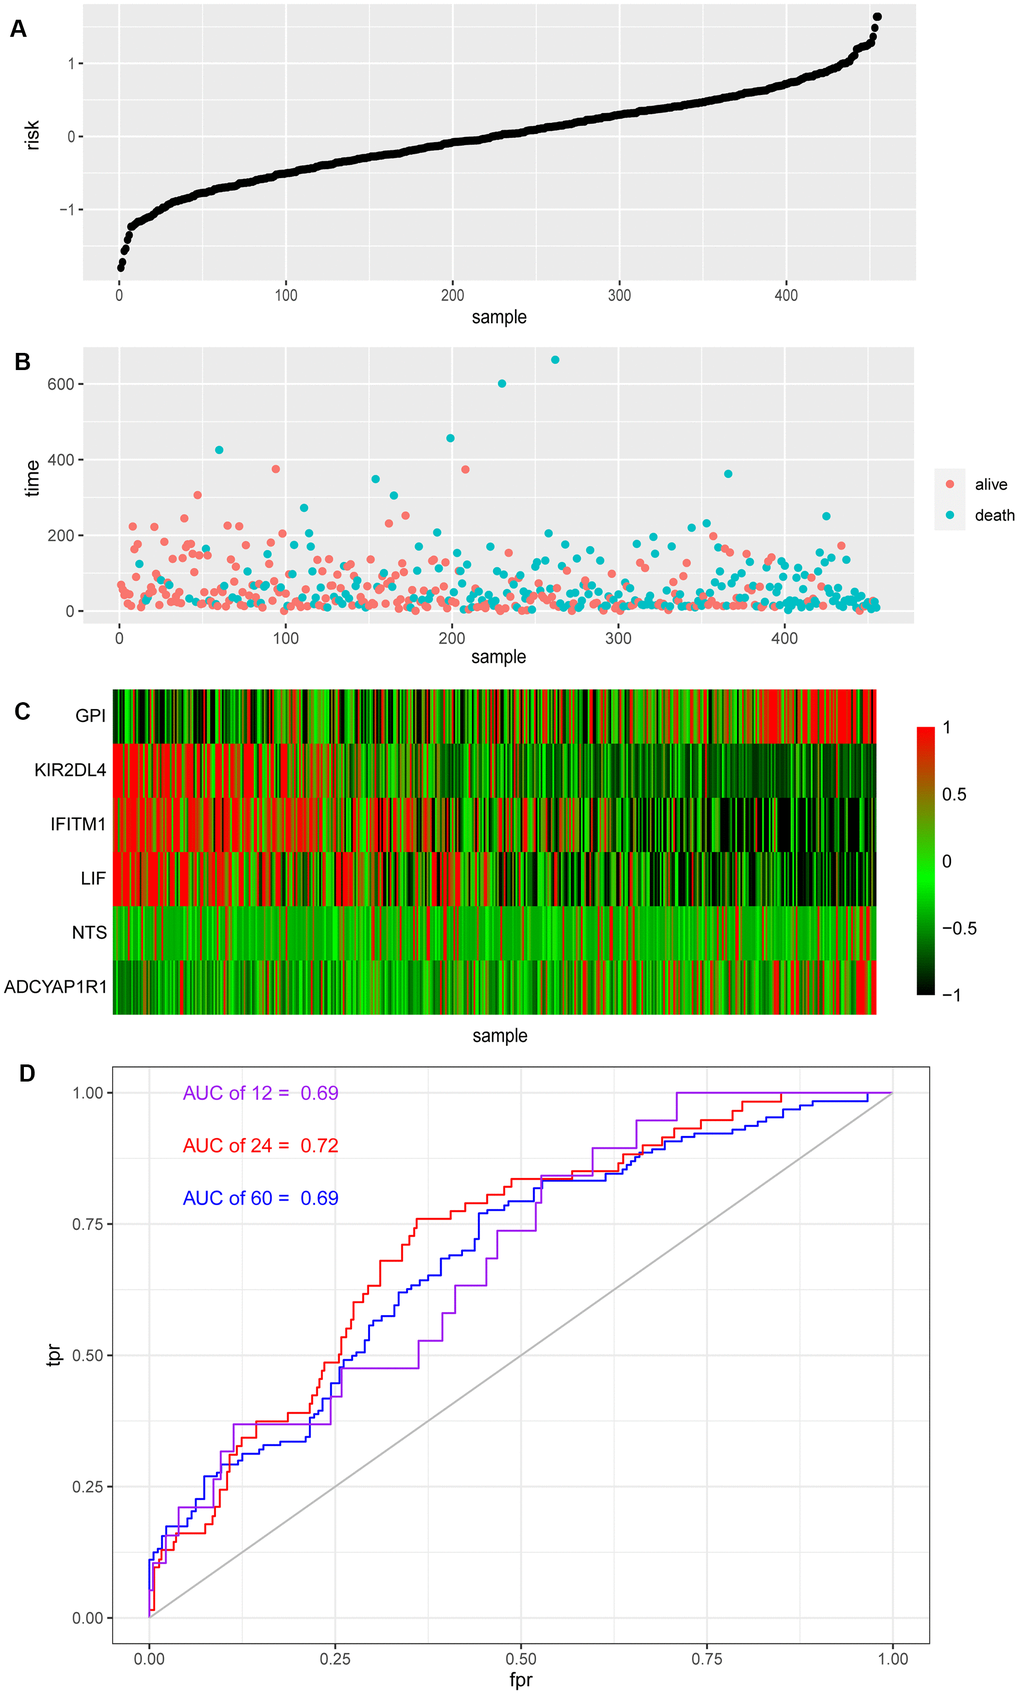
Figure 2. Risk score and ROC curve of melanoma. (A) Risk score of melanoma patients distributed in ascending order. (B) Survival time and status of melanoma patients in order of increasing risk score. The red dots represent the surviving patients and the blue dots represent dead. (C) The heatmap shows the expression of these six biomarkers in melanoma in order of increasing risk scores. (D) The ROC curve for 1, 2, 5-year survival prediction with AUC value.
Enrichment analysis
The risk score which each patient with melanoma received respectively was sorted from smallest to largest, and in consonance with the median, the patients were separated into two groups, a high RS group and a low RS group. 14 genes highly expressed in the high RS group and 249 genes in the low RS group were chalked up through analysis of gene differential expression (| log FC |≥1, P<0.05). Enrichment analysis of these genes have shown that the pathways are mainly enriched in ‘the regulation of lymphocyte activation’, ‘activation of T cell’, ‘cytotoxicity of NK cell’, and ‘differentiation of Th1 and Th2 cell’ pathways (Figure 3).
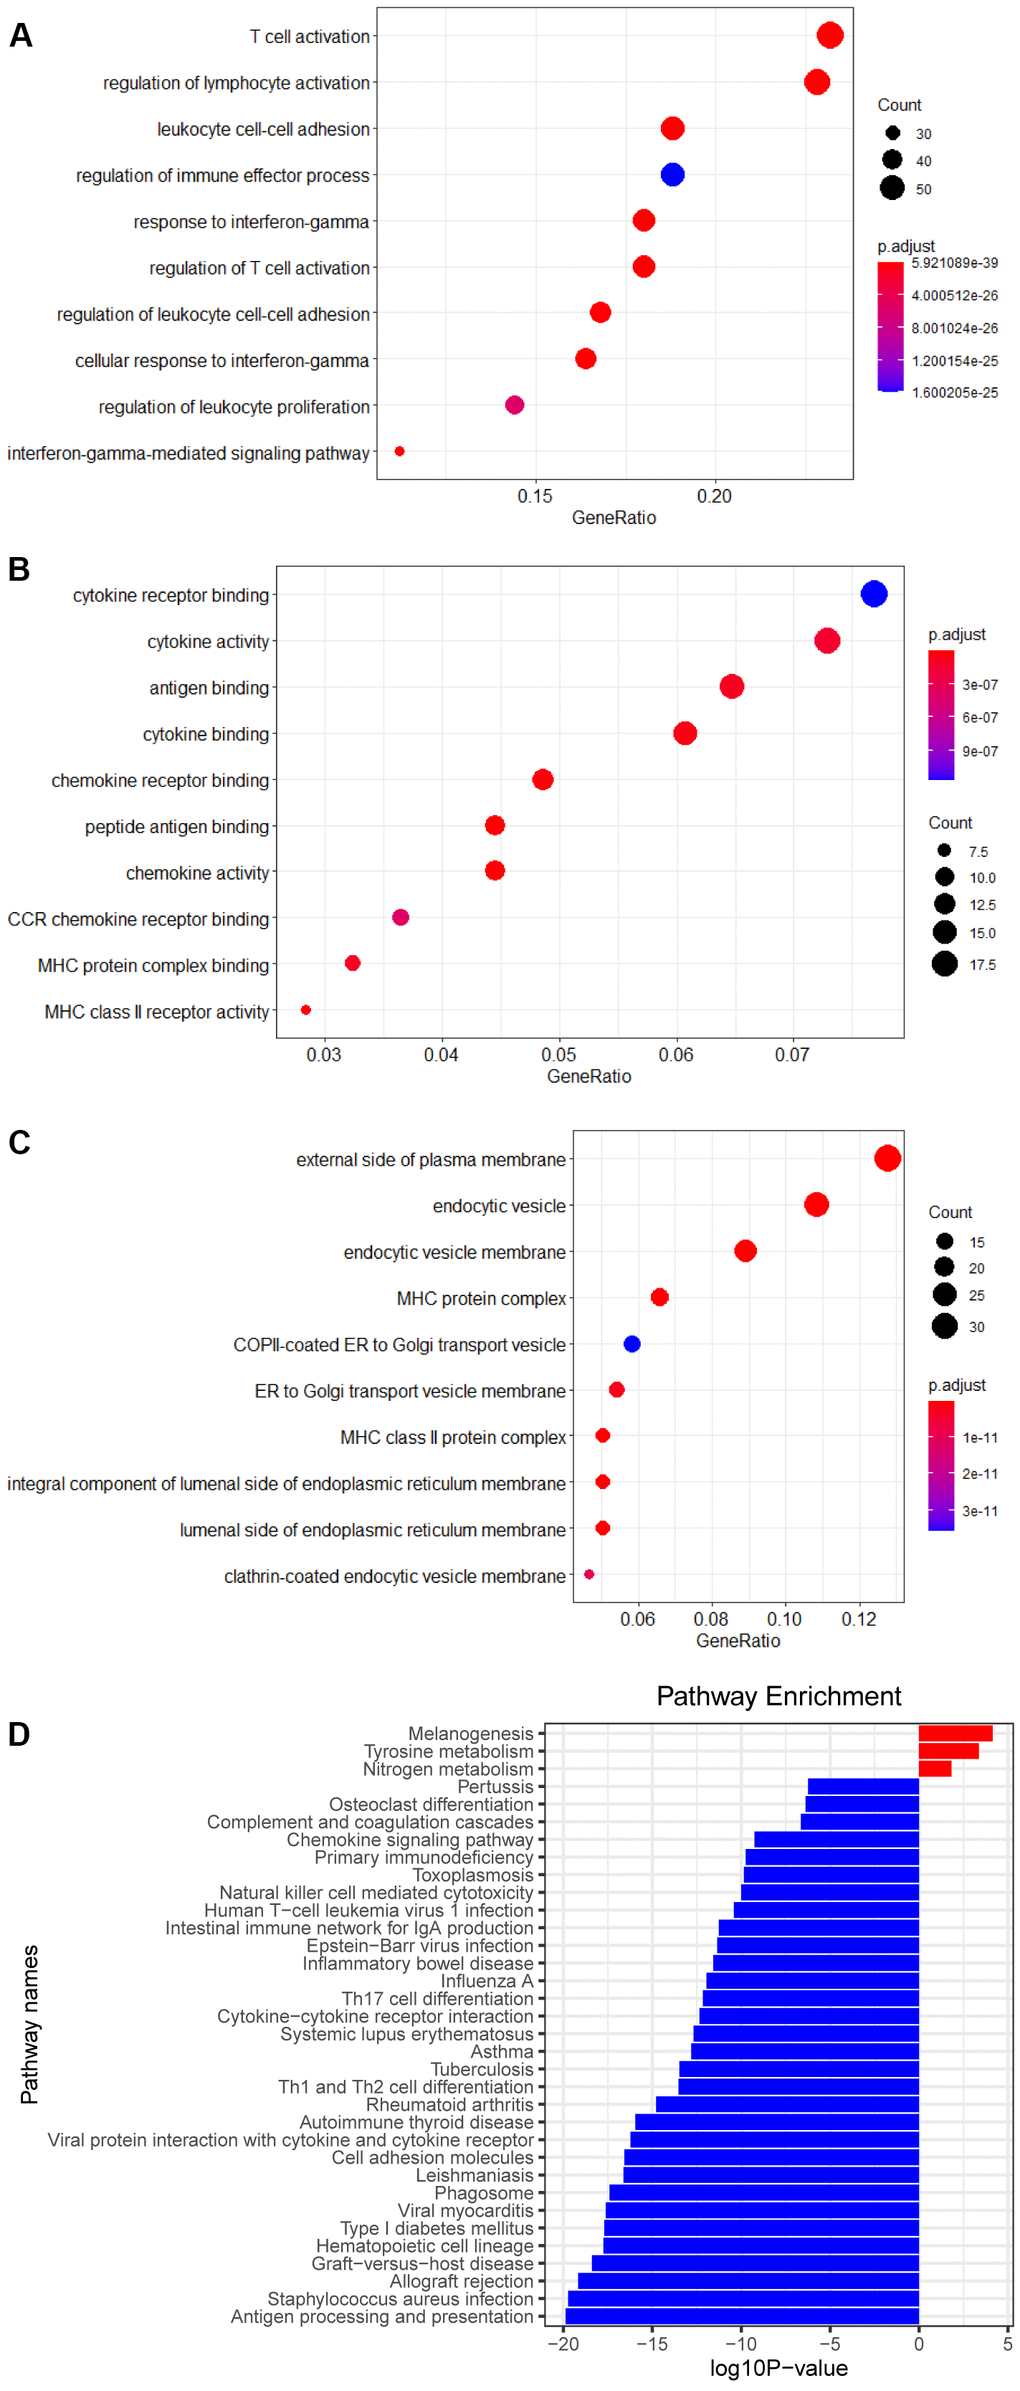
Figure 3. Enrichment analysis of DEGs. (A) Biological process of DEGs. (B) Molecular function of DEGs. (C) Cellular component of DEGs. (D) KEGG pathways of DEGs.
CeRNA network and somatic mutations
Hinged on the above risk score grouping, the samples from the miRNA dataset were diverged into the high RS and low RS group for differential expression analysis. 20 miRNAs strongly expressed in the high RS group and 18 miRNAs in the low RS group were screened by analysis of gene differential expression (| log FC |≥0.7, P<0.05) (Figure 4A, 4B). According to the theory of ceRNA hypothesis and miRWalk, targeted relationships between miRNAs with differential expression and these 6 biomarkers were found (Figure 4C).
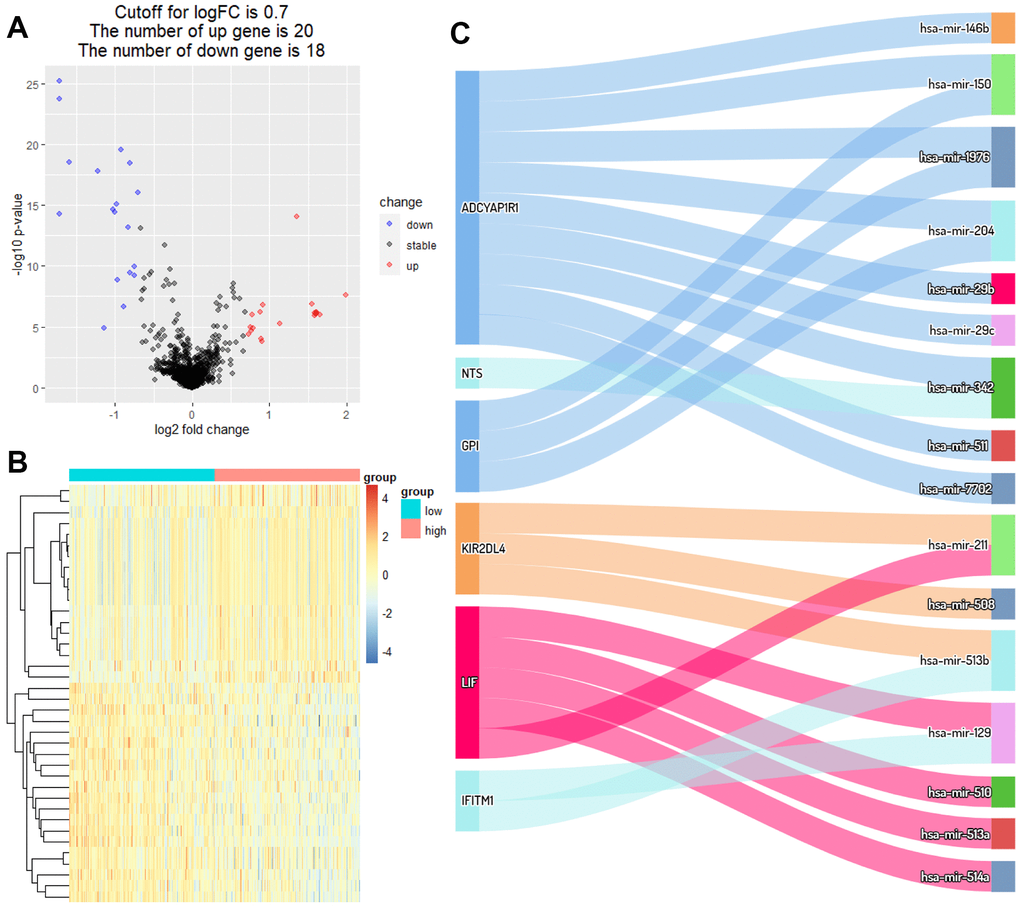
Figure 4. Identification of DEmiRNAs and ceRNA network. (A) Volcano plot of miRNAs between high RS and low RS groups. (B) Heatmap plot of miRNAs between high RS and low RS groups. (C) Differential expression of miRNAs-mRNAs network in melanoma.
In order to identify the difference of somatic mutations between the two sets, mutation data were envisaged by the “maftools” package in R software [27]. The Variant Allele Frequencies of top mutated genes from the high RS group were stronger than those in the low RS group, suggesting the low-risk patients have better prognosis (Figure 5A, 5B). And the forest plot showed specific mutant genes in two groups (Figure 5C).
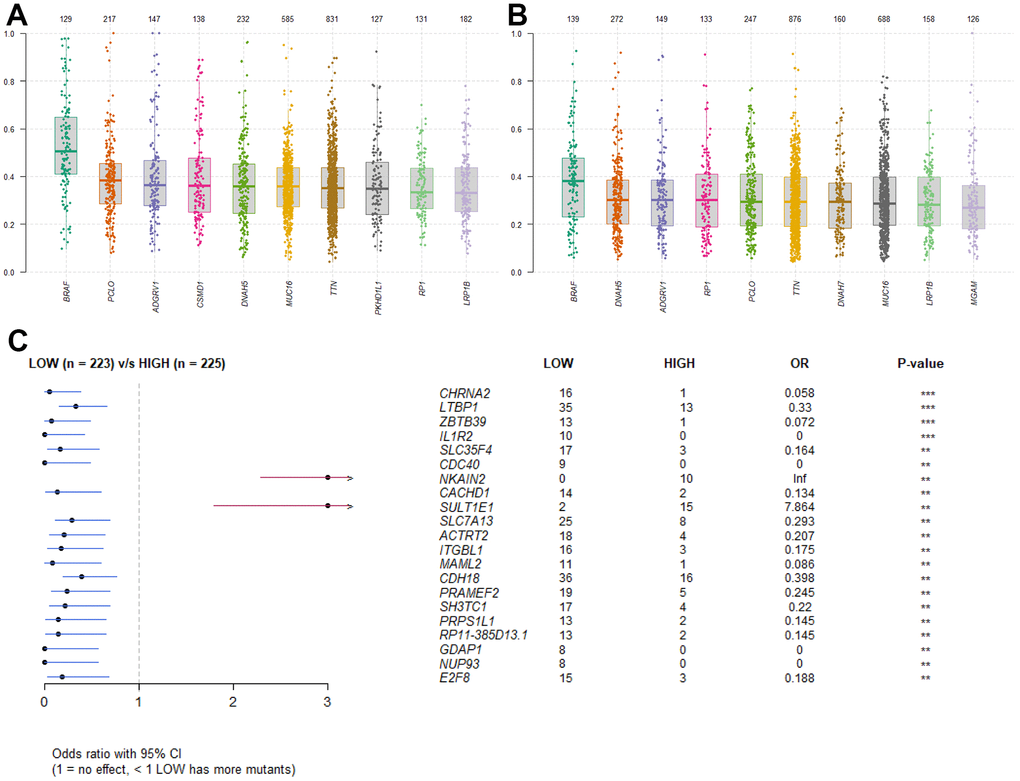
Figure 5. Somatic mutation analysis. (A) Boxplot of VAF in high RS group. (B) Boxplot of VAF in low RS group. (C) Forestplot of mutant genes in different groups.
Immune infiltration analysis
In the above two groups which were separated by ESTIMATE analysis, it was found that the low RS group might have a better Immune score, Stromal score and ESTIMATE score than the high RS group, while the tumor purity was the opposite (P <0.0001) (Figure 6A–6D), which demonstrated the reliability of our model and the strong correlation between the model and the patients’ immune infiltrate.
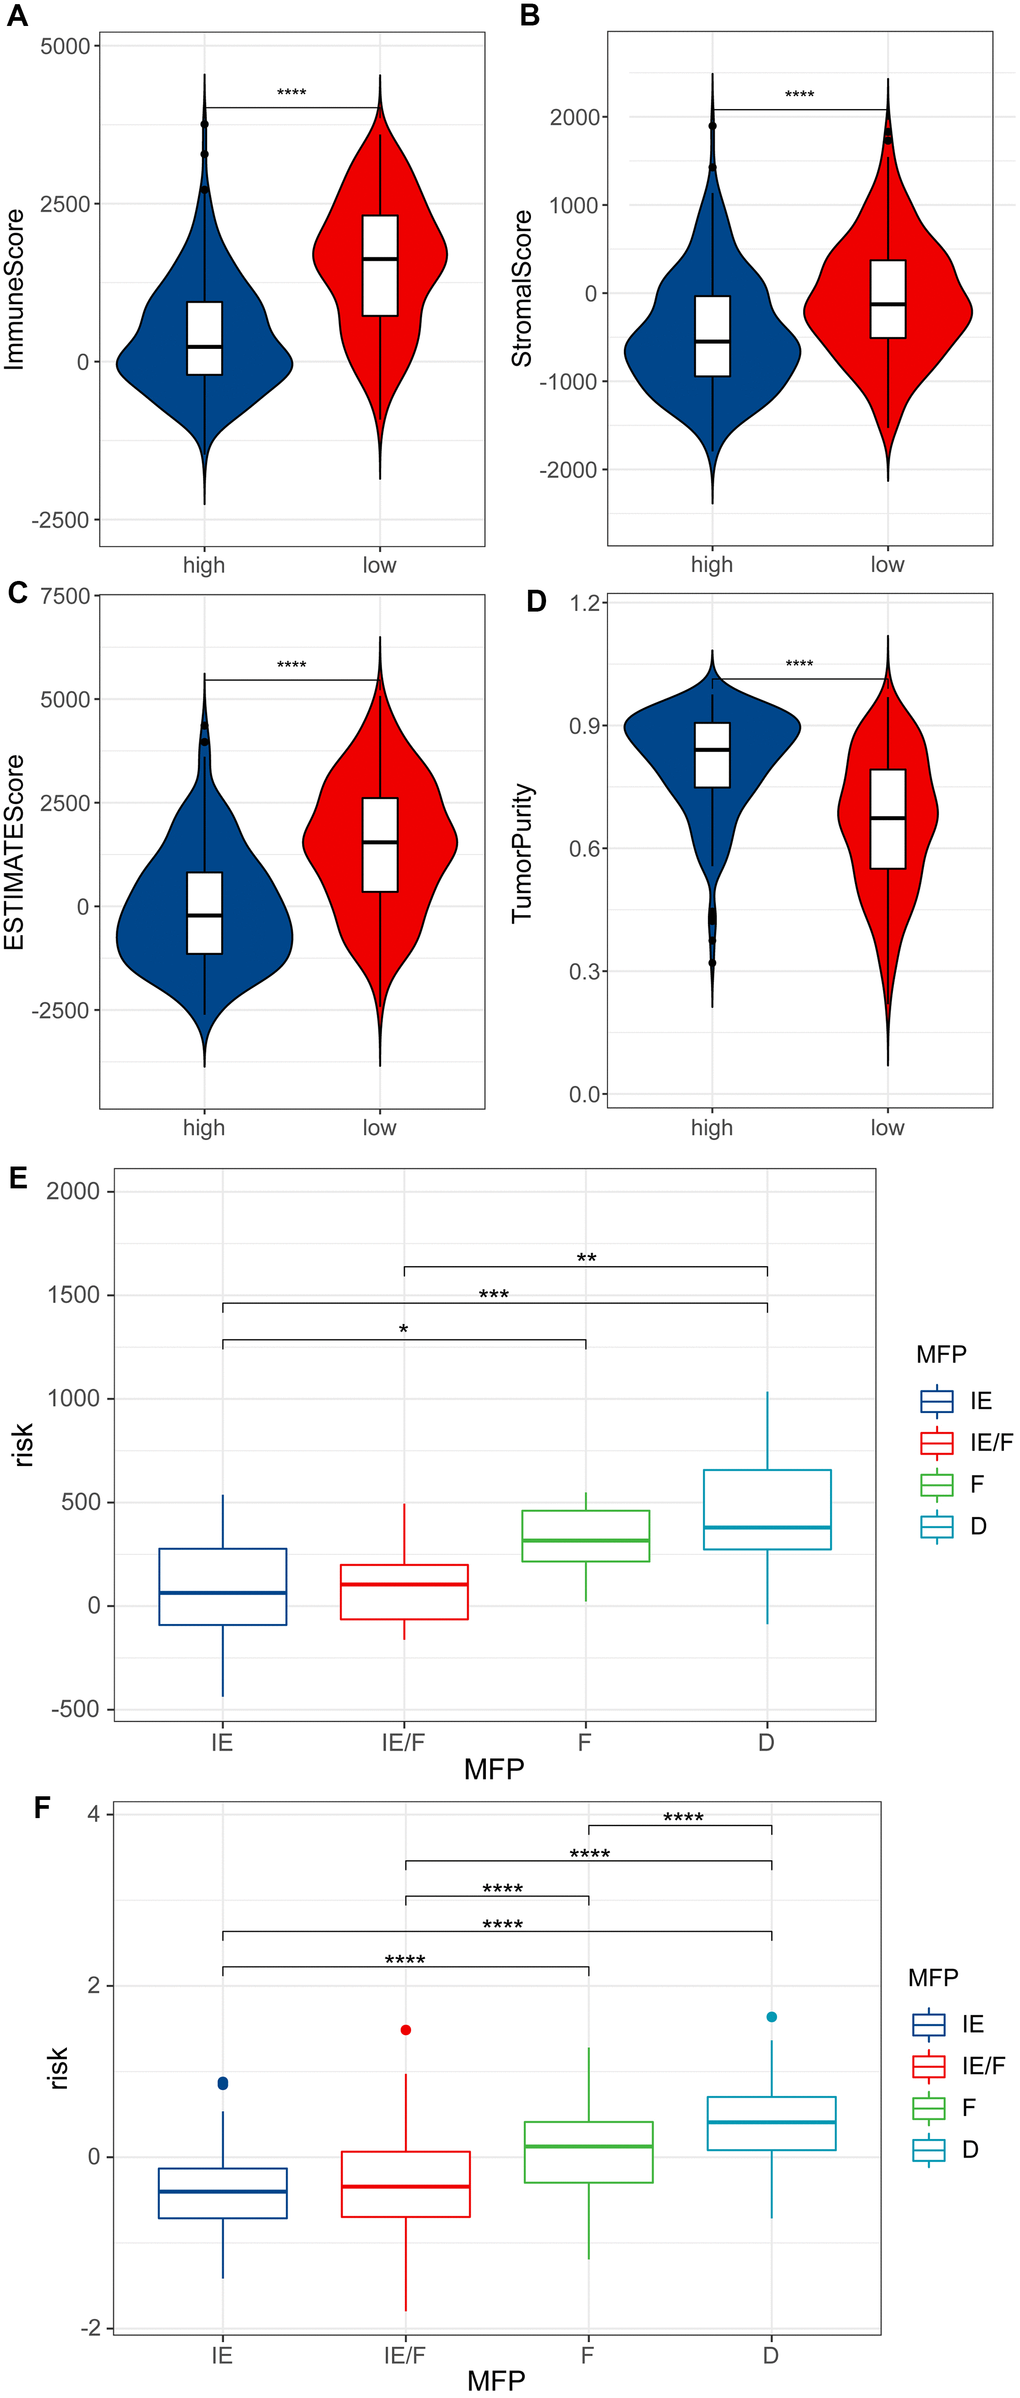
Figure 6. ESTIMATE analysis. (A) Immune score of high RS samples and low RS samples by ESTIMATE. (B) Stromal score of high RS samples and low RS samples by ESTIMATE. (C) ESTIMATE score of high RS samples and low RS samples by ESTIMATE. (D) Tumor purity of high RS samples and low RS samples by ESTIMATE. (E) Risk scores for four TME subtypes in samples of GSE22153. (F) Risk scores for four TME subtypes in melanoma samples of TCGA.
The TME can be divided into four subtypes: immune-enriched, non-fibrotic (IE); immune-enriched, fibrotic (IE/F); fibrotic (F); and immune-depleted (D). We calculated risk scores for melanoma patients in GSE22153 and TCGA using the prognostic model. It was found that IE and IE/F groups have lower risk scores compared to the F and D groups (Figure 6E, 6F).
cibersort analysis was performed for immune infiltration of patients from the high- and low RS group. We found that patients in the low RS group had high expression in plasma cells, T cell CD8+, T cell CD4+ memory activated, and NK cells activated, while Macrophages M0 and Macrophages M2 were strongly expressed in the high RS group (Figure 7A). Moreover, we also analyzed the correlation between the 6 biomarkers and immune cells, and found that KIR2DL4 was related to T cell CD8+, T cell CD4+ memory activated, and NK cells activated (Figure 7B).
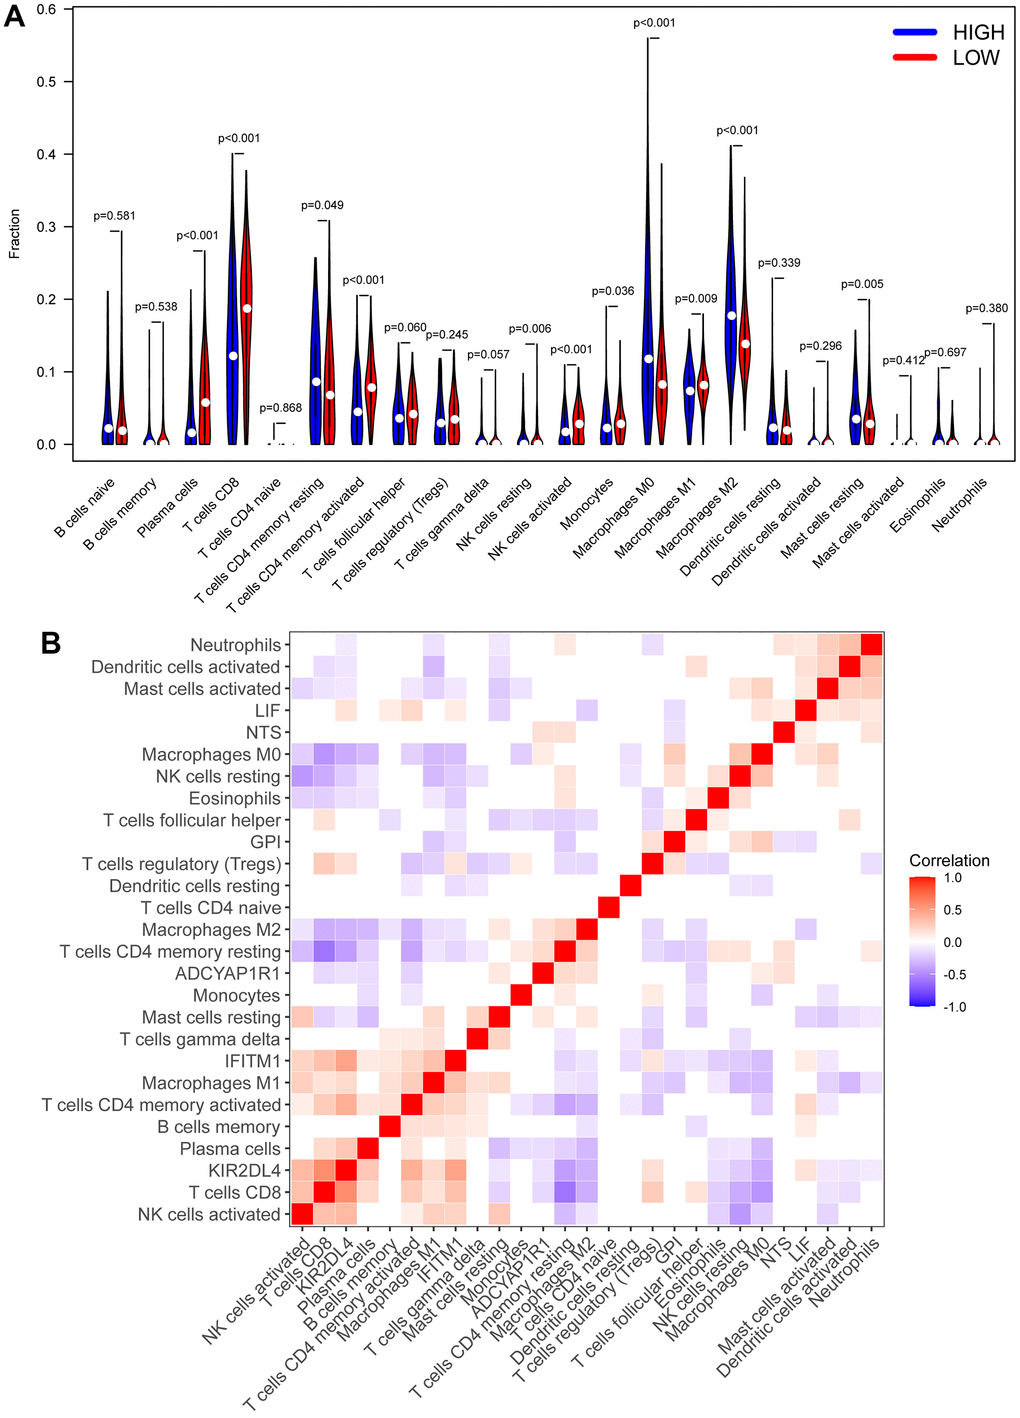
Figure 7. CIBERSORT analysis. (A) The heatmap of immune cell infiltration in high RS samples and low RS samples. Red represents low RS samples, and blue represents high-risk samples. (B) Correlation analysis between different immune cells and biomarkers.
According to the results of ESTIMATE, TME and CIBERSORT, the difference of prognosis between the above two groups might be closely associated with T cells. Thus, we used the TIDE to evaluate the therapeutic efficaciousness of immune checkpoint suppression in the two groups. The TIDE score of patients in the high RS group had a better score than those in low one (Figure 8A). The scores of the M2 subtype of tumor-associated macrophages (TAMs), myeloid-derived suppressor cells (MDSCs) and cancer-associated fibroblasts (CAFs) in the high RS group were higher than the low one (Figure 8B–8D). All results showed that the patients in low RS group had greater prognosis under immune checkpoint inhibition therapy.
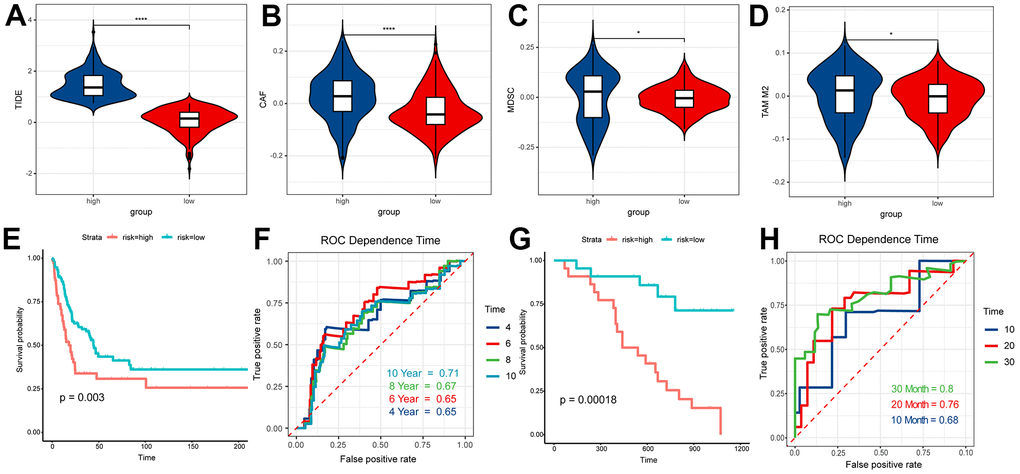
Figure 8. TIDE analysis and validation. (A) TIDE score of high RS samples and low RS samples. (B) CAF score of high RS samples and low RS samples. (C) MDSC score of high RS samples and low RS samples. (D) TAM M2 score of high RS samples and low RS samples. (E) Survival analysis of risk score in GSE65904. (F) The ROC curve for 4, 6, 8, 10-year survival prediction with AUC value. (G) Survival analysis of risk score in GSE19234. (H) The ROC curve for 10, 20, 30-month survival prediction with AUC value.
Experimental validation
In this study, samples of GSE65904 and GSE19234 were graded according to the prognostic model, and the scoring results were sorted from lowest to highest, and based on the median, the people participated in our research were split into two groups, the high RS group and the low RS group. The survival analysis of the two groups based on survival information suggested that people in the low RS group have significantly better outcomes than people in another group (P < 0.01) (Figure 8E, 8G). The ROC time-dependent curve was applied to verify the prognostic model and all AUCs were greater than or equal to 0.65 (Figure 8F, 8H). These results all validated the effectiveness of our model.
Discussion
Melanoma, as a highly malignant tumor derived from melanocytes, accounts for about 3% of all tumors, mainly occurring in the skin, and a few in the mucosa and viscera [33]. Among the most common malignant tumors, the incidence of cutaneous malignant melanoma is the third (6.8%~20%) [34], and during these years, the morbidity and mortality have been still increasing. Compared with other solid tumors, malignant melanoma makes the clinical prognosis worse, with a median survival time of about 6 months and a 1-year overall survival rate (OS) of 25% [35]. Immune checkpoint inhibitor (ICI) has been presented to significantly boost overall survival rate in persons with advanced-stage melanoma. Ipilimumab (the anti-CTLA-4 antibodies) and nivolumab (the anti-PD-1 antibodies) serve as the routine treatment for advanced melanoma nowadays [36]. In this study, six genes (ADCYAP1R1, GPI, IFITM1, KIR2DL4, LIF, and NTS) that exhibited strong correlation with the prognosis of melanoma patients were identified. These genes were utilized to develop a prognostic model that demonstrates reliable predictive value and accuracy. Additionally, the model has the capability to predict the prognosis of ICI therapy. Moreover, notable differences were observed in the infiltration of immune cells and activation of multiple signaling pathways between the two groups.
In this study, six genes (ADCYAP1R1, GPI, IFITM1, KIR2DL4, LIF, and NTS) were identified as being closely associated with prognosis among a pool of 1793 melanoma-related genes. This selection was achieved through the implementation of Cox univariate regression analysis, Lasso analysis, and Cox multivariate regression analysis, ultimately leading to the establishment of a prognostic model. Subsequently, individuals diagnosed with melanoma were categorized into either a high-risk score (RS) group or a low RS group based on this model, and its efficacy was subsequently validated. Our findings indicate that ADCYAP1R1, GPI, and NTS may contribute to a poor prognosis in melanoma patients, while IFITM1, KIR2DL4, and LIF are more likely to be associated with a better prognosis in individuals with melanoma. These genes have been manifested to be involved in the tumorigenesis in precedent studies. ADCYAP1R1 (ADCYAP Receptor Type I), a Protein Coding gene, involves in related pathways including synthesis and secretion of Aldosterone as well as Signaling mediated by G-protein coupled receptor (GPCR). GO annotations associated with this gene include activities of G protein-coupled receptor and trans membrane signaling receptor [37]. The key role of LGR4, a member of the GPCR family, has been demonstrated in tumor immunoregulation, and tumor immunotherapy strategies targeting LGR4 have been proposed and validated. Inhibition of Rspo-Lgr4 switches the polarization of macrophage in order to facilitate checkpoint blockade therapy [38]. GPI can encode the protein that is a member of the glucose phosphate isomerase protein family which has been determined as a moonlighting protein, because it is capable to execute distinct functions mechanistically [39]. The encoded protein, plays a role as a neurotrophic factor extracellularly, which can promote survival of skeletal motor and sensory neurons, and also as a lymphokine to induce secretion of immunoglobulin [40]. According to the auxiliary function of tumor-secreted cytokine and angiogenic factor, it is also as an autocrine motility factor [41]. Neuromedin N and neurotensin have a common precursor, which is encoded by NTS [42]. Neurotensin is a secreted tripeptide extensively distributed in the central nervous system and it may be involved in maintenance of intestinal structure and function, and regulation of fat metabolism [43]. Diseases associated with IFITM1 include Influenza and Dengue Virus [44]. Its related pathways are Interferon gamma signaling [45] and Innate Immune System [46]. GO annotations connected with this gene include obsolete signal transducer activity, downstream of receptor [47]. Killer cell immunoglobulin-like receptors (KIRs) are expressed by NK cells and subsets of T cells as transmembrane glycoproteins [48]. KIR proteins are deemed to play a part in regulation of the immune response because the ligands belonging to subsets of HLA class molecules [49]. Leukemia and Myeloid Leukemia are associated with LIF (Interleukin 6 Family Cytokine), which can code related protein [50]. Among its related pathways is Interleukin-6 family signaling [51]. Therefore, the above studies suggested the rationality and feasibility of the screened 6 genes in the prediction of melanoma incidence and prognosis.
The analysis of differential expression on the genes of patients in the two groups was completed, resulting in the identification of 14 genes highly expressed in the high RS group and 249 genes in the other group. The results of pathway enrichment analysis demonstrated that these genes were mainly associated with several pathways including lymphocyte activation regulation, activation of T cell, cytotoxicity of NK cell, and differentiation of Th1 and Th2 cell. In contrast to T cells, which exhibit specificity towards a singular aberrant molecule on cancerous cells and initiate a targeted assault, natural killer (NK) cells have demonstrated their versatility in the initial defense against cancer. NK cells not only serve as crucial effector cells in the innate immune response, but also function as regulators of diverse immune cell populations. Joy Hsu et al. [52] found that the level of PD-L1-positive NK cells was specifically connected with the outcome of patients with cancer after analyzing the NK cells in human and mice (tumor cells were PD-L1-negative). Under the action of immune checkpoint inhibitors, PD-L1-positive NK cells can not only eliminate tumor cells immediately, but also secrete cytokines to control tumor growth. Combined with NK cell activating factor on the basis of PD-L1 antibody can also significantly improve the therapeutic effect. Therefore, NK cells still have more potential to be explored in tumor therapy. Previous studies have shown that in tumor microenvironment (TME), immune infiltration is vital in tumor genesis and progression, and affects the clinical prognosis of tumor patients [53, 54]. In this study, we found that the melanoma prognostic model constructed using these 6 genes was highly correlated with the patient’s immune infiltration. To explore the correlation with circumstance on immune cell infiltration deeply, we continued to use CIBERSORT analysis to compare patients in the two groups, and found that different groups expressed different immune cell subtypes. People in the low RS group showed high expression in plasma cells, T cell CD8+, T cell CD4+ memory activated, and NK cells activated, while Macrophages M0 and Macrophages M2 were highly expressed in another group. Ali et al. [55, 56] have shown that the imbalance of the proportion of immune cell components has strongly correlation with poor outcome and low survival rate of patients with cancer. The past studies have covered that T cell CD8+ and NK cells perform a vital role in tumor immunity [57]. Furthermore, an examination was conducted to investigate the association between the aforementioned 6 biomarkers and immune cells. The results revealed a significant correlation between KIR2DL4 and T cell CD8+, T cell CD4+ memory activated, as well as NK cells activated. It is suggested that the abundant expression of T cell CD8+ and NK cells might reduce the risk elements related to melanoma and ameliorate the prognosis of sick people.
The ICI therapy is the main treatment in the current therapeutic method of melanoma which can significantly upgrade the overall survival rate of people with advanced melanoma [36]. CAFs, MDSCs and TAMs can restrict infiltration of T lymphocyte in tumors [58]. In the study, we found that the scores of CAFs, MDSCs and TAMs in the high RS group were better than those in another group, which means the people with high risk have higher T cell exclusion and lower infiltration of cytotoxic T lymphocytes. Although the ICI enhance the survival rate of skin melanoma patients, only some patients could be benefited from the ICI treatment [59]. Meanwhile, patients are also faced with heavy economic and psychological burden in the treatment process. The TIDE score could presage the response to ICI therapy [60]. A positive correlation is observed between lower TIDE scores and improved prognosis. Our study reveals that the low-risk group exhibits lower TIDE scores, indicating potential benefits from ICI therapy. Consequently, the model may serve as a valuable tool for determining the suitability of ICI treatment.
Our research inevitably presents opportunities for further improvement. Firstly, the study entails a bioinformatics analysis utilizing publicly available databases, thereby limiting the authenticity of the molecular mechanism analysis results due to the absence of in vivo or in vitro experiments. Secondly, the sample data obtained from the public database is subject to restrictions, potentially introducing random errors. Moreover, our study only provides some new potential research targets for the prognosis and treatment of melanoma. But the deeper molecular mechanism still needs to be further explored.
Conclusions
In our study, an effective prognostic model for melanoma was established. All bioinformatics results demonstrated the potential of the six key genes as prognostic markers of melanoma patients and the strong correlation of the model with immune infiltration. This study has provided more information for the pathogenesis and clinical treatment of melanoma.
Supplementary Materials
Author Contributions
Z. H. performed the bioinformatics analysis; Z. H. and M. C. prepared and wrote the manuscript; M. C. performed experiments, interpreted the associated results; Z. L. designed the experiments, supervised the research, revised and edited the manuscript. All authors contributed to the article and approved the submitted version.
Conflicts of Interest
The authors declare that they have no conflicts of interest.
Funding
No funding was provided for this study.
References
- 1. Islami F, Ward EM, Sung H, Cronin KA, Tangka FK, Sherman RL, Zhao J, Anderson RN, Henley SJ, Yabroff KR, Jemal A, Benard VB. Annual Report to the Nation on the Status of Cancer, Part 1: National Cancer Statistics. J Natl Cancer Inst. 2021; 113:1648–69. https://doi.org/10.1093/jnci/djab131 [PubMed]
- 2. Weiss SA, Wolchok JD, Sznol M. Immunotherapy of Melanoma: Facts and Hopes. Clin Cancer Res. 2019; 25:5191–201. https://doi.org/10.1158/1078-0432.CCR-18-1550 [PubMed]
- 3. Feigelson HS, Powers JD, Kumar M, Carroll NM, Pathy A, Ritzwoller DP. Melanoma incidence, recurrence, and mortality in an integrated healthcare system: A retrospective cohort study. Cancer Med. 2019; 8:4508–16. https://doi.org/10.1002/cam4.2252 [PubMed]
- 4. Siegel RL, Miller KD, Jemal A. Cancer statistics, 2019. CA Cancer J Clin. 2019; 69:7–34. https://doi.org/10.3322/caac.21551 [PubMed]
- 5. Rastrelli M, Tropea S, Rossi CR, Alaibac M. Melanoma: epidemiology, risk factors, pathogenesis, diagnosis and classification. In Vivo. 2014; 28:1005–11. [PubMed]
- 6. Guy GP
Jr , Thomas CC, Thompson T, Watson M, Massetti GM, Richardson LC, and Centers for Disease Control and Prevention (CDC). Vital signs: melanoma incidence and mortality trends and projections - United States, 1982-2030. MMWR Morb Mortal Wkly Rep. 2015; 64:591–6. [PubMed] - 7. Hawkes JE, Truong A, Meyer LJ. Genetic predisposition to melanoma. Semin Oncol. 2016; 43:591–7. https://doi.org/10.1053/j.seminoncol.2016.08.003 [PubMed]
- 8. Leonardi GC, Falzone L, Salemi R, Zanghì A, Spandidos DA, Mccubrey JA, Candido S, Libra M. Cutaneous melanoma: From pathogenesis to therapy (Review). Int J Oncol. 2018; 52:1071–80. https://doi.org/10.3892/ijo.2018.4287 [PubMed]
- 9. Davey MG, Miller N, McInerney NM. A Review of Epidemiology and Cancer Biology of Malignant Melanoma. Cureus. 2021; 13:e15087. https://doi.org/10.7759/cureus.15087 [PubMed]
- 10. Trappetti V, Fazzari JM, Fernandez-Palomo C, Scheidegger M, Volarevic V, Martin OA, Djonov VG. Microbeam Radiotherapy-A Novel Therapeutic Approach to Overcome Radioresistance and Enhance Anti-Tumour Response in Melanoma. Int J Mol Sci. 2021; 22:7755. https://doi.org/10.3390/ijms22147755 [PubMed]
- 11. Gajewski TF, Schreiber H, Fu YX. Innate and adaptive immune cells in the tumor microenvironment. Nat Immunol. 2013; 14:1014–22. https://doi.org/10.1038/ni.2703 [PubMed]
- 12. Lee N, Zakka LR, Mihm MC
Jr , Schatton T. Tumour-infiltrating lymphocytes in melanoma prognosis and cancer immunotherapy. Pathology. 2016; 48:177–87. https://doi.org/10.1016/j.pathol.2015.12.006 [PubMed] - 13. Cabrita R, Lauss M, Sanna A, Donia M, Skaarup Larsen M, Mitra S, Johansson I, Phung B, Harbst K, Vallon-Christersson J, van Schoiack A, Lövgren K, Warren S, et al. Tertiary lymphoid structures improve immunotherapy and survival in melanoma. Nature. 2020; 577:561–5. https://doi.org/10.1038/s41586-019-1914-8 [PubMed]
- 14. Borgers JSW, Haanen JB. Cellular Therapy and Cytokine Treatments for Melanoma. Hematol Oncol Clin North Am. 2021; 35:129–44. https://doi.org/10.1016/j.hoc.2020.08.014 [PubMed]
- 15. Nassar KW, Tan AC. The mutational landscape of mucosal melanoma. Semin Cancer Biol. 2020; 61:139–48. https://doi.org/10.1016/j.semcancer.2019.09.013 [PubMed]
- 16. Ribero S, Glass D, Bataille V. Genetic epidemiology of melanoma. Eur J Dermatol. 2016; 26:335–9. https://doi.org/10.1684/ejd.2016.2787 [PubMed]
- 17. Jiang J, Ding Y, Wu M, Chen Y, Lyu X, Lu J, Wang H, Teng L. Integrated genomic analysis identifies a genetic mutation model predicting response to immune checkpoint inhibitors in melanoma. Cancer Med. 2020; 9:8498–518. https://doi.org/10.1002/cam4.3481 [PubMed]
- 18. Goldman MJ, Craft B, Hastie M, Repečka K, McDade F, Kamath A, Banerjee A, Luo Y, Rogers D, Brooks AN, Zhu J, Haussler D. Visualizing and interpreting cancer genomics data via the Xena platform. Nat Biotechnol. 2020; 38:675–8. https://doi.org/10.1038/s41587-020-0546-8 [PubMed]
- 19. Vasquez MM, Hu C, Roe DJ, Halonen M, Guerra S. Measurement error correction in the least absolute shrinkage and selection operator model when validation data are available. Stat Methods Med Res. 2019; 28:670–80. https://doi.org/10.1177/0962280217734241 [PubMed]
- 20. Friedman J, Hastie T, Tibshirani R. Regularization Paths for Generalized Linear Models via Coordinate Descent. J Stat Softw. 2010; 33:1–22. https://doi.org/10.18637/jss.v033.i01 [PubMed]
- 21. Ritchie ME, Phipson B, Wu D, Hu Y, Law CW, Shi W, Smyth GK. limma powers differential expression analyses for RNA-sequencing and microarray studies. Nucleic Acids Res. 2015; 43:e47. https://doi.org/10.1093/nar/gkv007 [PubMed]
- 22. Yu G, Wang LG, Han Y, He QY. clusterProfiler: an R package for comparing biological themes among gene clusters. OMICS. 2012; 16:284–7. https://doi.org/10.1089/omi.2011.0118 [PubMed]
- 23. Fang K, Xu JX, Chen XX, Gao XR, Huang LL, Du AQ, Jiang C, Ge JF. Differential serum exosome microRNA profile in a stress-induced depression rat model. J Affect Disord. 2020; 274:144–58. https://doi.org/10.1016/j.jad.2020.05.017 [PubMed]
- 24. Tay Y, Rinn J, Pandolfi PP. The multilayered complexity of ceRNA crosstalk and competition. Nature. 2014; 505:344–52. https://doi.org/10.1038/nature12986 [PubMed]
- 25. Miao L, Yin RX, Zhang QH, Liao PJ, Wang Y, Nie RJ, Li H. A novel circRNA-miRNA-mRNA network identifies circ-YOD1 as a biomarker for coronary artery disease. Sci Rep. 2019; 9:18314. https://doi.org/10.1038/s41598-019-54603-2 [PubMed]
- 26. Dweep H, Sticht C, Pandey P, Gretz N. miRWalk--database: prediction of possible miRNA binding sites by “walking” the genes of three genomes. J Biomed Inform. 2011; 44:839–47. https://doi.org/10.1016/j.jbi.2011.05.002 [PubMed]
- 27. Mayakonda A, Lin DC, Assenov Y, Plass C, Koeffler HP. Maftools: efficient and comprehensive analysis of somatic variants in cancer. Genome Res. 2018; 28:1747–56. https://doi.org/10.1101/gr.239244.118 [PubMed]
- 28. Yoshihara K, Shahmoradgoli M, Martínez E, Vegesna R, Kim H, Torres-Garcia W, Treviño V, Shen H, Laird PW, Levine DA, Carter SL, Getz G, Stemke-Hale K, et al. Inferring tumour purity and stromal and immune cell admixture from expression data. Nat Commun. 2013; 4:2612. https://doi.org/10.1038/ncomms3612 [PubMed]
- 29. Wang Z, Liu Y, Mo Y, Zhang H, Dai Z, Zhang X, Ye W, Cao H, Liu Z, Cheng Q. The CXCL Family Contributes to Immunosuppressive Microenvironment in Gliomas and Assists in Gliomas Chemotherapy. Front Immunol. 2021; 12:731751. https://doi.org/10.3389/fimmu.2021.731751 [PubMed]
- 30. Bagaev A, Kotlov N, Nomie K, Svekolkin V, Gafurov A, Isaeva O, Osokin N, Kozlov I, Frenkel F, Gancharova O, Almog N, Tsiper M, Ataullakhanov R, Fowler N. Conserved pan-cancer microenvironment subtypes predict response to immunotherapy. Cancer Cell. 2021; 39:845–65.e7. https://doi.org/10.1016/j.ccell.2021.04.014 [PubMed]
- 31. Oh SC, Sohn BH, Cheong JH, Kim SB, Lee JE, Park KC, Lee SH, Park JL, Park YY, Lee HS, Jang HJ, Park ES, Kim SC, et al. Clinical and genomic landscape of gastric cancer with a mesenchymal phenotype. Nat Commun. 2018; 9:1777. https://doi.org/10.1038/s41467-018-04179-8 [PubMed]
- 32. Bogunovic D, O’Neill DW, Belitskaya-Levy I, Vacic V, Yu YL, Adams S, Darvishian F, Berman R, Shapiro R, Pavlick AC, Lonardi S, Zavadil J, Osman I, Bhardwaj N. Immune profile and mitotic index of metastatic melanoma lesions enhance clinical staging in predicting patient survival. Proc Natl Acad Sci USA. 2009; 106:20429–34. https://doi.org/10.1073/pnas.0905139106 [PubMed]
- 33. Dinnes J, Deeks JJ, Chuchu N, Ferrante di Ruffano L, Matin RN, Thomson DR, Wong KY, Aldridge RB, Abbott R, Fawzy M, Bayliss SE, Grainge MJ, Takwoingi Y, et al, and Cochrane Skin Cancer Diagnostic Test Accuracy Group. Dermoscopy, with and without visual inspection, for diagnosing melanoma in adults. Cochrane Database Syst Rev. 2018; 12:CD011902. https://doi.org/10.1002/14651858.CD011902.pub2 [PubMed]
- 34. Driscoll MS, Martires K, Bieber AK, Pomeranz MK, Grant-Kels JM, Stein JA. Pregnancy and melanoma. J Am Acad Dermatol. 2016; 75:669–78. https://doi.org/10.1016/j.jaad.2016.01.061 [PubMed]
- 35. Rosenberg SA, Lotze MT, Yang JC, Topalian SL, Chang AE, Schwartzentruber DJ, Aebersold P, Leitman S, Linehan WM, Seipp CA. Prospective randomized trial of high-dose interleukin-2 alone or in conjunction with lymphokine-activated killer cells for the treatment of patients with advanced cancer. J Natl Cancer Inst. 1993; 85:622–32. https://doi.org/10.1093/jnci/85.8.622 [PubMed]
- 36. Marconcini R, Spagnolo F, Stucci LS, Ribero S, Marra E, Rosa F, Picasso V, Di Guardo L, Cimminiello C, Cavalieri S, Orgiano L, Tanda E, Spano L, et al, and Italian Melanoma Intergroup (IMI). Current status and perspectives in immunotherapy for metastatic melanoma. Oncotarget. 2018; 9:12452–70. https://doi.org/10.18632/oncotarget.23746 [PubMed]
- 37. Kobayashi K, Shihoya W, Nishizawa T, Kadji FM, Aoki J, Inoue A, Nureki O. Cryo-EM structure of the human PAC1 receptor coupled to an engineered heterotrimeric G protein. Nat Struct Mol Biol. 2020; 27:274–80. https://doi.org/10.1038/s41594-020-0386-8 [PubMed]
- 38. Tan B, Shi X, Zhang J, Qin J, Zhang N, Ren H, Qian M, Siwko S, Carmon K, Liu Q, Han H, Du B, Liu M. Inhibition of Rspo-Lgr4 Facilitates Checkpoint Blockade Therapy by Switching Macrophage Polarization. Cancer Res. 2018; 78:4929–42. https://doi.org/10.1158/0008-5472.CAN-18-0152 [PubMed]
- 39. Kainulainen V, Loimaranta V, Pekkala A, Edelman S, Antikainen J, Kylväjä R, Laaksonen M, Laakkonen L, Finne J, Korhonen TK. Glutamine synthetase and glucose-6-phosphate isomerase are adhesive moonlighting proteins of Lactobacillus crispatus released by epithelial cathelicidin LL-37. J Bacteriol. 2012; 194:2509–19. https://doi.org/10.1128/JB.06704-11 [PubMed]
- 40. Mizrachi Y. Neurotrophic activity of monomeric glucophosphoisomerase was blocked by human immunodeficiency virus (HIV-1) and peptides from HIV-1 envelope glycoprotein. J Neurosci Res. 1989; 23:217–24. https://doi.org/10.1002/jnr.490230212 [PubMed]
- 41. Nakajima K, Raz A. Amplification of autocrine motility factor and its receptor in multiple myeloma and other musculoskeletal tumors. J Bone Oncol. 2020; 23:100308. https://doi.org/10.1016/j.jbo.2020.100308 [PubMed]
- 42. Tabarean IV. Neurotensin induces hypothermia by activating both neuronal neurotensin receptor 1 and astrocytic neurotensin receptor 2 in the median preoptic nucleus. Neuropharmacology. 2020; 171:108069. https://doi.org/10.1016/j.neuropharm.2020.108069 [PubMed]
- 43. Steele FF
3rd , Whitehouse SC, Aday JS, Prus AJ. Neurotensin NTS1 and NTS2 receptor agonists produce anxiolytic-like effects in the 22-kHz ultrasonic vocalization model in rats. Brain Res. 2017; 1658:31–5. https://doi.org/10.1016/j.brainres.2017.01.012 [PubMed] - 44. Brass AL, Huang IC, Benita Y, John SP, Krishnan MN, Feeley EM, Ryan BJ, Weyer JL, van der Weyden L, Fikrig E, Adams DJ, Xavier RJ, Farzan M, Elledge SJ. The IFITM proteins mediate cellular resistance to influenza A H1N1 virus, West Nile virus, and dengue virus. Cell. 2009; 139:1243–54. https://doi.org/10.1016/j.cell.2009.12.017 [PubMed]
- 45. Yang G, Xu Y, Chen X, Hu G. IFITM1 plays an essential role in the antiproliferative action of interferon-gamma. Oncogene. 2007; 26:594–603. https://doi.org/10.1038/sj.onc.1209807 [PubMed]
- 46. Prasad K, Khatoon F, Rashid S, Ali N, AlAsmari AF, Ahmed MZ, Alqahtani AS, Alqahtani MS, Kumar V. Targeting hub genes and pathways of innate immune response in COVID-19: A network biology perspective. Int J Biol Macromol. 2020; 163:1–8. https://doi.org/10.1016/j.ijbiomac.2020.06.228 [PubMed]
- 47. Vishnubalaji R, Shaath H, Elkord E, Alajez NM. Long non-coding RNA (lncRNA) transcriptional landscape in breast cancer identifies LINC01614 as non-favorable prognostic biomarker regulated by TGFβ and focal adhesion kinase (FAK) signaling. Cell Death Discov. 2019; 5:109. https://doi.org/10.1038/s41420-019-0190-6 [PubMed]
- 48. Lunemann S, Schöbel A, Kah J, Fittje P, Hölzemer A, Langeneckert AE, Hess LU, Poch T, Martrus G, Garcia-Beltran WF, Körner C, Ziegler AE, Richert L, et al. Interactions Between KIR3DS1 and HLA-F Activate Natural Killer Cells to Control HCV Replication in Cell Culture. Gastroenterology. 2018; 155:1366–71.e3. https://doi.org/10.1053/j.gastro.2018.07.019 [PubMed]
- 49. Pende D, Falco M, Vitale M, Cantoni C, Vitale C, Munari E, Bertaina A, Moretta F, Del Zotto G, Pietra G, Mingari MC, Locatelli F, Moretta L. Killer Ig-Like Receptors (KIRs): Their Role in NK Cell Modulation and Developments Leading to Their Clinical Exploitation. Front Immunol. 2019; 10:1179. https://doi.org/10.3389/fimmu.2019.01179 [PubMed]
- 50. Zhang C, Liu J, Wang J, Hu W, Feng Z. The emerging role of leukemia inhibitory factor in cancer and therapy. Pharmacol Ther. 2021; 221:107754. https://doi.org/10.1016/j.pharmthera.2020.107754 [PubMed]
- 51. Jones SA, Jenkins BJ. Recent insights into targeting the IL-6 cytokine family in inflammatory diseases and cancer. Nat Rev Immunol. 2018; 18:773–89. https://doi.org/10.1038/s41577-018-0066-7 [PubMed]
- 52. Dong W, Wu X, Ma S, Wang Y, Nalin AP, Zhu Z, Zhang J, Benson DM, He K, Caligiuri MA, Yu J. The Mechanism of Anti-PD-L1 Antibody Efficacy against PD-L1-Negative Tumors Identifies NK Cells Expressing PD-L1 as a Cytolytic Effector. Cancer Discov. 2019; 9:1422–37. https://doi.org/10.1158/2159-8290.CD-18-1259 [PubMed]
- 53. Zhang H, Zhang N, Dai Z, Wang Z, Zhang X, Liang X, Zhang L, Feng S, Wu W, Ye W, Zhang J, Luo P, Liu Z, et al. Hyaluronic acids mediate the infiltration, migration, and M2 polarization of macrophages: evaluating metabolic molecular phenotypes in gliomas. Mol Oncol. 2022; 16:3927–48. https://doi.org/10.1002/1878-0261.13315 [PubMed]
- 54. Zhang H, Wang Y, Zhao Y, Liu T, Wang Z, Zhang N, Dai Z, Wu W, Cao H, Feng S, Zhang L, Cheng Q, Liu Z. PTX3 mediates the infiltration, migration, and inflammation-resolving-polarization of macrophages in glioblastoma. CNS Neurosci Ther. 2022; 28:1748–66. https://doi.org/10.1111/cns.13913 [PubMed]
- 55. Ali HR, Chlon L, Pharoah PD, Markowetz F, Caldas C. Patterns of Immune Infiltration in Breast Cancer and Their Clinical Implications: A Gene-Expression-Based Retrospective Study. PLoS Med. 2016; 13:e1002194. https://doi.org/10.1371/journal.pmed.1002194 [PubMed]
- 56. Bense RD, Sotiriou C, Piccart-Gebhart MJ, Haanen JB, van Vugt MA, de Vries EG, Schröder CP, Fehrmann RS. Relevance of Tumor-Infiltrating Immune Cell Composition and Functionality for Disease Outcome in Breast Cancer. J Natl Cancer Inst. 2016; 109:djw192. https://doi.org/10.1093/jnci/djw192 [PubMed]
- 57. André P, Denis C, Soulas C, Bourbon-Caillet C, Lopez J, Arnoux T, Bléry M, Bonnafous C, Gauthier L, Morel A, Rossi B, Remark R, Breso V, et al. Anti-NKG2A mAb Is a Checkpoint Inhibitor that Promotes Anti-tumor Immunity by Unleashing Both T and NK Cells. Cell. 2018; 175:1731–43.e13. https://doi.org/10.1016/j.cell.2018.10.014 [PubMed]
- 58. Joyce JA, Fearon DT. T cell exclusion, immune privilege, and the tumor microenvironment. Science. 2015; 348:74–80. https://doi.org/10.1126/science.aaa6204 [PubMed]
- 59. Queirolo P, Boutros A, Tanda E, Spagnolo F, Quaglino P. Immune-checkpoint inhibitors for the treatment of metastatic melanoma: a model of cancer immunotherapy. Semin Cancer Biol. 2019; 59:290–7. https://doi.org/10.1016/j.semcancer.2019.08.001 [PubMed]
- 60. Jiang P, Gu S, Pan D, Fu J, Sahu A, Hu X, Li Z, Traugh N, Bu X, Li B, Liu J, Freeman GJ, Brown MA, et al. Signatures of T cell dysfunction and exclusion predict cancer immunotherapy response. Nat Med. 2018; 24:1550–8. https://doi.org/10.1038/s41591-018-0136-1 [PubMed]