


Introduction
Emerging evidence suggests significant variability in the health status of older individuals, with people of the same age differing greatly in their vulnerability to adverse outcomes [1]. This variability is often referred to as frailty [2]. Geriatricians define frailty as a biological syndrome of decreased reserve and resistance to stressors, resulting from cumulative declines across multiple physiological systems, causing vulnerability to adverse outcomes [3]. Frailty is associated with an increased risk of adverse health consequences, including falls [4], hospitalization [5, 6], and death [2, 7–9].
Based on the cumulative deficit model of Rockwood and Mitnitski [10, 11], an Electronic Frailty Index (EFI) has been developed and validated, allowing the classification of patients according to their level of frailty [12]. Today, the EFI is routinely adopted within all UK primary care settings [13, 14]. Since the operative definitions of such an index are specific to each country [15, 16], versions of the EFI have been developed in various countries, including the US [8, 17], Canada [18], Australia [19], China [20], Japan [21], Sweden [22, 23], and other parts of the United Kingdom such as Wales [24] and Scotland [25].
Frailty is not static; it is a dynamic health state that changes over time, even within a relatively short 12 months follow-up period [26]. It usually worsens but may also improve [2]. Despite the importance of the dynamic nature of frailty and its association with increased disability in terms of ADL [27], increased use of health care services [28], and all-cause mortality [29], studies on predictors of frailty worsening over time are sparse in the general geriatric literature [30, 31]. A meta-analysis by Kojima et al. showed pooled rates of frailty transition patterns among community-dwelling older people from 16 cohorts [32]. They found an association between older age and frailty worsening [33–35], and that women were more likely to change frailty status, either improving or worsening, rather than staying the same. Greater frailty at baseline increased the likelihood of worsening at follow-ups [36]. Multimorbidity was associated with frailty worsening among non-frail participants [31, 33], as well as polypharmacy [37, 38] and lower self-rated health [36, 39]. Physical inactivity [40], mobility impairment [39], and slow gait speed [26, 41] were also associated with frailty worsening. Social predictors such as fewer social interactions, living alone [42, 43], low education [31, 35, 44, 40], difficulty meeting living expenses [39], and being part of a minority [45] were also identified as predictors of frailty worsening. Other predictors of frailty worsening included psychological predictors such as depressed mood [46], sensory variables such as visual and hearing impairment [39], decreased cognitive activities [47], and cognitive impairment [37, 39].
Recently, our team developed an EFI according to our needs as an HMO, called MEFI (Meuhedet Electronic Frailty Index). MEFI contains 36 deficits, based on Clegg’s items [12] and Orkaby’s items [8]. MEFI was validated and has been proven to predict hospitalization and mortality [6], and was used to measure frailty and frailty worsening in this study.
It was found that an index based on the cumulative deficit model, such as the MEFI, better captures the multidimensional and dynamic nature of frailty over time [40], is considered a more accurate predictor of mortality [7], and is more sensitive to modifications in underlying health than the phenotype model [48]. A look at the predictors of frailty worsening, such as multimorbidity, activity limitation, or sensory impairment, reveals that they are all represented by one or more specific deficits included in MEFI (see Table 1). Using MEFI deficits to define predictors of frailty worsening is advantageous since they are routinely collected anyway, and the definition of the deficits is quite agreed upon beyond the various EFI in use in the literature. Unfortunately, no studies on predictors of frailty worsening, in terms of EFI deficits, could be found.
Table 1. List of 36 deficits included in the MEFI.
| Deficits |
| Activity Limitation |
| Anaemia and Haematinic Deficiency |
| Anxiety |
| Arthritis |
| Atrial Fibrillation |
| Cancer (any except basal cell skin cancer) |
| Cerebrovascular Disease |
| Chronic Kidney Disease |
| Coronary Artery Disease |
| Dementias |
| Depression |
| Diabetes |
| Dizziness/Vertigo |
| Fall/fall-related injuries (hip/skull fractures, subdural hematoma) |
| Fatigue |
| Gait Abnormality |
| Gastro-intestinal Disease |
| Hearing Impairment |
| Heart Failure |
| Housebound |
| Hypertension |
| Lung Disease |
| Memory and Cognitive Problems |
| Muscular Wasting |
| Osteoporosis |
| Parkinson’s Disease |
| Peripheral Neuropathy |
| Peripheral Vascular Disease |
| Polypharmacy |
| Requires Care |
| Sleep Disturbance |
| Social Vulnerability |
| Thyroid Disease |
| Urinary Incontinence |
| Vision Comorbidity |
| Weight Loss in the past year |
The objectives of this study are (1) to describe the dynamic trajectory of frailty, (2) to identify the characteristics of those who deteriorate first, and (3) to identify which deficits deteriorate first in each frailty level. A better understanding of frailty worsening among community-dwelling older adults will help define early warning indicators of who will worsen first and determine preventive measures focused on what will worsen first.
Results
Participants
The cohort included all 119,952 patients of the Meuhedet HMO aged 65 and over, 54.4% of whom were females (See Table 2). The largest age group was those aged 65–74, with a mean age of 73.8 (SD = 7.0), a median of 72, a range from 65 to 106, and an interquartile range of 68 to 78. More than half belonged to the middle social level, and 8.3% belonged to the Arabic sector. Regarding frailty levels, 37.4% were fit, 40.3% were mildly frail, 16.8% were moderately frail, and 5.5% were severely frail. Regarding other aspects of their medical condition, 16.7% were hospitalized at least once the year before follow-up, 7.4% had a CCI score higher than 5, and 70% were overweight or obese.
Table 2. Baseline characteristics, worsening rates and crude OR.
| N = 119,952 | Distribution at BL | Pct. worsened | |||||||||||||||||||||||||||||||||||||||||||||||||||||||||||||||||||||||||||||||||||||||||||||||||
| All | 100% N = 119,952 | within each sub-group** | |||||||||||||||||||||||||||||||||||||||||||||||||||||||||||||||||||||||||||||||||||||||||||||||||
| Sex | |||||||||||||||||||||||||||||||||||||||||||||||||||||||||||||||||||||||||||||||||||||||||||||||||||
| Male | 45.6% | 13.1%* | |||||||||||||||||||||||||||||||||||||||||||||||||||||||||||||||||||||||||||||||||||||||||||||||||
| Female | 54.4% | 13.5% | |||||||||||||||||||||||||||||||||||||||||||||||||||||||||||||||||||||||||||||||||||||||||||||||||
| Age groups | |||||||||||||||||||||||||||||||||||||||||||||||||||||||||||||||||||||||||||||||||||||||||||||||||||
| 65–74 years | 60.8% | 10.0% | |||||||||||||||||||||||||||||||||||||||||||||||||||||||||||||||||||||||||||||||||||||||||||||||||
| 75–84 years | 29.8% | 16.2% | |||||||||||||||||||||||||||||||||||||||||||||||||||||||||||||||||||||||||||||||||||||||||||||||||
| 85+ years | 9.3% | 25.6% | |||||||||||||||||||||||||||||||||||||||||||||||||||||||||||||||||||||||||||||||||||||||||||||||||
| SES groups | |||||||||||||||||||||||||||||||||||||||||||||||||||||||||||||||||||||||||||||||||||||||||||||||||||
| Low | 25.3% | 14.5% | |||||||||||||||||||||||||||||||||||||||||||||||||||||||||||||||||||||||||||||||||||||||||||||||||
| Intermediate | 54.1% | 13.3% | |||||||||||||||||||||||||||||||||||||||||||||||||||||||||||||||||||||||||||||||||||||||||||||||||
| High | 20.6% | 11.6% | |||||||||||||||||||||||||||||||||||||||||||||||||||||||||||||||||||||||||||||||||||||||||||||||||
| Sector | |||||||||||||||||||||||||||||||||||||||||||||||||||||||||||||||||||||||||||||||||||||||||||||||||||
| Jewish secular | 77.4% | 13.2% | |||||||||||||||||||||||||||||||||||||||||||||||||||||||||||||||||||||||||||||||||||||||||||||||||
| Jewish orthodox | 14.2% | 12.5% | |||||||||||||||||||||||||||||||||||||||||||||||||||||||||||||||||||||||||||||||||||||||||||||||||
| Arabic | 8.3% | 15.9% | |||||||||||||||||||||||||||||||||||||||||||||||||||||||||||||||||||||||||||||||||||||||||||||||||
| MEFI 2023 | |||||||||||||||||||||||||||||||||||||||||||||||||||||||||||||||||||||||||||||||||||||||||||||||||||
| Fit | 37.4% | 11.9% | |||||||||||||||||||||||||||||||||||||||||||||||||||||||||||||||||||||||||||||||||||||||||||||||||
| Mild frailty | 40.3% | 13.3% | |||||||||||||||||||||||||||||||||||||||||||||||||||||||||||||||||||||||||||||||||||||||||||||||||
| Moderate frailty | 16.8% | 18.0% | |||||||||||||||||||||||||||||||||||||||||||||||||||||||||||||||||||||||||||||||||||||||||||||||||
| Severe frailty | 5.5% | 8.9% | |||||||||||||||||||||||||||||||||||||||||||||||||||||||||||||||||||||||||||||||||||||||||||||||||
| Hosp. year before | |||||||||||||||||||||||||||||||||||||||||||||||||||||||||||||||||||||||||||||||||||||||||||||||||||
| No | 83.3% | 12.3% | |||||||||||||||||||||||||||||||||||||||||||||||||||||||||||||||||||||||||||||||||||||||||||||||||
| Yes | 16.7% | 18.6% | |||||||||||||||||||||||||||||||||||||||||||||||||||||||||||||||||||||||||||||||||||||||||||||||||
| CCI groups | |||||||||||||||||||||||||||||||||||||||||||||||||||||||||||||||||||||||||||||||||||||||||||||||||||
| 0 | 31.4% | 8.4% | |||||||||||||||||||||||||||||||||||||||||||||||||||||||||||||||||||||||||||||||||||||||||||||||||
| 1–2 | 35.1% | 13.5% | |||||||||||||||||||||||||||||||||||||||||||||||||||||||||||||||||||||||||||||||||||||||||||||||||
| 3–5 | 26.1% | 16.8% | |||||||||||||||||||||||||||||||||||||||||||||||||||||||||||||||||||||||||||||||||||||||||||||||||
| 6+ | 7.4% | 21.1% | |||||||||||||||||||||||||||||||||||||||||||||||||||||||||||||||||||||||||||||||||||||||||||||||||
| BMI groups | |||||||||||||||||||||||||||||||||||||||||||||||||||||||||||||||||||||||||||||||||||||||||||||||||||
| Underweight | 1.6% | 21.2% | |||||||||||||||||||||||||||||||||||||||||||||||||||||||||||||||||||||||||||||||||||||||||||||||||
| Normal weight | 28.4% | 13.2% | |||||||||||||||||||||||||||||||||||||||||||||||||||||||||||||||||||||||||||||||||||||||||||||||||
| Overweight | 39.4% | 12.6% | |||||||||||||||||||||||||||||||||||||||||||||||||||||||||||||||||||||||||||||||||||||||||||||||||
| Obesity | 30.7% | 14.0% | |||||||||||||||||||||||||||||||||||||||||||||||||||||||||||||||||||||||||||||||||||||||||||||||||
| Top 15 deficits | |||||||||||||||||||||||||||||||||||||||||||||||||||||||||||||||||||||||||||||||||||||||||||||||||||
| Polypharmacy | 89.2% | 14.3% | |||||||||||||||||||||||||||||||||||||||||||||||||||||||||||||||||||||||||||||||||||||||||||||||||
| Hypertension | 72.9% | 15.0% | |||||||||||||||||||||||||||||||||||||||||||||||||||||||||||||||||||||||||||||||||||||||||||||||||
| Arthritis | 55.3% | 15.2% | |||||||||||||||||||||||||||||||||||||||||||||||||||||||||||||||||||||||||||||||||||||||||||||||||
| Diabetes | 32.7% | 15.7% | |||||||||||||||||||||||||||||||||||||||||||||||||||||||||||||||||||||||||||||||||||||||||||||||||
| Social vulnerability | 27.5% | 16.6% | |||||||||||||||||||||||||||||||||||||||||||||||||||||||||||||||||||||||||||||||||||||||||||||||||
| Lung disease | 24.8% | 15.8% | |||||||||||||||||||||||||||||||||||||||||||||||||||||||||||||||||||||||||||||||||||||||||||||||||
| Memory/cognitive | 24.1% | 19.6% | |||||||||||||||||||||||||||||||||||||||||||||||||||||||||||||||||||||||||||||||||||||||||||||||||
| PVD | 23.7% | 17.0% | |||||||||||||||||||||||||||||||||||||||||||||||||||||||||||||||||||||||||||||||||||||||||||||||||
| Coronary Artery | 22.2% | 16.8% | |||||||||||||||||||||||||||||||||||||||||||||||||||||||||||||||||||||||||||||||||||||||||||||||||
| GI disease | 22.2% | 14.9% | |||||||||||||||||||||||||||||||||||||||||||||||||||||||||||||||||||||||||||||||||||||||||||||||||
| Thyroid disease | 21.1% | 14.7% | |||||||||||||||||||||||||||||||||||||||||||||||||||||||||||||||||||||||||||||||||||||||||||||||||
| Cancer | 21.1% | 16.9% | |||||||||||||||||||||||||||||||||||||||||||||||||||||||||||||||||||||||||||||||||||||||||||||||||
| Cerebrovascular TI | 18.3% | 17.5% | |||||||||||||||||||||||||||||||||||||||||||||||||||||||||||||||||||||||||||||||||||||||||||||||||
| Kidney | 14.1% | 19.1% | |||||||||||||||||||||||||||||||||||||||||||||||||||||||||||||||||||||||||||||||||||||||||||||||||
| Atrial Fibrillation | 12.1% | 19.7% | |||||||||||||||||||||||||||||||||||||||||||||||||||||||||||||||||||||||||||||||||||||||||||||||||
| *Pearson Chi-Square, p < 0.05. **Pearson Chi-Square, p < 0.001. | |||||||||||||||||||||||||||||||||||||||||||||||||||||||||||||||||||||||||||||||||||||||||||||||||||
Worsening and frailty transitions
Overall, 13.3% of the cohort experienced worsening of their MEFI after one year of follow-up, and 2.3% had died. The worsening rate, including those who were deceased, was 11.9%, 13.3%, 18.0%, and 8.9% among the fit, mildly frail, moderately frail, and severely frail, respectively. The deceased rate was 0.6%, 1.9%, 5.2%, and 8.9%, respectively (see Figure 1). Estimated transitions from fit to any level of frailty were 10.2% for those aged 65–74, 17.2% for those aged 75–84, and 32.2% for those aged 85+. The worse the frailty was at baseline, the higher the percentage of dying. In each frailty level at baseline, people were likely to remain in their current frailty category, and transitions between adjacent frailty levels were more frequent than those across several frailty levels.
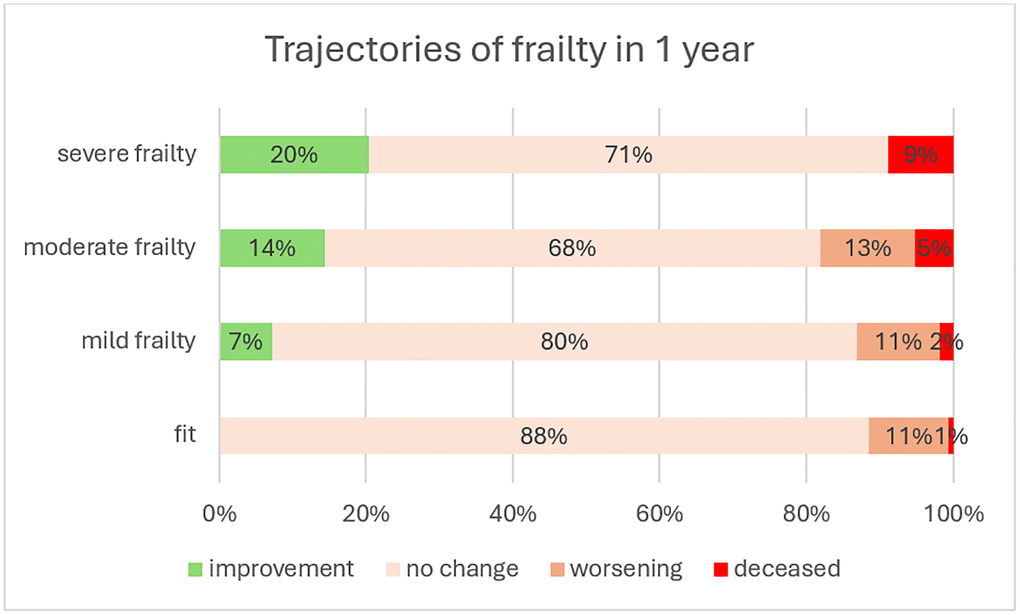
Figure 1. Trajectories of frailty in 1 year.
Predictors of worsening - WHO will worsen first
The worsening rate, including those who died, was 13.5% for females and 13.1% for males (p < 0.001). It increased with age, from 10.0% to 16.2% and 25.6% among the age groups 65–74, 75–84, and 85+, respectively (p < 0.001). The worsening rate decreased as socio-economic status increased, from 14.5% to 11.6%, and was higher among the Arabic sector (15.9%) compared to the general secular Jewish sector (13.2%) (p < 0.001). The worsening rate increased with frailty level at baseline, from 11.9% among the fit to 13.3% among the mildly frail, 18.0% among the moderately frail, and then declined to 8.8% among the severely frail (p < 0.001). The death rate increased with frailty level, at 0.6%, 1.9%, 5.2%, and 8.8% among the fit, mild, moderate, and severe frailty groups, respectively (worsening among the severe frailty group means they died). Those who had a previous hospitalization during the year 2022 had a worsening rate of 18.6%, a 52% higher rate than those who were not hospitalized (p < 0.001). Higher CCI scores showed a higher worsening rate, from 8.4% to 13.5%, 16.8%, and 21.1% for the fit, mild frailty, moderate frailty, and severe frailty, respectively (p < 0.001). The baseline deficits in January 2023 most associated with worsening, with a crude OR >1.5 or lower than 0.5, were, in decreasing order: polypharmacy, dementia, housebound, heart failure, memory and cognitive problems, hypertension, atrial fibrillation, kidney diseases, fall-related, activity limitation, sleep disturbance, and requirement for care.
A multivariate analysis conducted to determine factors associated with frailty worsening revealed that being female (OR = 1.18; 95% CI: 1.13, 1.22), being older (aged 75–84 vs. age 65–74: OR = 1.72; 95% CI: 1.65, 1.80); aged 85+ vs. age 65–74: OR = 2.80; 95% CI: 2.63, 2.98), and belonging to the Arabic sector (OR = 1.11; 95% CI: 1.04, 1.19), were associated with increased odds of frailty worsening at 1 year (see Table 3). Conversely, socio-economic status was associated with decreased odds of frailty worsening (SES intermediate vs. low: OR = 0.91; 95% CI: 0.87, 0.95); (SES high vs. low: OR = 0.77; 95% CI: 0.72, 0.82). Higher frailty was associated with lower odds of worsening, compared with the fit level (mild: OR = 0.33; 95% CI: 0.32, 0.35); (moderate 65–74: OR = 0.15; 95% CI: 0.14, 0.16); (severe: OR = 0.02; 95% CI: 0.02, 0.02). The underweight group (OR = 0.56; 95% CI: 0.50, 0.64), the overweight group (OR = 0.53; 95%CI: 0.47, 0.60), and the obese group (OR = 0.58; 95% CI: 0.51, 0.66) had higher odds of worsening, compared with normal weight. Hospitalization during the year before, and higher CCI score, were also predictors for a worsened frailty transition after 1 year (OR = 1.41; 95% CI: 1.35, 1.48). The deficits in 2023 with a crude OR higher than 1.5 or lower than 0.5 at the univariable level were also included in the model. Risk groups with the highest odds of worsening, in descending order, were those with polypharmacy, memory and cognitive problems, housebound, dementia, hypertension, heart failure, and atrial fibrillation. The c-index for discrimination was 0.734, as measured by Harrell’s concordance index (CI95%: 0.729–0.738). There was no multicollinearity between the predictors, with variance in inflation factors (VIFs) less than 3.
Table 3. Multivariate logistic regression models for frailty worsening 1 year later.
| Crude OR | aOR* | 95% CI-OR** | Sig | ||||||||||||||||||||||||||||||||||||||||||||||||||||||||||||||||||||||||||||||||||||||||||||||||
| Sex | |||||||||||||||||||||||||||||||||||||||||||||||||||||||||||||||||||||||||||||||||||||||||||||||||||
| Male | Reference | Reference | |||||||||||||||||||||||||||||||||||||||||||||||||||||||||||||||||||||||||||||||||||||||||||||||||
| Female | 1.03 | 1.18 | 1.13–1.20 | <.001 | |||||||||||||||||||||||||||||||||||||||||||||||||||||||||||||||||||||||||||||||||||||||||||||||
| Age groups | |||||||||||||||||||||||||||||||||||||||||||||||||||||||||||||||||||||||||||||||||||||||||||||||||||
| 65–74 years | Reference | Reference | |||||||||||||||||||||||||||||||||||||||||||||||||||||||||||||||||||||||||||||||||||||||||||||||||
| 75–84 years | 1.62 | 1.72 | 1.65–1.79 | <.001 | |||||||||||||||||||||||||||||||||||||||||||||||||||||||||||||||||||||||||||||||||||||||||||||||
| 85+ years | 2.56 | 2.80 | 2.63–2.98 | <.001 | |||||||||||||||||||||||||||||||||||||||||||||||||||||||||||||||||||||||||||||||||||||||||||||||
| SES groups | |||||||||||||||||||||||||||||||||||||||||||||||||||||||||||||||||||||||||||||||||||||||||||||||||||
| Low | Reference | Reference | |||||||||||||||||||||||||||||||||||||||||||||||||||||||||||||||||||||||||||||||||||||||||||||||||
| Intermediate | 0.91 | 0.91 | 0.87–0.95 | <.001 | |||||||||||||||||||||||||||||||||||||||||||||||||||||||||||||||||||||||||||||||||||||||||||||||
| High | 0.80 | 0.77 | 0.72–0.82 | <.001 | |||||||||||||||||||||||||||||||||||||||||||||||||||||||||||||||||||||||||||||||||||||||||||||||
| Sector | |||||||||||||||||||||||||||||||||||||||||||||||||||||||||||||||||||||||||||||||||||||||||||||||||||
| Jewish secular | Reference | Reference | |||||||||||||||||||||||||||||||||||||||||||||||||||||||||||||||||||||||||||||||||||||||||||||||||
| Jewish orthodox | 0.95 | 0.91 | 0.86–0.96 | <.001 | |||||||||||||||||||||||||||||||||||||||||||||||||||||||||||||||||||||||||||||||||||||||||||||||
| Arabic | 1.21 | 1.11 | 1.04–1.19 | <.001 | |||||||||||||||||||||||||||||||||||||||||||||||||||||||||||||||||||||||||||||||||||||||||||||||
| MEFI 2023 | |||||||||||||||||||||||||||||||||||||||||||||||||||||||||||||||||||||||||||||||||||||||||||||||||||
| Fit | Reference | Reference | |||||||||||||||||||||||||||||||||||||||||||||||||||||||||||||||||||||||||||||||||||||||||||||||||
| Mild frailty | 1.12 | 0.57 | 0.54–0.60 | <.001 | |||||||||||||||||||||||||||||||||||||||||||||||||||||||||||||||||||||||||||||||||||||||||||||||
| Moderate frailty | 1.51 | 0.45 | 0.42–0.48 | <.001 | |||||||||||||||||||||||||||||||||||||||||||||||||||||||||||||||||||||||||||||||||||||||||||||||
| Severe frailty | 0.74 | 0.12 | 0.10–0.13 | <.001 | |||||||||||||||||||||||||||||||||||||||||||||||||||||||||||||||||||||||||||||||||||||||||||||||
| Hosp. year before | |||||||||||||||||||||||||||||||||||||||||||||||||||||||||||||||||||||||||||||||||||||||||||||||||||
| No | Reference | Reference | |||||||||||||||||||||||||||||||||||||||||||||||||||||||||||||||||||||||||||||||||||||||||||||||||
| Yes | 1.52 | 1.41 | 1.35–1.48 | <.001 | |||||||||||||||||||||||||||||||||||||||||||||||||||||||||||||||||||||||||||||||||||||||||||||||
| CCI groups | |||||||||||||||||||||||||||||||||||||||||||||||||||||||||||||||||||||||||||||||||||||||||||||||||||
| 0 | Reference | Reference | |||||||||||||||||||||||||||||||||||||||||||||||||||||||||||||||||||||||||||||||||||||||||||||||||
| 1–2 | 1.62 | 1.74 | 1.66–1.83 | <.001 | |||||||||||||||||||||||||||||||||||||||||||||||||||||||||||||||||||||||||||||||||||||||||||||||
| 3–5 | 2.01 | 2.57 | 2.42–2.73 | <.001 | |||||||||||||||||||||||||||||||||||||||||||||||||||||||||||||||||||||||||||||||||||||||||||||||
| 6+ | 2.52 | 4.01 | 3.68–4.37 | <.001 | |||||||||||||||||||||||||||||||||||||||||||||||||||||||||||||||||||||||||||||||||||||||||||||||
| BMI groups | |||||||||||||||||||||||||||||||||||||||||||||||||||||||||||||||||||||||||||||||||||||||||||||||||||
| Underweight | 1.61 | 0.56 | 0.50–0.64 | <.001 | |||||||||||||||||||||||||||||||||||||||||||||||||||||||||||||||||||||||||||||||||||||||||||||||
| Normal weight | Reference | Reference | |||||||||||||||||||||||||||||||||||||||||||||||||||||||||||||||||||||||||||||||||||||||||||||||||
| Overweight | 0.96 | 0.53 | 0.47–0.60 | 0.42 | |||||||||||||||||||||||||||||||||||||||||||||||||||||||||||||||||||||||||||||||||||||||||||||||
| Obesity | 1.06 | 0.58 | 0.51–0.66 | <.001 | |||||||||||||||||||||||||||||||||||||||||||||||||||||||||||||||||||||||||||||||||||||||||||||||
| Comorbidity | |||||||||||||||||||||||||||||||||||||||||||||||||||||||||||||||||||||||||||||||||||||||||||||||||||
| Act. Limitation | 0.34 | 0.33 | 0.25–0.43 | <.001 | |||||||||||||||||||||||||||||||||||||||||||||||||||||||||||||||||||||||||||||||||||||||||||||||
| Atrial Fibrillation | 1.58 | 1.59 | 1.51–1.68 | <.001 | |||||||||||||||||||||||||||||||||||||||||||||||||||||||||||||||||||||||||||||||||||||||||||||||
| Dementia | 2.03 | 1.734 | 1.63–1.86 | <.001 | |||||||||||||||||||||||||||||||||||||||||||||||||||||||||||||||||||||||||||||||||||||||||||||||
| Fall Related | 0.63 | 0.61 | 0.54–0.69 | <.001 | |||||||||||||||||||||||||||||||||||||||||||||||||||||||||||||||||||||||||||||||||||||||||||||||
| Heart Failure | 1.74 | 1.60 | 1.51–1.70 | <.001 | |||||||||||||||||||||||||||||||||||||||||||||||||||||||||||||||||||||||||||||||||||||||||||||||
| Housebound | 2.00 | 1.83 | 1.71–1.97 | <.001 | |||||||||||||||||||||||||||||||||||||||||||||||||||||||||||||||||||||||||||||||||||||||||||||||
| Hypertension | 1.68 | 1.66 | 1.58–1.74 | <.001 | |||||||||||||||||||||||||||||||||||||||||||||||||||||||||||||||||||||||||||||||||||||||||||||||
| Kidney disease | 1.54 | 1.39 | 1.32–1.47 | <.001 | |||||||||||||||||||||||||||||||||||||||||||||||||||||||||||||||||||||||||||||||||||||||||||||||
| Memory/Cognitive | 1.73 | 2.23 | 2.13–2.33 | <.001 | |||||||||||||||||||||||||||||||||||||||||||||||||||||||||||||||||||||||||||||||||||||||||||||||
| Polypharmacy | 2.75 | 2.87 | 2.63–3.13 | <.001 | |||||||||||||||||||||||||||||||||||||||||||||||||||||||||||||||||||||||||||||||||||||||||||||||
| Require for Care | 0.10 | 0.05 | 0.02–0.13 | <.001 | |||||||||||||||||||||||||||||||||||||||||||||||||||||||||||||||||||||||||||||||||||||||||||||||
| Sleep disturbance | 0.29 | 0.33 | 0.27–0.41 | <.001 | |||||||||||||||||||||||||||||||||||||||||||||||||||||||||||||||||||||||||||||||||||||||||||||||
| *aOR, odds ratio adjusted for other listed variables. **All the aOR were significant at p < 0.001. | |||||||||||||||||||||||||||||||||||||||||||||||||||||||||||||||||||||||||||||||||||||||||||||||||||
New deficits - WHAT will worsen first
Among the 117,141 patients alive at the end of the follow-up, 38.0% were fit, 40.5% had mild frailty, 16.3% had moderate frailty, and 5.1% had severe frailty at the beginning of the follow-up.
At baseline, chronic diseases had the highest prevalence in all frailty groups. Among the fit, mild frailty, moderate frailty, and severe frailty groups, hypertension was reported in 48.9%, 83.2%, 93.7%, and 97.7%, respectively, followed by arthritis in 31.8%, 63.7%, 78.5%, and 88.0%, respectively. Other chronic diseases such as diabetes, lung disease, peripheral vascular disease, and coronary artery disease were also prevalent in each frailty group. However, when looking at the prevalence of new deficits that emerged during the follow-up year, in descending order, most chronic diseases appeared in the lower half of the list. Figure 2 summarizes the top 15 new deficits stratified by frailty. Eight of the deficits appeared in all four frailty groups: gait abnormality, hearing impairment, muscular wasting, anemia, sleep disturbance, incontinence, vision comorbidity, and memory and cognitive problems. The percentage of new deficits increased with frailty level; for example, gait abnormality appeared as a new deficit in 3% of the fit, 8% of the mild, 16% of the moderate, and 25% of the severe frailty groups. Hearing impairment appeared as a new deficit in 6% of the fit, 8% of the mild, and 11% of the moderate and severe frailty groups. When stratifying by age at baseline within each frailty level, most of the top 15 deficiencies beyond age also appeared in each age group. The number of deficits in common with the top 15 list was 14, 14, and 12 among the mild group, 14, 13, and 11 among the mild frailty group, 14, 15, and 14 among the moderate frailty group, and 13, 14, and 15 among the severe frailty group, within those aged 65–74, 75–84, and 85+, respectively (see Supplementary Table 1).
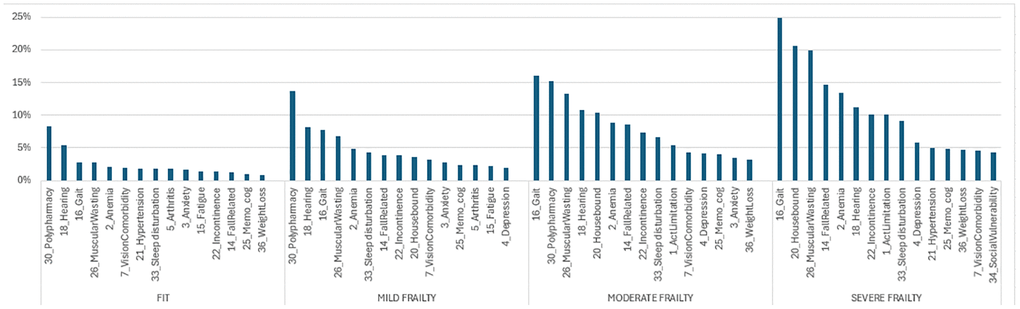
Figure 2. Top 15 new deficits in 2024, stratified by baseline frailty.
Discussion
Our paper aims to better understand the dynamics of worsening frailty, focusing on the scope of the issue, identifying who deteriorates first, and determining which deficits are likely to deteriorate first. The ultimate goal is to enhance the quality of care we provide for our patients. By understanding the frequency of frailty deterioration, we can grasp the urgency of taking action. Knowing who deteriorates first allows us to focus our efforts, and identifying what deteriorates first helps us prioritize issues for intervention. Preventing frailty deterioration can be beneficial at the individual clinical care level, in population management by identifying risk groups, and in developing intervention programs that address the most likely problems.
Our first objective was to describe the dynamic trajectory of frailty over one year of follow-up. We found that 12% of fit individuals worsened, and among those with mild frailty, 7% improved, 80% remained in the same frailty category, and 13% worsened. This outcome is very similar to the worsening rate observed in Thompson’s cohort, which was computed to an annual transition rate by Kaskirbayeva [31, 33]. Estimated transitions from fit to any level of frailty were higher in the Walsh cohort, likely due to the younger age of the cohort in our study, but the rates were proportionally almost identical to our cohort [45]. The similarity with these cohorts, which also used community-dwelling participants and an EFI to measure frailty, strengthens and validates our worsening measure. Our second objective was to identify who deteriorates first. We found that 13.3% worsened after one year of follow-up, with higher worsening prevalence among females, older individuals, those with lower socio-economic levels, and those with comorbidities. Our findings align with the literature, including the debate about the association between sex and deterioration. Kojima’s systematic review and meta-analysis found that women change more in both directions [7]. This is consistent with our findings: a higher rate of worsening among females than males (13.5% vs. 13.1%, respectively) and a higher rate of improvement among females than males (7.0% vs. 5.8%, respectively). We also observed that the worsening rate increased with the frailty level, consistent with the literature, but we noted a decline among the severe frailty group. This aligns with the finding that the longest period spent within the same frailty category is among the severely frail [45]. Although a negative relationship between baseline frailty and frailty worsening was found in the multivariate analysis, the positive relationship observed in the univariate analysis reappeared when the model was not controlled for age and comorbidity. Our third objective was to identify what deteriorates first at each frailty level. Among patients alive at the end of follow-up, although chronic diseases had the highest prevalence at baseline, there were few new cases of chronic diseases. This can be explained by the evidence that chronic diseases mostly occur before age 65 and, once diagnosed, remain. A study on the age of onset of chronic diseases showed that the median age of onset for seven diseases (hypertension, diabetes, lung disease, heart disease or stroke, arthritis, neurological diseases, and cancer) was before age 60 [49]. Most new deficits added during follow-up were related to general health and functionality and were similar across the four frailty groups. Even when stratified by age groups, the same new deficits appeared in each age group within the frailty levels. The new MEFI deficits, similar to risk factors found in the literature, included declines in mobility and stability (activity limitation, gait, muscular wasting, and falls), sensory impairment (hearing impairment and vision comorbidity), emotional problems (depression), memory and cognitive impairment, and other signs (sleep disturbance, incontinence). These are modifiable risk factors, and appropriate intervention programs may reduce deterioration. A primary care-based intervention found that a multifaceted approach (physical, nutritional, neurocognitive, and pharmacological) was effective in reversing frailty measures both short-term and at 18 months [50]. A systematic review showed that exercise training can reduce frailty levels and improve prognosis among older adults [51]. A meta-analysis of 15 studies found that resistance band exercise reduced frailty among older adults after 24 weeks [52]. Preventing frailty worsening is crucial due to its association with diseases. Progression from robust to frailty or pre-frailty increased the risk of new-onset diabetes [53] and incident cardiovascular diseases [54]. Moreover, patients who recovered to robust or pre-frail status had decreased risks of incident cardiovascular disease [54]. These findings suggest that reducing frailty has a further impact on reducing adverse outcomes.
The strength of our study lies in its large population-based design with real-world data, exploring how frailty status changes over time, an issue that remains largely unexplored. To our knowledge, this study is the first to specify which deficits may appear first in terms of EFI deficits. In many health systems, these EFI deficits are routinely documented, enabling easy ongoing monitoring. Longitudinal frailty information at the population level is needed to plan services [45]. Specifically, identifying demographic and health risk groups will allow us to determine whom to intervene with first, and identifying deficits at risk for deterioration will help us focus on preventing or delaying frailty transition.
As an HMO, one of our roles is to prevent diseases and improve the health of our patients. Among the population aged 65+, it is essential to understand how modifiable risk factors such as sensory, functional, emotional, and cognitive factors impact frailty worsening, which in turn affects adverse outcomes. Focusing on intervention programs that address these health promotion issues can significantly contribute to disease control and slow the progression of frailty.
Limitation
One may argue that one year of follow-up is short. However, in high-aged individuals, a one-year observation period seemed sufficient to analyze frailty transition effectively [32]. Another limitation is the inherent limitations of administrative databases and the retrospective nature of this study, which may have led to the incorrect omission of certain deficits. As a result, there may be some random under-reporting, but this would be consistent across the two years compared. A third limitation concerns the length of the look-back period for chronic diseases (from age 55) compared to the commonly accepted one- to three-year period, which may have resulted in an overestimation of certain deficits. However, the decision to use a longer period was driven by coding practices and computational limitations in Meuhedet’s EMR. Since chronic conditions often go uncoded in problem lists, a shorter look-back period could have led to the omission of various chronic conditions.
Conclusions
Frailty tends to worsen over time, but the process can be slowed with relevant prevention programs and treatment. Although chronic diseases in old age are frequent, they usually appear earlier in life, and new deficits that may appear later mainly include modifiable risk factors related to general health and functionality. Emphasizing intervention programs based on these health issues may significantly impact disease control and slow frailty worsening.
Materials and Methods
In this study, we adhered to the STROBE reporting guideline for cohort studies [55].
Study design
This is a retrospective, longitudinal, population-based cohort study that includes repeated measures at baseline and one year later.
Setting
Healthcare in Israel is universal, and participation in a medical insurance plan is compulsory. All Israeli residents are entitled to basic health care as a fundamental right. The Israeli healthcare system is based on the National Health Insurance Law of 1995 [56], which mandates that all citizens residing in the country join one of four official health insurance organizations, all of which are run as not-for-profit organizations. The Meuhedet HMO is Israel’s third-largest integrated healthcare service provider, serving over 1.3 million patients nationwide of all ages. Patient-level data are stored by Meuhedet in a comprehensive data warehouse, including chronic illnesses, community-care visits, medications, laboratory test results, pharmaceutical records, and socio-demographic information. The frailty level of all HMO members aged 65+ is updated each month based on the electronic medical record. The data for this study were extracted from the Meuhedet Electronic Health Record on 1 January 2023 and 1 January 2024 to enable one-year follow-up.
Eligibility criteria
The cohort included all 119,952 Meuhedet members aged 65 years and over who were alive at the beginning of 2023, including 2,811 who died during 2023, excluding those who left the HMO during 2023. Housebound individuals were included, but patients living in an institution were excluded since most of the medical information is filed in the institution and not in the HMO. Specifically, for the analysis of what will worsen first, the 2,811 patients who died before the end of the year were excluded as the presence of new deficits could not be assessed.
Variables
Predictors
Age groups: Age was divided into three categories: Young-old (65–74), middle-old (75–84), and oldest-old (85+). These categories are common and are based on biological aspects of age.
Sex: Males and females, as recorded in the electronic health record.
Sector: About 75% of Israelis are Jews, and one-quarter are Arabs, including Druze and Christian Arabs [57]. Among the Jewish population, about 17% are considered ultra-orthodox. Since the individual sector characteristic is not documented in the medical file, the sector used here is determined according to the clinic’s sector where the patient belongs, namely, the Jewish secular, the Jewish Orthodox, and the Arabic sectors. Since most of the clinics are located in neighborhoods mostly composed of members of only one sector, this method allows for adequate classification.
Socio-economic status (SES): Derived from the individual’s home address and based on characteristics routinely collected by the Central Bureau of Statistics, ranging from 1 to 10. SES was grouped into three levels: 1–4 low, 5–7 medium, and 8–10 high.
MEFI: MEFI, which stands for Meuhedet Electronic Frailty Index, is an EFI version we developed [6], based on Clegg [12] and on Orkaby Electronic Frailty Index [8]. MEFI is computed by extracting routinely collected health data directly from electronic medical records. It summarizes the number of deficits from a list of 36 variables, including chronic diseases, basic and instrumental activities of daily living, social aspects, mood, hearing or vision impairment, and cognitive functioning (see Table 1). The weight was the same for all the deficits, one point, conforming to Clegg’s definition. The look-back period for chronic diseases was from the age of 55, and the look-back period for non-disease deficits (such as functional deficits) was reduced to one year, a period that is well-accepted in the literature. Except for chronic diseases, a deficit that didn’t appear anymore in the electronic health record was considered to reflect recovery or resolution of the condition. This assumption is justified by the fact that the health system in Israel allows access to primary care at almost no cost, and indeed, only 2.3% did not visit any medical staff during the look-back period. The MEFI classifies individuals as ‘fit’ or exhibiting frailty in the ‘mild’, ‘moderate’, or ‘severe’ frailty range, based on the MEFI score (fit (0–0.12; 0–4 deficits), mild (0.13–0.24; 5–8 deficits), moderate (0.25–0.36; 8–12 deficits), and severe (>0.36; 13+ deficits), in line with EFI categories described in the literature [12, 14]. MEFI was shown to predict mortality and hospitalization [6]. More details of the validation study have been described elsewhere [6].
CCI: The Charlson Comorbidity Index (CCI) assesses comorbidity levels by considering both the number and severity of 17 pre-defined comorbid conditions [58]. The higher the score, the higher the predicted mortality rate. CCI was categorized into four grades: no comorbidity (0), mild (1–2), moderate (3–5), and severe (6+). Five CCI comorbidities out of 19 were common to both CCI and MEFI.
BMI: The BMI is based on the last height and weight measures recorded in the electronic health record in the HMO. It was categorized into four levels according to the division mostly used in health: underweight - less than 18.5, normal 18.5–<25, overweight 25–<30, and obese 30+.
Hospitalization in the past year: This variable receives a value of 1 if the patient experienced any hospitalization in 2022, the year just preceding the follow-up period.
Outcome measure
The frailty index is calculated every month. Worsening was defined as any change to a worse frailty category one year following diagnosis. The worsening outcome received a value of 1 if the MEFI level on 1 January 2024, as divided into four categories, was worse than the MEFI level on 1 January 2023. Those who passed away during 2023 received a value of 1, which is considered worsening.
For determining what worsened first, the new deficit measure received a value of 1 if the deficit didn’t appear in 2023 and appeared in 2024.
Statistical methods
Descriptive statistics of the population were presented as either means (standard deviations) for continuous variables or percentages for categorical variables. Worsening was presented by percentages, overall, and stratified by MEFI. Comparing worsening by demographic and clinical characteristics was tested using the chi-square test. Additionally, multivariable logistic regression was conducted to identify variables associated with frailty worsening, and a concordance index (C-Index) was used for model validation. Multicollinearity was tested by calculating variance inflation factors (VIFs). The percentage of new deficits among those still alive at the end of the follow-up was presented as a percentage and sorted by decreasing size in each frailty group. Data were analyzed using IBM SPSS statistics software [59]. All statistical tests were two-sided, and p-values lower than 0.05 were considered statistically significant.
Supplementary Materials
Author Contributions
FH designed the methodology, drafted the paper, calculated the MEFI, and performed the statistical analysis. YK initiated the development of a frailty index and supervised the whole process. ML revised and adapted the ICD-9 medical coding to Meuhedet’s data. BM extracted the data from the EMR. IW, the geriatric nurse, and GS, the geriatric doctor, accompanied the process. FH, RS, YK, OS, AB, GS and IW participated in the development of the index. TS advised as a biostatistical consultant. YK, RS, and ML revised the manuscript for important intellectual content. DA, chief medical officer, contributed his knowledge at all stages.
Acknowledgments
Thanks to the many people who participated in our brainstorming meetings and contributed insights, including experts in geriatrics, health professionals and health teams in the field.
Conflicts of Interest
No sponsor had a role in the decision to undertake these analyses or to submit the study for publication. Each author asserts no proprietary interest in the result and no financial conflict of interest.
Ethical Statement and Consent
In this study, were adhered to the STROBE reporting guideline for cohort studies. Due to the retrospective cohort design of this study, formal ethical approval and individual consent were not deemed necessary.
Funding
No funding was used for this paper.
References
- 1. Mitnitski A, Rockwood K. Aging as a process of deficit accumulation: its utility and origin. Interdiscip Top Gerontol. 2015; 40:85–98. https://doi.org/10.1159/000364933 [PubMed]
- 2. Clegg A, Young J, Iliffe S, Rikkert MO, Rockwood K. Frailty in elderly people. Lancet. 2013; 381:752–62. https://doi.org/10.1016/S0140-6736(12)62167-9 [PubMed]
- 3. Fried LP, Tangen CM, Walston J, Newman AB, Hirsch C, Gottdiener J, Seeman T, Tracy R, Kop WJ, Burke G, McBurnie MA, and Cardiovascular Health Study Collaborative Research Group. Frailty in older adults: evidence for a phenotype. J Gerontol A Biol Sci Med Sci. 2001; 56:M146–56. https://doi.org/10.1093/gerona/56.3.m146 [PubMed]
- 4. Lin KP, Li HY, Chen JH, Lu FP, Wen CJ, Chou YC, Wu MC, Derrick Chan DC, Chen YM. Prediction of adverse health outcomes using an electronic frailty index among nonfrail and prefrail community elders. BMC Geriatr. 2023; 23:474. https://doi.org/10.1186/s12877-023-04160-1 [PubMed]
- 5. Kojima G. Frailty as a predictor of hospitalisation among community-dwelling older people: a systematic review and meta-analysis. J Epidemiol Community Health. 2016; 70:722–9. https://doi.org/10.1136/jech-2015-206978 [PubMed]
- 6. Hershkowitz Sikron F, Schenker R, Koom Y, Segal G, Shahar O, Wolf I, Mazengya B, Lewis M, Laxer I, Albukrek D. Development and validation of an electronic frailty index in a national health maintenance organization. Aging (Albany NY). 2024; 16:13025–38. https://doi.org/10.18632/aging.206141 [PubMed]
- 7. Kojima G, Iliffe S, Walters K. Frailty index as a predictor of mortality: a systematic review and meta-analysis. Age Ageing. 2018; 47:193–200. https://doi.org/10.1093/ageing/afx162 [PubMed]
- 8. Orkaby AR, Nussbaum L, Ho YL, Gagnon D, Quach L, Ward R, Quaden R, Yaksic E, Harrington K, Paik JM, Kim DH, Wilson PW, Gaziano JM, et al. The Burden of Frailty Among U.S. Veterans and Its Association With Mortality, 2002-2012. J Gerontol A Biol Sci Med Sci. 2019; 74:1257–64. https://doi.org/10.1093/gerona/gly232 [PubMed]
- 9. Vermeiren S, Vella-Azzopardi R, Beckwée D, Habbig AK, Scafoglieri A, Jansen B, Bautmans I, and Gerontopole Brussels Study group. Frailty and the Prediction of Negative Health Outcomes: A Meta-Analysis. J Am Med Dir Assoc. 2016; 17:1163.e1–17. https://doi.org/10.1016/j.jamda.2016.09.010 [PubMed]
- 10. Mitnitski AB, Mogilner AJ, Rockwood K. Accumulation of deficits as a proxy measure of aging. ScientificWorldJournal. 2001; 1:323–36. https://doi.org/10.1100/tsw.2001.58 [PubMed]
- 11. Rockwood K, Mitnitski A. Frailty in relation to the accumulation of deficits. J Gerontol A Biol Sci Med Sci. 2007; 62:722–7. https://doi.org/10.1093/gerona/62.7.722 [PubMed]
- 12. Clegg A, Bates C, Young J, Ryan R, Nichols L, Ann Teale E, Mohammed MA, Parry J, Marshall T. Development and validation of an electronic frailty index using routine primary care electronic health record data. Age Ageing. 2016; 45:353–60. https://doi.org/10.1093/ageing/afw039 [PubMed]
- 13. England NHS. National Health Service England. Identifying frailty. https://www.england.nhs.uk/ourwork/clinical-policy/older-people/frailty/frailty-risk-identification/. 2024.
- 14. Lansbury LN, Roberts HC, Clift E, Herklots A, Robinson N, Sayer AA. Use of the electronic Frailty Index to identify vulnerable patients: a pilot study in primary care. Br J Gen Pract. 2017; 67:e751–6. https://doi.org/10.3399/bjgp17X693089 [PubMed]
- 15. Mak JKL, Religa D, Jylhävä J. Automated frailty scores: towards clinical implementation. Aging (Albany NY). 2023; 15:4571–3. https://doi.org/10.18632/aging.204815 [PubMed]
- 16. Thandi M, Wong ST, Price M, Baumbusch J. Perspectives on the representation of frailty in theṣelectronic frailty index. BMC Prim Care. 2024; 25:4. https://doi.org/10.1186/s12875-023-02225-z [PubMed]
- 17. Pajewski NM, Lenoir K, Wells BJ, Williamson JD, Callahan KE. Frailty Screening Using the Electronic Health Record Within a Medicare Accountable Care Organization. J Gerontol A Biol Sci Med Sci. 2019; 74:1771–7. https://doi.org/10.1093/gerona/glz017 [PubMed]
- 18. Abbasi M, Khera S, Dabravolskaj J, Vandermeer B, Theou O, Rolfson D, Clegg A. A cross-sectional study examining convergent validity of a frailty index based on electronic medical records in a Canadian primary care program. BMC Geriatr. 2019; 19:109. https://doi.org/10.1186/s12877-019-1119-x [PubMed]
- 19. Ambagtsheer RC, Beilby J, Dabravolskaj J, Abbasi M, Archibald MM, Dent E. Application of an electronic Frailty Index in Australian primary care: data quality and feasibility assessment. Aging Clin Exp Res. 2019; 31:653–60. https://doi.org/10.1007/s40520-018-1023-9 [PubMed]
- 20. Shen Y, Wang Y, Shi Q, Hou L, Chen X, Dong B, Hao Q. The Electronic Frailty Index is Associated with Increased Infection and All-Cause Mortality Among Older Patients with Primary Lung Cancer: A Cohort Study. Clin Interv Aging. 2021; 16:1825–33. https://doi.org/10.2147/CIA.S335172 [PubMed]
- 21. Nishimura S, Kumamaru H, Shoji S, Nakatani E, Yamamoto H, Ichihara N, Miyachi Y, Sandhu AT, Heidenreich PA, Yamauchi K, Watanabe M, Miyata H, Kohsaka S. Assessment of coding-based frailty algorithms for long-term outcome prediction among older people in community settings: a cohort study from the Shizuoka Kokuho Database. Age Ageing. 2022; 51:afac009. https://doi.org/10.1093/ageing/afac009 [PubMed]
- 22. Orfila F, Carrasco-Ribelles LA, Abellana R, Roso-Llorach A, Cegri F, Reyes C, Violán C. Validation of an electronic frailty index with electronic health records: eFRAGICAP index. BMC Geriatr. 2022; 22:404. https://doi.org/10.1186/s12877-022-03090-8 [PubMed]
- 23. Mak JKL, Hägg S, Eriksdotter M, Annetorp M, Kuja-Halkola R, Kananen L, Boström AM, Kivipelto M, Metzner C, Bäck Jerlardtz V, Engström M, Johnson P, Lundberg LG, et al. Development of an Electronic Frailty Index for Hospitalized Older Adults in Sweden. J Gerontol A Biol Sci Med Sci. 2022; 77:2311–9. https://doi.org/10.1093/gerona/glac069 [PubMed]
- 24. Hollinghurst J, Fry R, Akbari A, Clegg A, Lyons RA, Watkins A, Rodgers SE. External validation of the electronic Frailty Index using the population of Wales within the Secure Anonymised Information Linkage Databank. Age Ageing. 2019; 48:922–6. https://doi.org/10.1093/ageing/afz110 [PubMed]
- 25. Devereux N, Ellis G, Dobie L, Baughan P, Monaghan T. Testing a proactive approach to frailty identification: the electronic frailty index. BMJ Open Qual. 2019; 8:e000682. https://doi.org/10.1136/bmjoq-2019-000682 [PubMed]
- 26. Setiati S, Laksmi PW, Aryana IGP, Sunarti S, Widajanti N, Dwipa L, Seto E, Istanti R, Ardian LJ, Chotimah SC. Frailty state among Indonesian elderly: prevalence, associated factors, and frailty state transition. BMC Geriatr. 2019; 19:182. https://doi.org/10.1186/s12877-019-1198-8 [PubMed]
- 27. Stolz E, Schultz A, Mayerl H, Roller-Wirnsberger R, Andrew C. Revisiting unstable disability and the fluctuations of frailty: a measurement burst approach. Age Ageing. 2024; 53:afae170. https://doi.org/10.1093/ageing/afae170 [PubMed]
- 28. Bentur N, Sternberg SA, Shuldiner J. Frailty Transitions in Community Dwelling Older People. Isr Med Assoc J. 2016; 18:449–53. [PubMed]
- 29. Wang MC, Li TC, Li CI, Liu CS, Lin WY, Lin CH, Yang CW, Yang SY, Lin CC. Frailty, transition in frailty status and all-cause mortality in older adults of a Taichung community-based population. BMC Geriatr. 2019; 19:26. https://doi.org/10.1186/s12877-019-1039-9 [PubMed]
- 30. Mian H, Wildes TM, Vij R, Pianko MJ, Major A, Fiala MA. Dynamic frailty risk assessment among older adults with multiple myeloma: A population-based cohort study. Blood Cancer J. 2023; 13:76. https://doi.org/10.1038/s41408-023-00843-5 [PubMed]
- 31. Kaskirbayeva D, West R, Jaafari H, King N, Howdon D, Shuweihdi F, Clegg A, Nikolova S. Progression of frailty as measured by a cumulative deficit index: A systematic review. Ageing Res Rev. 2023; 84:101789. https://doi.org/10.1016/j.arr.2022.101789 [PubMed]
- 32. Kojima G, Taniguchi Y, Iliffe S, Jivraj S, Walters K. Transitions between frailty states among community-dwelling older people: A systematic review and meta-analysis. Ageing Res Rev. 2019; 50:81–8. https://doi.org/10.1016/j.arr.2019.01.010 [PubMed]
- 33. Thompson MQ, Theou O, Adams RJ, Tucker GR, Visvanathan R. Frailty state transitions and associated factors in South Australian older adults. Geriatr Gerontol Int. 2018; 18:1549–55. https://doi.org/10.1111/ggi.13522 [PubMed]
- 34. Elhussein L, Robinson DE, Delmestri A, Clegg A, Prieto-Alhambra D, Silman A, Strauss VY. Longitudinal trajectories of frailty are associated with short-term mortality in older people: a joint latent class models analysis using 2 UK primary care databases. J Clin Epidemiol. 2024; 173:111442. https://doi.org/10.1016/j.jclinepi.2024.111442 [PubMed]
- 35. Ye B, Chen H, Huang L, Ruan Y, Qi S, Guo Y, Huang Z, Sun S, Chen X, Shi Y, Gao J, Jiang Y. Changes in frailty among community-dwelling Chinese older adults and its predictors: evidence from a two-year longitudinal study. BMC Geriatr. 2020; 20:130. https://doi.org/10.1186/s12877-020-01530-x [PubMed]
- 36. Mielke N, Schneider A, Huscher D, Ebert N, Schaeffner E. Gender differences in frailty transition and its prediction in community-dwelling old adults. Sci Rep. 2022; 12:7341. https://doi.org/10.1038/s41598-022-11358-7 [PubMed]
- 37. Trevisan C, Veronese N, Maggi S, Baggio G, Toffanello ED, Zambon S, Sartori L, Musacchio E, Perissinotto E, Crepaldi G, Manzato E, Sergi G. Factors Influencing Transitions Between Frailty States in Elderly Adults: The Progetto Veneto Anziani Longitudinal Study. J Am Geriatr Soc. 2017; 65:179–84. https://doi.org/10.1111/jgs.14515 [PubMed]
- 38. Liu Y, Huang L, Hu F, Zhang X. Investigating Frailty, Polypharmacy, Malnutrition, Chronic Conditions, and Quality of Life in Older Adults: Large Population-Based Study. JMIR Public Health Surveill. 2024; 10:e50617. https://doi.org/10.2196/50617 [PubMed]
- 39. Hwang AC, Lee WJ, Huang N, Chen LY, Peng LN, Lin MH, Chou YJ, Chen LK. Longitudinal changes of frailty in 8 years: comparisons between physical frailty and frailty index. BMC Geriatr. 2021; 21:726. https://doi.org/10.1186/s12877-021-02665-1 [PubMed]
- 40. Verghese J, Ayers E, Sathyan S, Lipton RB, Milman S, Barzilai N, Wang C. Trajectories of frailty in aging: Prospective cohort study. PLoS One. 2021; 16:e0253976. https://doi.org/10.1371/journal.pone.0253976 [PubMed]
- 41. Li CY, Al Snih S, Karmarkar A, Markides KS, Ottenbacher KJ. Early frailty transition predicts 15-year mortality among nondisabled older Mexican Americans. Ann Epidemiol. 2018; 28:362–7.e3. https://doi.org/10.1016/j.annepidem.2018.03.021 [PubMed]
- 42. Barghouth MH, Klein J, Bothe T, Ebert N, Schaeffner E, Mielke N. Social support and frailty progression in community-dwelling older adults. Front Public Health. 2024; 12:1408641. https://doi.org/10.3389/fpubh.2024.1408641 [PubMed]
- 43. Sha S, Xu Y, Chen L. Loneliness as a risk factor for frailty transition among older Chinese people. BMC Geriatr. 2020; 20:300. https://doi.org/10.1186/s12877-020-01714-5 [PubMed]
- 44. Costenoble A, Knoop V, Debain A, Bautmans I, Van Laere S, Lieten S, Rossi G, Verté D, Gorus E, De Vriendt P, and Gerontopole Brussels Study Group. Transitions in robust and prefrail octogenarians after 1 year: the influence of activities of daily living, social participation, and psychological resilience on the frailty state. BMC Geriatr. 2023; 23:485. https://doi.org/10.1186/s12877-023-04178-5 [PubMed]
- 45. Walsh B, Fogg C, Harris S, Roderick P, de Lusignan S, England T, Clegg A, Brailsford S, Fraser SDS. Frailty transitions and prevalence in an ageing population: longitudinal analysis of primary care data from an open cohort of adults aged 50 and over in England, 2006-2017. Age Ageing. 2023; 52:afad058. https://doi.org/10.1093/ageing/afad058 [PubMed]
- 46. Nerobkova N, Park YS, Park EC, Shin J. Frailty transition and depression among community-dwelling older adults: the Korean Longitudinal Study of Aging (2006-2020). BMC Geriatr. 2023; 23:148. https://doi.org/10.1186/s12877-022-03570-x [PubMed]
- 47. Sheng K, Chen H, Qu X. The effects of cognitive leisure activities on frailty transitions in older adults in China: a CHARLS-Based longitudinal study. BMC Public Health. 2024; 24:1405. https://doi.org/10.1186/s12889-024-18889-w [PubMed]
- 48. Cesari M, Gambassi G, van Kan GA, Vellas B. The frailty phenotype and the frailty index: different instruments for different purposes. Age Ageing. 2014; 43:10–2. https://doi.org/10.1093/ageing/aft160 [PubMed]
- 49. Rashmi R, Mohanty SK. Examining chronic disease onset across varying age groups of Indian adults using competing risk analysis. Sci Rep. 2023; 13:5848. https://doi.org/10.1038/s41598-023-32861-5 [PubMed]
- 50. Romera-Liebana L, Orfila F, Segura JM, Real J, Fabra ML, Möller M, Lancho S, Ramirez A, Marti N, Cullell M, Bastida N, Martinez D, Giné M, et al. Effects of a Primary Care-Based Multifactorial Intervention on Physical and Cognitive Function in Frail, Elderly Individuals: A Randomized Controlled Trial. J Gerontol A Biol Sci Med Sci. 2018; 73:1688–74. https://doi.org/10.1093/gerona/glx259 [PubMed]
- 51. Zhao W, Hu P, Sun W, Wu W, Zhang J, Deng H, Huang J, Ukawa S, Lu J, Tamakoshi A, Liu X. Effect of physical activity on the risk of frailty: A systematic review and meta-analysis. PLoS One. 2022; 17:e0278226. https://doi.org/10.1371/journal.pone.0278226 [PubMed]
- 52. Daryanti Saragih I, Yang YP, Saragih IS, Batubara SO, Lin CJ. Effects of resistance bands exercise for frail older adults: A systematic review and meta-analysis of randomised controlled studies. J Clin Nurs. 2022; 31:43–61. https://doi.org/10.1111/jocn.15950 [PubMed]
- 53. Zhang L, Chu C, Zhang Y, Wang M. Association of frailty index with new-onset diabetes: from the China Health and Retirement Longitudinal Study (CHARLS). Acta Diabetol. 2025. [Epub ahead of print]. https://doi.org/10.1007/s00592-024-02441-8 [PubMed]
- 54. He D, Wang Z, Li J, Yu K, He Y, He X, Liu Y, Li Y, Fu R, Zhou D, Zhu Y. Changes in frailty and incident cardiovascular disease in three prospective cohorts. Eur Heart J. 2024; 45:1058–68. https://doi.org/10.1093/eurheartj/ehad885 [PubMed]
- 55. von Elm E, Altman DG, Egger M, Pocock SJ, Gøtzsche PC, Vandenbroucke JP, and STROBE Initiative. Strengthening the Reporting of Observational Studies in Epidemiology (STROBE) statement: guidelines for reporting observational studies. BMJ. 2007; 335:806–8. https://doi.org/10.1136/bmj.39335.541782.AD [PubMed]
- 56. State of Israel. State Health Insurance Act. https://natlex.ilo.org/dyn/natlex2/natlex2/files/download/37205/IRL37205.pdf. 1994.
- 57. Israel Central Bureau of Statistics. Demographic characteristics - definitions and explanations. https://www.cbs.gov.il/en/subjects/Pages/Demographic-Characteristics.aspx. 2024.
- 58. Charlson ME, Pompei P, Ales KL, MacKenzie CR. A new method of classifying prognostic comorbidity in longitudinal studies: development and validation. J Chronic Dis. 1987; 40:373–83. https://doi.org/10.1016/0021-9681(87)90171-8 [PubMed]
- 59. IBM Corp. Released 2021. IBM SPSS Statistics for Windows, Version 28.0. Armonk, NY: IBM Corp See. https://www.ibm.com/support/pages/how-cite-ibm-spss-statistics-or-earlier-versions-spss.