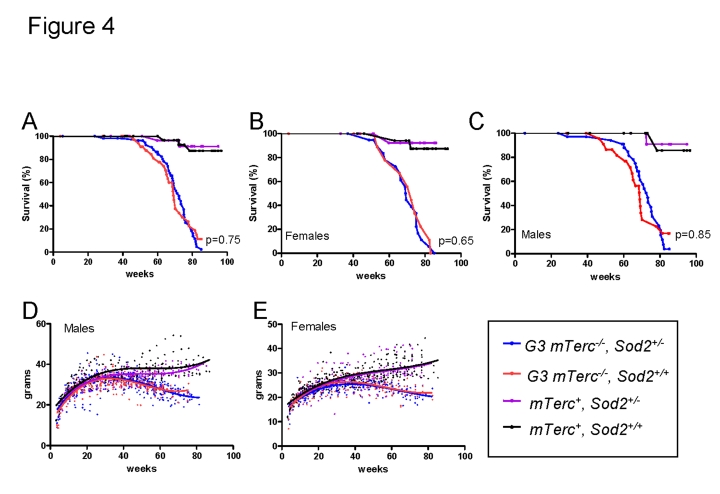
Figure 4.(A)
Kaplan Meyer survival curves for G3 mTerc-/-,
Sod2+/- (n=58); G3 mTerc-/-, Sod2+/+
(n=38); mTerc-/-, Sod2+/-
(n=31)
and mTerc+, Sod2+/+ (n=34). (B)
Survival curves for females G3 mTerc-/-,
Sod2+/- (n=22); G3 mTerc-/-, Sod2+/+
(n=14); mTerc-/-, Sod2+/-
(n=16)
and mTerc+, Sod2+/+ (n=19). (C)
Survival curves for males G3 mTerc-/-,
Sod2+/- (n=36); G3 mTerc-/-, Sod2+/+
(n=24); mTerc-/-, Sod2+/-
(n=15)
and mTerc+, Sod2+/+ (n=15). Dot
blots showing body weight of male (D) and female (E) mice
throughout lifespan in the aging cohorts. Third order polynomial
regression is shown as trendline. All mice were weighed monthly until
death.