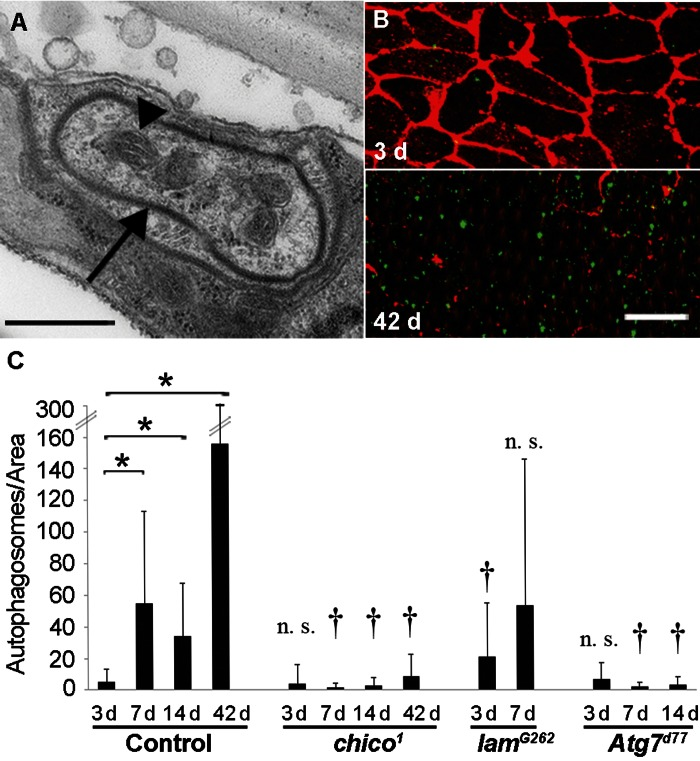
Figure 5.Autophagy Levels Correlate with Epidermal Deterioration(A) TEM of autophagosome (arrow) in 14 d old w1118 epidermis. Bar, 500 nm. Arrow, autophagosome membrane. Arrowhead, Mitochondrion. (B) 3 d (top) and 42 d (bottom) old control (NP2108-GAL4 and UAS-LC3-GFP) epidermal whole mounts labeled with anti-Fasciclin III (red) and LC3-GFP signals amplified with anti-GFP (green). Bar, 20 μm. (C) Quantification of autophagosome numbers (using NP2108-GAL4 and UAS-LC3-GFP) in epidermal whole mounts of the indicated genetic backgrounds. (n ≥ 20 for each time point). Asterisks, statistically significant comparisons (Single-factor Anova test (p < 0.05)) of control time points; Daggers, statistically significant comparisons of mutants versus controls of the corresponding time points; n. s., not significant.