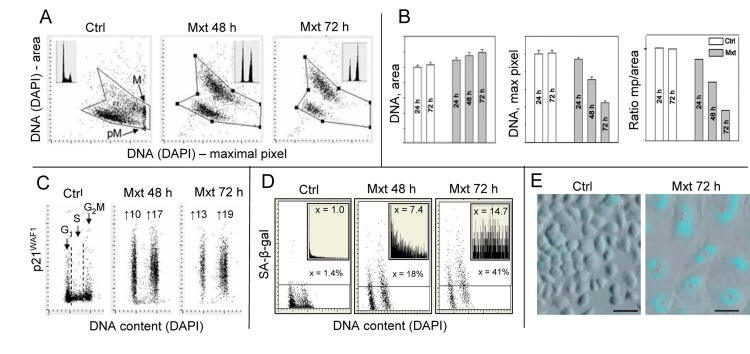
Figure 1.Induction of premature cellular senescence of A549 cells measured by laser scanning cytometryHuman pulmonary non-small cell lung carcinoma A549 were untreated (Ctrl) or treated with 2 nM DNA topoisomerase II inhibitor mitoxantrone (Mxt) for 48 or 72 h. Panel A shows morphometric features of the cells revealed by measurement of nuclear DNA (DAPI) fluorescence reporting on the bivariate distributions (scatterplots) nuclear area versus intensity of maximal pixel of fluorescence, respectively. Intensity of maximal pixel is correlated with chromatin condensation and in the untreated cells has the highest value and marks mitotic (M) and immediately post-mitotic (pM) G1 cells, which also have low value of DAPI area [41]. In the senescing cells, while nuclear area increases, the intensity of maximal pixel decreases [39,40,64]. These morphometric changes reflect enlargement of the projected nuclear area and decreased DAPI local staining per unit area, due to “flattened” cellular appearance, the hallmark of cellular senescence [42,43]. The insets show DNA content frequency histograms of cells from the respective cultures. Panel B: Bar plots reporting mean values (+SD) of nuclear (DNA, DAPI) area, DNA (DAPI) maximal pixel, and ratio of maximal pixel to nuclear area, respectively, of cells from control and Mxt treated cultures. Panel C: Bivariate distributions (DNA content vs p21) reporting expression of p21WAF1 with respect to the cell cycle phase; the figures show the n-fold increase in mean expression of p21 of G1 and G2M cells from the Mxt-treated cultures with respect to respective cells in Ctrl. Panel D: Bivariate distributions of DNA content versus senescence-associated galactosidase (SA-β-gal) activity. Figures indicate percent of SA-β-gal positive (above the threshold marked by the horizontal lines) cells. Insets show the frequency distribution of SA-β-gal positive cells; the figures in insets show the n-fold increase in the mean activity of SA-β-gal in Mxt-treated cultures over Ctrl (1.0). Panel E: Images of cells growing in the absence (left) and presence of 2 nM Mxt for 72 h (right) stained to detect activation of SA-β-gal activity recorded by laser scanning cytometer (Research Imaging Cytometer iCys); 50 μm bars mark the length scale.
Figure 1 — Berberine suppresses gero-conversion from cell cycle arrest to senescence | Aging