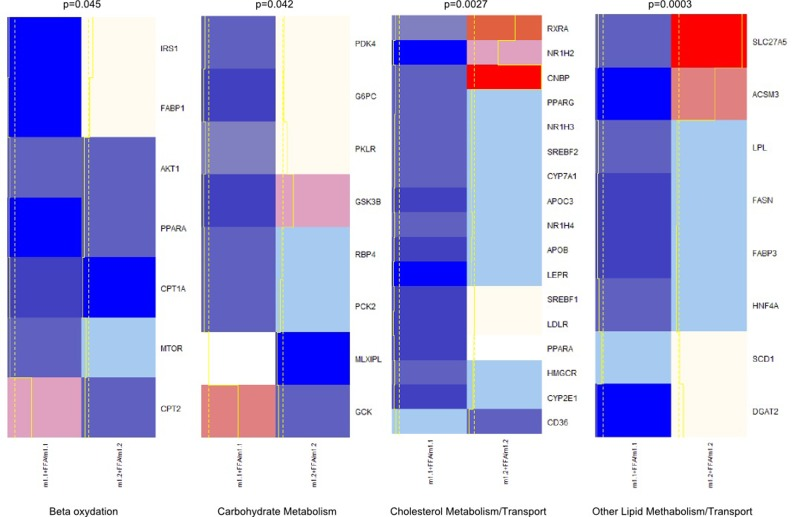
Figure 4.Heatmap and clusters of gene expression of Hepa1-6 cells overexpressing macroH2A1.1 (m1.1) or macroH2A1.2 (m1.2) and treated with FFA. Results are expressed as ratio of FFA-treated versus untreated cells. Optimal clusters have been computed by the pvclust method. Results were grouped in four functional processes (carbohydrate metabolism, beta-oxidation, lipid metabolism, cholesterol transport). Significance levels have been calculated via multiscale bootstrap resampling. The lower p-value of a cluster, the stronger the support of the data for the cluster. Expression levels are represented in a color scale from blue (low expressed) to red (highly expressed) (top left).