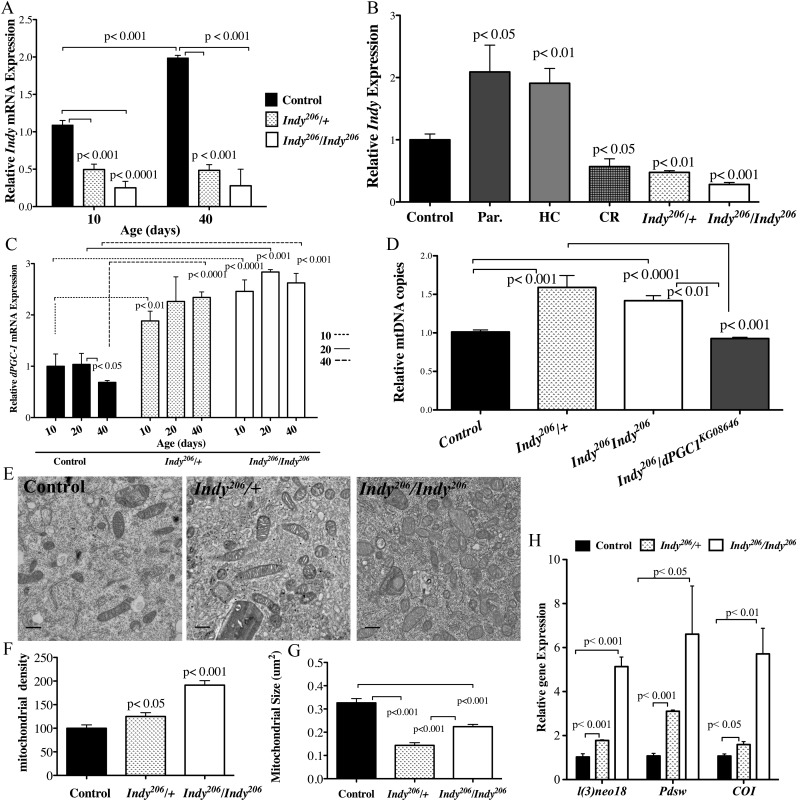
Figure 1.Indy reduction is associated with increased dPGC-1 levels and mitochondrial biogenesis. (A) Indy mRNA levels in the midgut of yw control, Indy206/+ and Indy206/Indy206 female flies at 10 and 40 days determined by qPCR. Controls show an age-related increase in Indy mRNA, which is absent in the mutant midgut (n=3, 25 guts per replicate. p<0.001, p<0.0001, t test, error bars represent SEM). (B) Indy mRNA levels in yw control flies on a regular diet, after overnight exposure to paraquat, HC and CR, and Indy206/+ and Indy206/Indy206 mutant flies at 20 days. Paraquat and HC significantly increases and CR significantly reduces Indy transcript levels in the midgut of control female flies (n=3, 25 guts per replicate p<0.01, p<0.05, p<0.001, error bars represent SEM). (C) dPGC-1 mRNA levels in female yw control, Indy206/+ and Indy206/Indy206 mutant midguts at 10, 20 and 40 days. There is a significant age-related decrease in dPGC-1 mRNA in control flies by 40 days (p <0.05, t test) that is absent in heterozygous and homozygous Indy206 mutants, which show increased dPGC-1 mRNA levels compared to controls at all ages (p<0.01, p<0.001, p<0.0001, t test. n=3, 25 guts per replicate, error bars represent SEM). (D) Mitochondrial (COI) and nuclear (GAPDH) DNA ratio determined by qPCR. Indy206/+ and Indy206/Indy206 mutant females show significant increases in mitochondrial DNA copy number, compared to yw control or Indy206/dPGC-1KG08646 mutant flies (p<0.01, p<0.001, p<0.0001, n=3, 25 guts per replicate) (E) Electron micrographs of control, Indy206/+ and Indy206/Indy206 midguts at 20 days imaged at 10,000x. Scale bar represents 11μm. (F) Mitochondrial density (mitochondrial number/counted cell volume X100) as assessed by point counting in Image J. There is a significant increase in mitochondrial number in Indy206/+ and Indy206/Indy206 mutant midgut tissue at 20 days (p<0.05, p<0.001, t test. n> 25 cells per guts). (G) Indy206/+ and Indy206/Indy206 mutants have significantly smaller mitochondria at 20 days in midgut tissue assessed by point counting in Image J. (p<0.001, n>25 cells per gut). (H) Quantification of l(2)neo, Pdsw encoding components of complex I and Cytochrome C oxidase encoding a component of complex IV are increased in the midgut of Indy206/+ and Indy206/Indy206 mutant flies determined by qPCR. (p<0.05, p<0.01, p<0.001, n=3, 25 guts per replicate).