


Introduction
Caloric restriction (CR) extends lifespan in nearly all species and promotes organismal energy balance by affecting intermediary metabolism and mitochondrial biogenesis [1-4]. Interventions that alter intermediary metabolism are though to extend longevity by preserving the balance between energy production and free radical production [1, 5, 6]. Indy (I'm Not Dead, Yet) encodes a plasma membrane protein that transports Krebs' cycle intermediates across tissues associated with intermediary metabolism [7-10]. Reduced Indy–mediated transport extend longevity in worms and flies by decreasing the uptake and utilization of nutrients and altering intermediate nutrient metabolism in a manner similar to CR [6, 8, 10-14]. Furthermore, it was shown that caloric content of food directly affects Indy expression in fly heads and thoraces, suggesting a direct relationship between INDY and metabolism [14].
dPGC-1/spargel is the Drosophila homolog of mammalian PGC-1, a transcriptional co-activator that promotes mitochondrial biogenesis by increasing the expression of genes encoding mitochondrial proteins [15, 16]. Upregulation of dPGC-1 is a hallmark of CR-mediated longevity and is thought to represent a response mechanism to compensate for energetic deficits caused by limited nutrient availability [2, 16]. Increases in dPGC-1 preserve mitochondrial functional efficiency without consequential changes in ROS. Previous analyses of Indy mutant flies revealed upregulation of mitochondrial biogenesis mediated by increased levels of dPGC-1 in heads and thoraces [6].
Recently, dPGC-1 upregulation in stem and progenitor cells of the digestive tract was shown to preserve intestinal stem cell (ISC) proliferative homeostasis and extend lifespan [17]. The Drosophila midgut is regenerated by multipotent ISCs, which replace damaged epithelial tissue in response to injury, infection or changes in redox environment [18-22]. Low levels of reactive oxygen species (ROS) maintain stemness, self-renewal and multipotency in ISCs; whereas, age-associated ROS accumulation induces continuous activation marked by ISC hyper-proliferation and loss of intestinal integrity [18].
Here we describe a role for Indy as a physiological regulator that modulates expression in response to changes in nutrient availability. This is illustrated by altered Indy expression in flies following changes in caloric content and at later ages suggesting that INDY-mediated transport is adjusted in an effort to meet energetic demands. Further, we characterized role for dPGC-1 in mediating the downstream regulatory effects of INDY reduction, such as the observed changes in Indy mutant mitochondrial physiology, oxidative stress resistance and reduction of ROS levels. Longevity studies support a role for dPGC-1 as a downstream effector of Indy mutations as shown by overlapping longevity pathways and absence of lifespan extension without wild-type levels of dPGC-1. Our findings show that Indy mutations affect intermediary metabolism to preserve energy balance in response to altered nutrient availability, which by affecting the redox environment of the midgut promotes healthy aging.
Results
Aging increases Indy mRNA levels in the midgut of control flies
In Drosophila, INDY is predominantly expressed in the basolateral membrane of the midgut epithelia, fat body and oenocytes [10]. To identify a relationship between Indy expression and aging in midgut tissue, we measured Indy mRNA levels in control yellow-white (yw) flies at 10 and 40 days. Indy transcript levels increase by approximately 89% in female yw flies, whereas Indy206/+ and Indy206/Indy206 mutants show decreased Indy mRNA levels at all ages following 10 generations of backcrossing into yw background (Fig. 1A, S1A). Consistently, exposure to 20 mM paraquat, an agent known to induce free radical production and mimic aging, upregulates Indy mRNA and protein levels in young control flies to levels similar to those that are observed in aged flies (Fig. 1B, S1B, S1C) [5, 19].
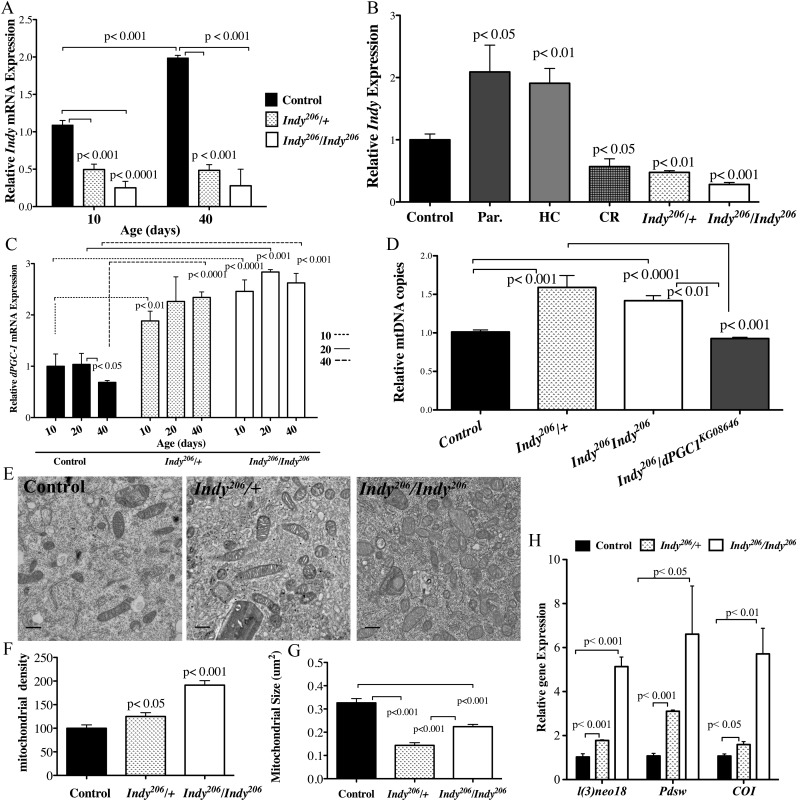
Figure 1. Indy reduction is associated with increased dPGC-1 levels and mitochondrial biogenesis. (A) Indy mRNA levels in the midgut of yw control, Indy206/+ and Indy206/Indy206 female flies at 10 and 40 days determined by qPCR. Controls show an age-related increase in Indy mRNA, which is absent in the mutant midgut (n=3, 25 guts per replicate. p<0.001, p<0.0001, t test, error bars represent SEM). (B) Indy mRNA levels in yw control flies on a regular diet, after overnight exposure to paraquat, HC and CR, and Indy206/+ and Indy206/Indy206 mutant flies at 20 days. Paraquat and HC significantly increases and CR significantly reduces Indy transcript levels in the midgut of control female flies (n=3, 25 guts per replicate p<0.01, p<0.05, p<0.001, error bars represent SEM). (C) dPGC-1 mRNA levels in female yw control, Indy206/+ and Indy206/Indy206 mutant midguts at 10, 20 and 40 days. There is a significant age-related decrease in dPGC-1 mRNA in control flies by 40 days (p <0.05, t test) that is absent in heterozygous and homozygous Indy206 mutants, which show increased dPGC-1 mRNA levels compared to controls at all ages (p<0.01, p<0.001, p<0.0001, t test. n=3, 25 guts per replicate, error bars represent SEM). (D) Mitochondrial (COI) and nuclear (GAPDH) DNA ratio determined by qPCR. Indy206/+ and Indy206/Indy206 mutant females show significant increases in mitochondrial DNA copy number, compared to yw control or Indy206/dPGC-1KG08646 mutant flies (p<0.01, p<0.001, p<0.0001, n=3, 25 guts per replicate) (E) Electron micrographs of control, Indy206/+ and Indy206/Indy206 midguts at 20 days imaged at 10,000x. Scale bar represents 11μm. (F) Mitochondrial density (mitochondrial number/counted cell volume X100) as assessed by point counting in Image J. There is a significant increase in mitochondrial number in Indy206/+ and Indy206/Indy206 mutant midgut tissue at 20 days (p<0.05, p<0.001, t test. n> 25 cells per guts). (G) Indy206/+ and Indy206/Indy206 mutants have significantly smaller mitochondria at 20 days in midgut tissue assessed by point counting in Image J. (p<0.001, n>25 cells per gut). (H) Quantification of l(2)neo, Pdsw encoding components of complex I and Cytochrome C oxidase encoding a component of complex IV are increased in the midgut of Indy206/+ and Indy206/Indy206 mutant flies determined by qPCR. (p<0.05, p<0.01, p<0.001, n=3, 25 guts per replicate).
To investigate the relationship between Indy mRNA and nutrient availability in the midgut, we measured Indy mRNA levels in female yw control, Indy206/+ and Indy206/Indy206 flies on a normal, high caloric (HC) and CR diets at 20 days. Indy mRNA levels nearly doubled in yw flies on a HC diet, whereas a 50% reduction in transcript was observed in both yw flies on a CR diet and Indy206/+ flies on a regular diet (Fig. 1B). Diet-induced changes in Indy mRNA levels support a role for Indy as a physiological regulator, whose expression changes to modulate intermediate metabolism in response to nutrient availability.
Indy reduction is associated with increased dPGC-1 levels in the midgut
dPGC-1 increases mitochondrial biogenesis in response to CR and decreases as a consequnce of normal aging [2, 3, 6, 7, 16]. Consistently, we found a significant age-related decrease in dPGC-1 mRNA levels in the midgut of yw females between 20 and 40 days (Fig. 1C). Our observation that Indy levels decrease in response to CR (Fig. 1B), led us to investigate whether INDY reduction is sufficient to upregulate dPGC-1 in the fly midgut and rescue the age-associated decline in expression levels. We found significantly higher dPGC-1 mRNA levels compared yw controls at all ages in both Indy206/+ and Indy206/Indy206 mutant females, with a similar increase observed in Indy206/+ male flies at age 40 (Fig. 1C, S2A). This trend is consistent through out lifespan, as demonstrated by the absence of any age-associated changes in both Indy and dPGC-1 mRNA levels in Indy mutant midguts (Fig. 1A, 1C).
To further examine the relationship between Indy and dPGC-1 mRNA levels, we used the TIGS2-geneswitch driver (TIGS2-GS) to drive gut specific Indy-RNAi mediated silencing. dPGC-1 mRNA levels increase in response to a small reduction of Indy mRNA levels in the midguts of TIGS2-GS; Indy-RNAi male and female flies at 20 days (Fig. S2B-E). Together, these data suggest that there is an inverse relationship between Indy and dPGC-1 mRNA levels in the midgut.
Reduced Indy increases dPGC-1 medited mitochondrial biogenesis
We next examined whether dPGC-1 upregulation in the midgut of Indy mutant flies was sufficient to increase mitochondrial biogenesis by measuring mitochondrial density. The ratio of mitochondrial DNA to nuclear DNA in the midgut of Indy206/+ and Indy206/Indy206 mutant flies is significantly increased compared to control at 40 days (Fig. 1D). Using double mutant flies with the Indy206 mutant allele and a hypomorphic dPGC-1 allele (Indy206/dPGC-1KG08646), we determined that the observed increase in mitochondrial DNA copy number, which depends on increased dPGC-1 levels. These flies have mitochondrial DNA copy numbers similar to those observed in control flies at 40 days (Fig. 1D). Increased mitochondrial biogenesis in enterocytes residing in the anterior midgut of Indy mutant was confirmed by electron microscopy and the point counting method. Enterocytes comprise ~90% of the midgut cell populations; therefore thery represent the majority of cell types and can be used to indicate overal mitochondrial density in the midgut. Electron micrographs of Indy206/+ and Indy206/Indy206 mutant midgut tissue show a clear increase in mitochondrial density and significantly smaller size by 20 days compared to controls (Fig. 1E-G).
In addition to higher mitochondrial biogenesis, Indy206/+ and Indy206/Indy206 female midguts have increases in mitochondrial electron transport chain complex I (ETC) gene expression (Figure 1H). While l(3)neo18 and Pdsw mRNA levels are elevated in both Indy206/+ and Indy206/Indy206, we also observed significant increases in ND23, ND42, ND75 mRNA levels in the midgut of Indy206/Indy206 mutant flies by 20 days (Fig. S2F). Furthermore, mRNA levels of ETC complex IV component, Cytochrome C oxidase I (COI), were also significantly increased in aged Indy206/+ and Indy206/Indy206 female flies (Fig. 1H).
Indy mutants have enhanced mitochondrial activity and reduced ROS levels in the midgut
High mitochondrial membrane potential is associated with preserved mitochondrial physiology and efficiency. We determined the status of mitochondrial membrane potential in Indy206/+ and Indy206/Indy206 mutant midgut tissue by using positively charged JC-1, which fluoresces green as a monomer in cytoplasm but forms red aggregates upon entering the mitochondrial matrix as a result of high membrane potential. The red:green ratio in aged Indy mutant midguts is significantly greater in both Indy206/+ and Indy206/Indy206 mutants compared to controls (Fig 2A,B). Moreover, the ratio for Indy206/dPGC-1KG08646 double mutants is strikingly similar to that observed in controls suggesting that dPGC-1 mediates changes in mitochondrial physiology observed in Indy mutants (Fig. 2A,B).
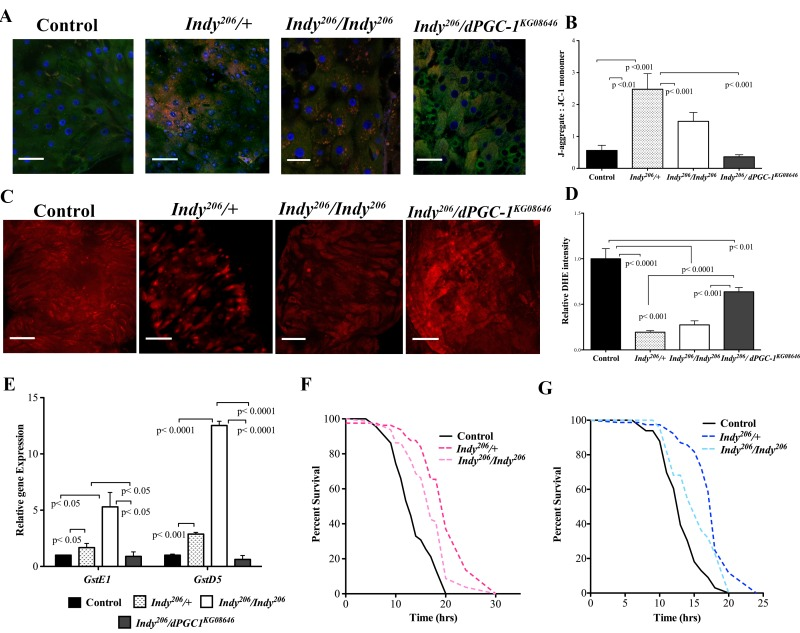
Figure 2. Indy mutants have reduced ROS levels and increased oxidative stress resistance. (A) Visualization of JC-1 dye in female yw control, Indy206/+, Indy206/Indy206 and Indy206/dPGC-1KG08646 mutant flies at 40 days. Indy mutant flies show increased mitochondrial membrane potential compared to controls and Indy206/dPGC-1KG08646 mutants. Scale bar represents 1μm (B) Ratio of red JC-aggregates to green JC-1 monomer. Indy206/+ and Indy206/Indy206 mutant flies have increased mitochondrial membrane potential shown by increased red:green JC-1 ratiocompared to control and Indy206/dPGC-1KG08646 mutants (p<0.01, p<0.001, n>10 guts per genotype, compared by Mann-Whitney U test) (C) Positive DHE staining for ROS in compressed Z-stack of female control, Indy206/+, Indy206/Indy206 and Indy206/dPGC-1KG08646 mutant midgut flies at 40 days. Scale bar represents 1μm. (D) Mean DHE intensity in compressed Z-stack of female control, Indy206/+, Indy206/Indy206 and Indy206/dPGC-1KG08646 mutant midguts at 40 days. (p<0.001, p<0.0001, n>15 guts per genotype; Scale bar represents 1μm). (E) Levels of GstE1 and GstD5 mRNA in female yw control, Indy206/+, Indy206/Indy206 and Indy206/dPGC-1KG08646 mutant midgut tissue determined by qPCR. There is a significant increase (p<0.05, p<0.001, p< 0001 n=3, 25 guts per replicate) in levels of both gene mRNA levels in Indy206 mutant midgut tissue at 20 days compared to control and Indy206/dPGC-1KG08646. Survival curves for female (F) and male (G) yw control, Indy206/+ and Indy206/Indy206 flies on 20mM paraquat. Indy206 mutants have increased resistance to oxidative stress compared to control.
Increased levels of mitochondrial ROS production and oxidative damage are associated with decreased mitochondrial function and considered hallmarks of aging across species [2, 4, 23, 24]. Dihydroethidium (DHE) fluoresces red when it reacts with superoxide and was used to measure changes in the total redox environment in the midgut of female Indy206 mutants, Indy206/dPGC-1KG08646 double mutants and control flies at 40 days. Both Indy206/+ and Indy206/Indy206 mutants had significantly decreased red fluorescence when compared to controls indicating lower levels of ROS (Fig. 2C,D). Indy206/dPGC-1KG08646 show partial protection against ROS accumulation as shown by intermediate levels of DHE intensity, which is likely due to the effects of Indy reduction on the wild-type copy of dPGC-1 (Fig. 2D).
Indy mutant flies have increased resistance to oxidative stress
We next examined whether Indy mutations affect fly oxidative stress resistance. ROS-detoxification factors Glutathione S transferase E1 (GstE1) and Glutathione S transferase D5 (GstD5) mRNA were significantly increased in Indy206/+ and Indy206/Indy206 mutant midgut tissue at 40 days compared to yw controls (Fig. 2E). Levels were not significantly altered in Indy206/dPGC-1KG08646 flies compared to controls, suggesting that both copies of wild type dPGC-1 are necessary to modulate ROS detoxification in Indy mutants (Fig. 2E). Additionally, male and female Indy206 mutant flies have increased oxidative stress resistance when exposed to 20 mM paraquat compared to yw controls at 20 days (Fig. 2F, 2G, Table S1). Increased resistance in Indy206/+ flies compared to Indy206/Indy206 flies can be atributed to enhanced mitochondrial physiology and decreased ROS levels found in Indy206/+(Fig. 2A-2E).
Indy mutations preserve ISC homeostasis and intestinal integrity
Robust INDY expression in the midgut suggests that transporting metabolites across the midgut epithelia is one of the main functions of INDY. The midgut is maintained by multipotent ISCs, which divide asymmetrically giving rise to an identical daughter ISC and an immature progenitor enteroblast cell (EB) with differentiation potential. Elevated levels of ROS disrupt ISC proliferation patterns by inducing division at a rate that surpasses EB differentiation, which leads to accumulation of polyploid aggregates, decreased intestinal integrity and accelerated mortality [5, 17, 18, 25]. The effect of decreased Indy expression on intestinal homeostasis was examined using the IndyYC0030 mutant fly line, which has a fluorescent protein (GFP) tag inserted in the Indy gene region and was backcrossed 10 generations into the yw background [26]. IndyYC0030/+ mutant flies have reduced Indy transcript in the midgut at levels similar to those observed in Indy206/+ mutants. These flies also demonstrate significant longevity extension, with a 58.3% and 42.2% increases in median life span in males and females, respectively (Fig. S3A-D, Table S2).
Both the ISC and the progenitor EB express the transcription factor escargot (esg); therefore esg- positive cells represent undifferentiated cells [20, 21]. The number of undifferentiated cells in the midgut was assessed using esgLacZ flies, which express βgal under an esg reporter and were backcrossed 10 generations into the yw genetic background. Quantification of βgal-positive cells in aging male and female control esgLacZ/+ and esgLacZ;IndyYC0030/+ mutant midgut tissue show significantly fewer βgal-positive cells in IndyYC0030/+ flies compared to control flies at 40 days (Fig. 3A,B, S4A,B).
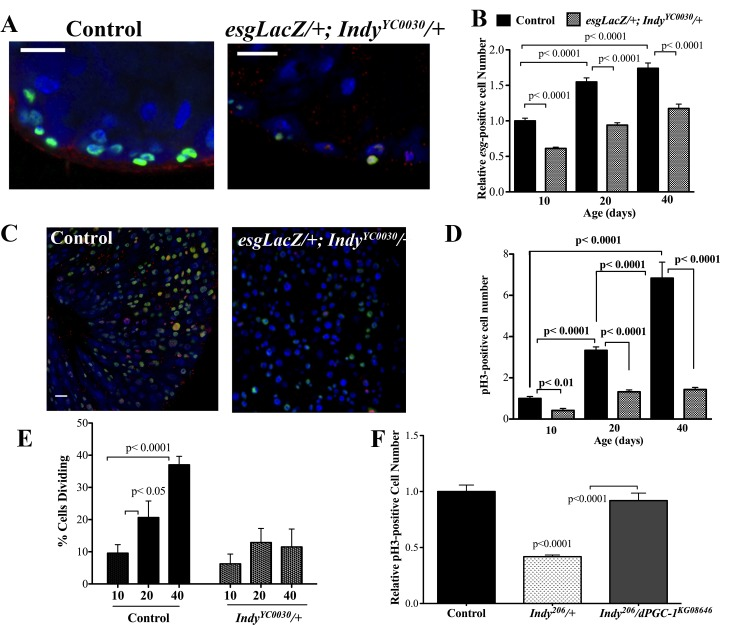
Figure 3. Indy mutations preserve ISC homeostasis. (A) Immunostaining for INDY (red) DAPI (blue nuclear) and β-galactosidase (green) in the midgut of female control (esgLacZ/+) and Indy mutant (esgLacZ;IndyYC0030/+) flies at 20 days at 40X. Scale bar represents 1μm. (B) Quantification shows reduced number of esg-positive cells in the esgLacZ; IndyYC0030/+ mutant female midgut throughout lifespan (p<0.0001, n>20). (C) Immunostaining for β-galactosidase activity (green), nuclear (blue) and pH3-positive cells (red) in control (esgLacZ/+) and the Indy mutant (esgLacZ/+;IndyYC0030/+) midgut tissue at 40 days. β-gal- positive cells represent ISC/EB populations and pH3-positive cells represent dividing cells. Scale bar represents 1μm. (D) Quantification of pH3-positive cells in the midgut of control (esgLacZ/+) and Indy (esgLacZ;IndyYC0030/+) mutant flies. There is increased cell division in female control midgut tissue throughout lifespan that is largely absent in esgLacZ; IndyYC0030/+ mutant females (p<0.01, p<0.0001, n>20). Error bars represent SEM. (E) Quantification of dividing cells in the midgut determined by the presence of pH3-positive immunostaining. There is increased cell division in female control midgut tissue throughout lifespan that is largely absent in esgLacZ; IndyYC0030/+ mutant females (p<0.05, p<0.0001, n>20). Error bars represent SEM. See Figures S4, S5 and Table S2. (F) Quantification of pH3- postive cells in the midgut of yw control, Indy206/+ mutant and Indy206/+/dPGC-1KG08646 female flies at 40 days. There are reduced dividing cells in the midgut of Indy mutant flies compared to control and Indy206/dPGC-1KG08646 midgut (p<0.0001, n>15). Error bars represent SEM.
Phosphorylation of histone 3 (pH3) occurs during mitosis and marks active cell proliferation [27]. esgLacZ;IndyYC0030/+ mutant flies have significantly fewer pH3-positive cells in midgut tissue compared to control esgLacZ/+ flies at 40 days (Fig. 3C,D, S4B). Moreover, the number of pH3-positive cells is steady from 20-40 days in Indy mutant flies, indicating preserved ISC proliferative homeostasis (Fig. 3E). Using double mutant Indy206/dPGC-1KG08646 flies, we determined that two copies of dPGC-1 are required to maintain low numbers of pH3-positive cells in aged Indy206 mutants. Unlike Indy206/+ mutants, double mutant Indy206/dPGC-1KG08646 midguts have significantly more pH3-positive cells, suggesting dPGC-1 mediates downstream effect of Indy reduction (Fig. 3F).
ISCs maintain intestinal architecture by replacing damaged cells that comprise the barrier between lumen and hemolymph in the midgut. Age-related accumulation of aggregates and regions of disjoined cells compromises intestinal integrity and can be observed in the midgut of control flies; however, Indy206/Indy206 midguts retain cellular architecture (Fig. 4A,B). To assess the state of intestinal integrity in aged Indy mutants, we added 2.5% w/v non-absorbable FD&C blue dye #1 to fly food and quantified the percentage of flies displaying total tissue staining [17]. About 40% of aged controls show loss of intestinal integrity as measured by total staining throughout the body after feeding (Fig. 4C). In contrast, only about 10% of Indy206/+ and Indy206/Indy206 mutant flies were completely blue, with most retaining blue dye in the digestive tract and proboscis similarly to young flies (Fig. 4C). Furthermore, we observed about 30% of Indy206/dPGC-1KG08646 flies with total blue staining, which further supports a role for dPGC-1 as a downstream mediator of beneficial effects of Indy mutations.
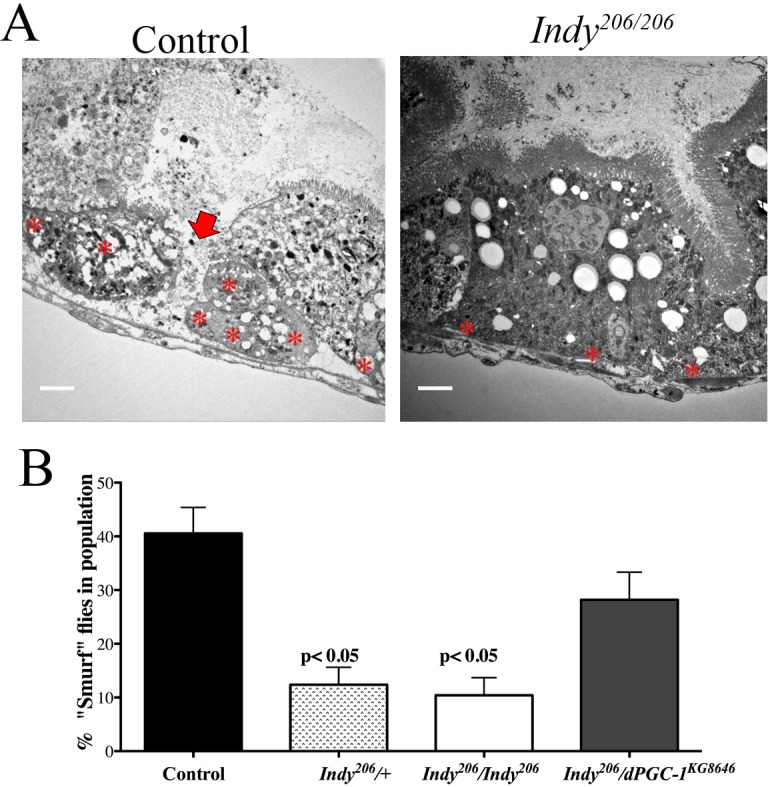
Figure 4. Indy mutations preserve intestinal integrity. (A) Electron micrograph of yw control (left) and Indy206/Indy206 (right) midgut imaged at 1000x. Arrow shows damaged tissue and asterisks mark ISCs. Scale bar represents 1 μm. (B) Quantitative analysis of blue staining of female control and Indy206/Indy206 flies fed food containing 2.5% w/v FD&C blue dye for 150 minutes at 40 days. Blue coloring throughout body indicates loss of intestinal integrity. Control and Indy206/dPGC-1KG08646 flies have a significantly higher number of blue flies compared to Indy206/+ and Indy206/Indy206 mutants (p<0.01, n>50).
Indy-longevity is mediated by dPGC-1
Decreased Indy expression and restricted upregulation of dPGC-1 in midgut stem and progenitor cells extends lifespan in flies [12, 13, 17]. As described above, Indy mutants have significantly increased dPGC-1 mRNA levels in the midgut throughout lifespan (Fig. 1C); therefore we investigated whether these two longevity pathways share a similar mechanism. We used the esgGAL4/UASdPGC-1(SpargelEY05931) system to overexpress dPGC-1 in stem and progenitor cells of the digestive tract [17, 28]. To avoid any effects of genetic background, all flies were backcrossed to yw background for 10 generations. Although esgGal4 is also expressed in stem cells of malpighian tubules, the testis and in salivary glands, we focus our attention on the effects of overexpressing dPGC-1 on midgut physiology due to its importance in healhy aging [25]. We censored the first 9 days following eclosion to reduce the influence of early, non-age associated death on longevity studies. Female and male esgGal4;UAS-dPGC1 flies have increased median lifespan by 19.9% and 35.1%, respectively, compared to control esgGal4/yw flies (Fig. 5A,B, Table 3). If Indy and dPGC-1 longevity pathways overlap, we would not expect that overexpression of dPGC-1 in esg-positive cells of Indy206 mutant flies (esgGal4;Indy206/UAS-dPGC-1) to further extend longevity of Indy mutant flies. Compared to controls, these flies have median lifespan extension of 27.7% and 40.6%, in females and males, respectively. As predicted, they do not experience additional increase in lifespan compared to esgGal;UAS-dPGC-1 (Fig. 5A,B, S5A, Table 3).
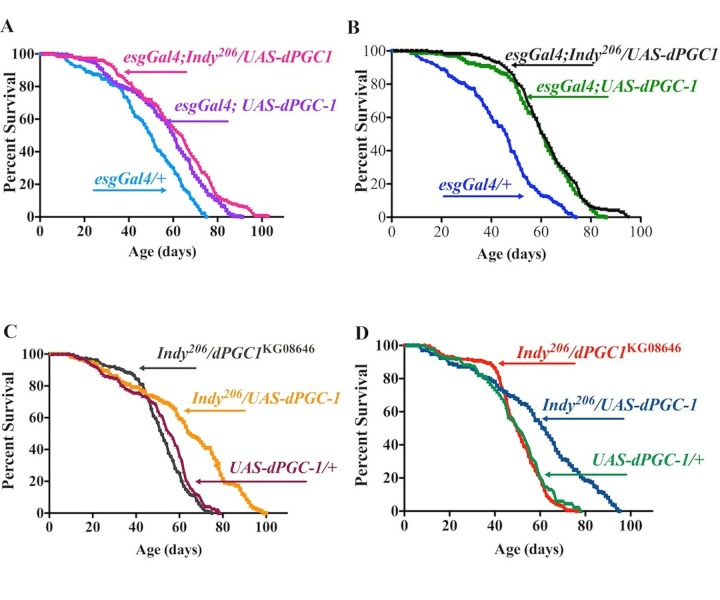
Figure 5. Indy and dPGC-1 longevity pathways overlap. (A) Lifespan curves of female esgGal4;Indy206/UAS-dPGC1 (magenta), esgGal4;UAS-dPGC-1 (purple) and genetic controls (esgGal4/+) (blue) flies. esgGal4;UAS-dPGC-1 females overexpressing dPGC-1 in esg-positive cells, and Indy mutant females with dPGC-1 overexpression in the esg-positive cells have 19.9%, and 27.7% increase in median longevity compared to genetic controls (esgGal4/+) flies, respectively. (B) Lifespan curves of male esgGal4;Indy206/UAS-dPGC1 (black), esgGal4;UAS-dPGC-1 (green) and genetic controls (esgGal4/+) (blue). esgGal4;UAS-dPGC-1 males overexpressing dPGC-1 in esg-positive cells, and Indy mutant male with dPGC-1 overexpression in the esg-positive cells have 35.1% and 40.6% increase in median longevity compared to genetic controls (esgGal4/+), respectively. (C) Lifespan curves of female Indy206 mutants with a hypomorphic allele for dPGC-1 (esgGal4;Indy206/UAS-dPGC1) (gray), Indy mutant flies with one copy of the dPGC-1UAS construct (esgGal4;Indy206/UAS-dPGC1) (yellow) and genetic controls (UAS-dPGC1/+) (maroon). esgGal4;Indy206/UAS-dPGC1 flies show similar longevity compared to controls and esgGal4;Indy206/UAS-dPGC1 females show 22.5% median longevity extension. (D) Lifespan curves of male Indy206 mutant with a hypomorphic allele for dPGC-1 (esgGal4;Indy206/UAS-dPGC1) (red), Indy mutant flies with one copy of the dPGC-1UAS construct (esgGal4;Indy206/UAS-dPGC1) (blue) and genetic controls (UAS-dPGC1/+) (green). esgGal4;Indy206/UAS-dPGC1 flies show similar longevity compared to controls and esgGal4;Indy206/UAS-dPGC1 males show 23.5% median longevity extension. See Figure S6, Table 3. n>170 for all lifespan studies.
Flies heterozygous for the Indy206 allele with one copy of the UAS-dPGC-1 construct (Indy206/UAS-dPGC-1) have median lifespan extension compared to the survivorship of UAS-dPGC-1/yw flies with 22.5% and 23.5% increases in female and male flies respectively (Fig. 5C, D, Table 3). Furthermore longevity extension was not observed in double mutant Indy206/dPGC-1KG08646 flies compared to genetic control (UAS-dPGC-1/yw) and was signifcantly shorter compared to Indy206/UAS-dPGC-1, suggesting that the longevity extension observed in Indy206 mutant flies with one copy of Indy206 chromosome, is most likely mediated by increased levels of dPGC-1 (Fig. 5C, D, Table 3). This conclusion is supported by findings that dPGC-1 mRNA levels found in the midgut of Indy mutant flies are the same as those found in flies overexpressing dPGC-1 in esg-positive cells in Indy mutants or flies with wild type INDY (Fig. S5). Together, the data support a model for Indy-mediated longevity that is mediated by downstream activation of dPGC-1 and its effect on mitochondrial physiology.
Discussion
Reduction of Indy gene activity in fruit flies, and homologs in worms, extends lifespan by altering energy metabolism in a manner similar to CR [6-8, 11-14]. Indy mutant flies on regular food share many characteristics with CR flies and do not have further longevity extension when aged on a CR diet [14, 29, 30]. Furthermore, mINDY−/− mice on regular chow share 80% of the transcriptional changes observed in CR mice, supporting a conserved role for INDY in metabolic regulation that mimics CR and promotes healthy aging [7]. In this study we shifted from systemic to the tissue specific effects of INDY reduction, focusing on the midgut due to the high levels of INDY protein expression in wild type flies and the importance of regulated intestinal homeostasis during aging. Our evidence supports a role for INDY as a physiological regulator that senses changes in nutrient availability and alters mitochondrial physiology to sustain tissue-specific energetic requirements.
We show an age-associated increase in midgut Indy mRNA levels that can be replicated by manipulations that accelerate aging such as increasing the caloric content of food or exposing flies to paraquat. Conversely, we show that CR decreases Indy mRNA in control midgut tissues, which is consistent with previous findings in fly muscle and mouse liver [7, 14]. Diet-induced variation in midgut Indy expression suggests that INDY regulates intermediary metabolism by modifying citrate transport to meet tissue or cell-specific bioenergetic needs. Specifically, as a plasma membrane transporter INDY can regulate cytoplasmic citrate, thereby affecting fat metabolism, respiration, and via conversion to malate, the TCA cycle. Recent reports show that pluripotent stem cells use intermediate metabolites, from the TCA cycle, such as citrate, to propagate proliferation [31, 32]. Reduced INDY-mediated transport activity in the midgut could prevent age-related ISC-hyperproliferation by decreasing the available energy needed to initiate proliferation, thereby preserving tissue function during aging (Fig. 6). This is supported by findings that nutrient availability affects ISC proliferation in adult flies and that CR can affect stem cell quiescence and activation [19, 33].
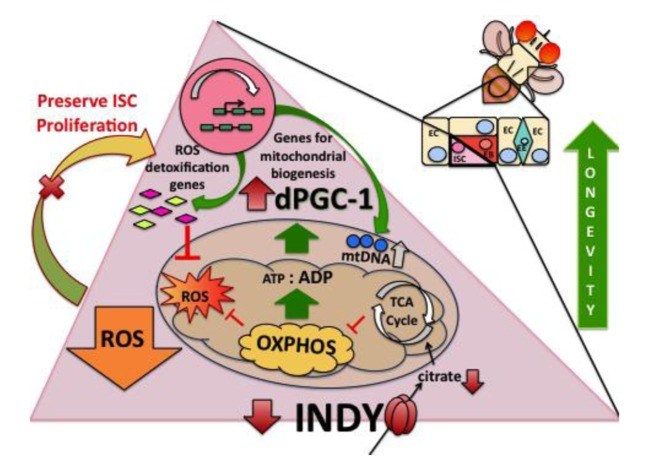
Figure 6. Indy mutations preserve ISC homeostasis. INDY transports citrate from hemolymph into the cells and vice versa. Cytoplasmic citrate can be transported to mitochondria and used as a substrate for the TCA cycle. Reduced INDY-mediated transport decreases citrate levels and decreases the ATP/ADP ratio. Such changes activate AMPK, promoting fat oxidation and dPGC-1 synthesis. The increase in dPGC-1 activity increases mitochondrial biogenesis and transcription of ROS-detoxification genes. Decreased ROS production preserves ISC homeostasis, which contributes to Indy mediated longevity extension.
One of the hallmarks of CR-mediated longevity extension is increased mitochondrial biogenesis mediated by dPGC-1 [1-3]. Increased dPGC-1 levels and mitochondrial biogenesis have been described in the muscle of Indy mutant flies [6], the liver of mIndy−/− mice [7], and here we describe it in the midgut of Indy mutant flies. One possible mechanism for these effects can be attributed to the physiological effects of reduced INDY transport activity. Reduced INDY-mediated transport activity could lead to reduced mitochondrial substrates, an increase in the ADP/ATP ratio, activation of AMPK, and dPGC-1 synthesis. This is consistent with findings in CR flies and the livers of mINDY−/− mice. Our analysis of mitochondrial physiology in the Indy mutant midgut shows upregulation of respiratory proteins, maintenance of mitochondrial potential and increased mitochondrial biogenesis, all of which are signs of enhanced mitochondrial health [4]. The observed increase in dPGC-1 levels in Indy mutant midgut therefore appears to promote mitochondrial biogenesis and functional efficiency, representing a protective mechanism activated in response to reduced energy availability.
Genetic interventions that conserve mitochondrial energetic capacity have been shown to maintain a favorable redox state and regenerative tissue homeostasis [17, 18, 34, 35]. This is particularly beneficial in the fly midgut, which facilitates nutrient uptake, waste removal and response to bacterial infection. Indy mutant flies have striking increases in the steady-state expression of the GstE1 and GstD5 ROS detoxification genes. As a result, any increase in ROS levels, whether from mitochondrial demise or exposure to external ROS sources can be readily metabolized to prevent accumulation of oxidative damage. Such conditions not only promote oxidative stress resistance, but also preserve ISC homeostasis as demonstrated by consistent proliferation rates throughout Indy mutant lifespan and preserved intestinal architecture in aged Indy mutant midguts. Thus, enhanced ROS detoxification mechanisms induced by Indy reduction and subsequent elevation of dPGC-1 contributes to preservation of ISC functional efficiency, and may be a contributing factor to the long-lived phenotype of Indy mutant flies.
Several lines of evidence indicate that INDY and dPGC-1 are part of the same regulatory network in the midgut, in which dPGC-1 functions as a downstream effector of INDY. The similarity between dPGC-1 mRNA levels and survivorship of flies overexpressing dPGC-1 in esg-positive cells and Indy mutant flies suggests that Indy and dPGC-1 interact to extend lifespan. This is further supported by the lack of additional longevity extension when dPGC-1 is overexpressed in esg-positive cells of Indy mutant flies. Moreover, hypomorphic dPGC-1 flies in an Indy mutant background are similar to controls with respect to life span, declines in mitochondrial activity and ROS-detoxification. Together, these data suggest that dPGC-1 must be present to mediate the downstream physiological benefits and lifespan extension of Indy mutant flies.
There are some physiological differences between the effects of Indy mutation and dPGC-1 overexpression in esg-positive cells [17]. While Indy mutant flies are less resistant to starvation and more resistant to paraquat, a recent report showed that overexpressing dPGC-1 in esg-positive cells has no effect on resistance to starvation or oxidative stress [14, 17]. Additionally, mice lacking skeletal muscle PGC-1α were found to lack mitochondrial changes associated with CR but still showed other CR-mediated metabolic changes [36]. In the fly INDY is predominantly expressed in the midgut, fat body and oenocytes, though there is also low level expression in the malpighian tubules, salivary glands, antenae, heart and female follicle cell membranes. Thus, the effects of INDY on intermediary metabolism and longevity could be partially independent from dPGC-1 or related to changes in tissues other than the midgut.
Our studies suggest that INDY may function as a physiological regulator of mitochondrial function and related metabolic pathways, by modulating nutrient flux in response to nutrient availability and energetic demands. Given the localization of INDY in metabolic tissues, and importance of regulated tissue homeostasis during aging, these studies highlight INDY as a potential target to improved health and longevity. Reduced Indy expression causes similar physiological changes in flies, worms and mice indicating its regulatory role would be conserved. Further work should examine the interplay between Indy mutation and metabolic pathways, such as insulin signaling, which have been shown to promote stem cell maintenance and healthy aging in flies and mice [25, 35, 37]. In doing so, the molecular mechanisms, which underlie Indy mutant longevity may provide insight for anti-aging therapies.
Methods
Fly Strains
The IndyYC0030 line was obtained from Lynn Cooley [26]. The esgGal4 (y1w;esgGAL4/Cyo)(#26816), esgLacZ (y1w67c23;esgLacZ/Cyo) (#10359), UAS-dPGC-1 (yw; Spargel EY05931) (#2009), y1;P{SUPor-P}SpargelKG08646ry506/TM3,Sb1Ser1(#14965) and yellow-white (yw) flies were obtained from the Bloomington Stock Center at Indiana University. The Indy206 line was obtained from Tim Tully [38]. The TIGS-2 Gene-Switch driver line was provided by Scott Pletcher and the UAS-IndyRNAI (w1118;P{GD2712}v9981) line was obtained from the Vienna Drosophila RNAi Center [39].
Fly Maintenance and Lifespan Studies
Flies were collected within 24 hours after eclosion and maintained in plastic vials containing standard food medium and kept in a humidified, temperature-controlled incubator with 12/12-h on/off light cycle at 25 °C. All strains were backcrossed 10x to yellow-white (yw) background and reared on food containing 25 mg/mL tetracycline for 3 generations to eliminate Wolbachia, followed by several generations in tetracycline-free food. Lifespan studies were performed using 10 groups of 25 male and 25 female flies, which were collected within 24 hours following eclosion as described above and maintained in plastic vials containing standard, high or low calorie food medium and kept in a humidified, temperature-controlled incubator with 12/12-h on/off light cycle at 25 °C. Flies were transferred to fresh food every other day for the first 30 days and then every day until no flies remained alive. The number of dead flies was scored after each passage. Flies requiring gene-switch induction were grown on food containing 200 μM RU486 and controls on EtOH. Approximately 20 females and 20 males flies are kept together in each vial and passed to fresh vials every 2 days for aging studies.
Longevity data were censored for early mortality (1-9 Days) and analyzed by long-rank tests using the JMP 10 program.
Oxidative Stress Resistance Studies
Oxidative stress resistance studies were conducted by keeping 20 flies in a vial containing filter paper soaked with 300 μL of 20 mM paraquat following initial starvation for 6 hours. The number of dead flies was counted hourly during the day and twice overnight until no flies remained alive. Stress resistance data were analyzed by long-rank tests using the JMP 10 program. Total number of flies per experiment is listed in Table 1.
Quantitative PCR (qPCR)
Total RNA was isolated from the midguts of 3 biological replicates with more than 25 flies in each replicates using Trizol as described [14]. qPCR was performed following cDNA synthesis and changes in gene expression patterns were determined using a 7500 Fast Real-Time PCR System (Applied Biosystems) and TaqMan Master Mix (Applied Biosystems). Gene specific TaqMan primers for Indy, dPGC-1, Pdsw, l(3)neo18, COI, ND23, ND42, ND75, GstD5 and GstD1 were obtained from the Invitrogen. All experiments were run in triplicate. Ankryn was used as an endogeneous controls in all q-PCR experiments.
Mitochondrial DNA Measurement
Total DNA from the midguts of more than 25 flies was isolated at 40 days using the Invitrogen DNA blood and tissue isolation kit (Life technologies). DNA copy number was determined using qPCR as described above. Mitochondrial DNA content was determined by the ratio of the mitochondrial gene for COI to a nuclear gene, GAPDH [6]. Rpl1140 was used as an endogenous control.
Electron Microscopy and Mitochondrial Quantification
Flies were fixed in 2% glutaraldehyde in 0.1 M sodium cacodylate buffer as described [21]. A minimum of 15 electron micrographs of midgut sections of each sample were taken at 10,000-15,000x, using an unbiased sampling method. Images were processed and analyzed in Adobe Photoshop. Post-fixation was conducted for 1 hr in 1% osmium tetroxide-0.8% potassium ferricyanide. Samples were stained in block with 1% aqueous uranyl acetate, dehydrated in a graded ethanol series, and embedded in Spurr low-viscosity epoxy resin. Thin sections of areas containing midgut were stained with uranyl acetate and lead citrate, and examined in a Hitachi H7650. Mitochondria were counted by using the point counting method by using a grid system to count the number of mitochondria present in a given image relative to cytoplasmic volume [7]. Size was determined by measuring the grid overlays per mitochondria and expressed relative to cytoplasmic volume.
Immunostaining, Quantification of ISCs/EBs and pH3+ Cells
Midguts were dissected from flies at 10, 20 and 40 days, fixed in 4% paraformaldehyde and stained as described [17]. Following washing, samples were mounted and imaged using the Leica camera attachment using LAS V4.1 software, or the Zeiss 780 combined confocal/FCS/NLO system, mounted on an inverted Axio Observer Z1. Fixed tissue was incubated overnight with mouse anti-gal 1:500 (Invitrogen); rabbit anti-pH3 1:300 (Invitrogen) or rabbit anti-INDY 1:300 [10] primary antibodies diluted in PBT [0.1%Triton X-100 in phosphate-buffered saline (PBS)] at 4°C. Following washing and blocking, tissue was incubated with the goat anti-rabbit Cy3 1:300 (Jackson) or goat anti-mouse FITC 1:300 (Jackson) secondary antibodies and DAPI 1:1000 (Invitrogen) diluted in PBT and 2% donkey serum for 1 hour at room temperature. Images were analyzed using Adobe Photoshop or Image J. Variability between different regions of the gut was reduced by quantifying images from the same designated region for each genotype in a 0.06x 0.02cm area. Cells were counted, values averaged and standard deviation calculated separately.
Dihydroethidium Staining
ROS levels were assessed in live whole midgut tissue as described [17, 18]. Tissue was dissected directly in Schneider's medium and incubated for 7 minutes in 60 mM dihydroethidium (DHE) (Invitrogen Molecular Probes) in Schneider's medium and 1:1000 4',6-diamidino-2-phenylindole (DAPI) nuclear stain in 0.1% PBT 2% donkey serum. Midguts were washed in Schneider's medium at room temperature, mounted in 70% glycerol and imaged using a Zeiss 780 combined confocal/FCS/NLO system, mounted on an inverted Axio Observer Z1. 2 μm Z stacks of regions 200-500 μm anterior to the pylorus were measured for mean signal intensity at 568 nm in Image J. Pixel intensities of Z stacks, spanning from the basal to apical cell layers, for at least 15 midguts per genotype were used for each of the quantifications.
JC-1 Analysis
JC-1 analysis was performed as described [17]. Whole midguts were dissected from female flies at 40 days directly into 5 μM JC-1 (Molecular Probes) in DMSO containing 1:1000 DAPI (Invitrogen) and incubated in the dark for 30 minutes at room temperature. Midguts were washed 2 times for 5 minutes each and mounted in PBS. Images were taken of midguts approximately 300 μm from the anterior pylorus in the 568 nm channel using the Zeiss 780 combined confocal/FCS/NLO system and analyzed in Image J. Mean pixel intensities for J-aggregates were averaged, and significant differences between means were determined with a Mann-Whitney U test.
Intestinal Integrity
Quantification of intestinal integrity was done as described [17]. More than 50 female flies were transferred to standard lab food containing 2.5% w/v FD&C blue dye #1 for 150 minutes beginning at 7am. The percentage of blue flies per population was quantified and represented as mean averages ± SE values.
Statistical analysis
Significance was determined using a two-tailed, unpaired t-test from at least three independent experiments and expressed as P values, with the exception of longevity studies and JC-1 aggregation analysis. Error bars represent SEM, t test, P values are specifically indicated in each figure.
Supplementary Materials
Acknowledgments
We thank Arthur Hand for his expert help with EM techniques and Suzanne Kowalski, Leila Fussell and Elizabeth Slocum for technical assistance. We thank Joseph Jack, Stewart Frankel, Yih-Woei Fridell and Jared Woods for critical reading of the manuscript. Authors declare that they have no financial, personal, or professional conflicts of interest. This work was supported by grant from the National Institutes of Health AG023088 to B Rogina.
Conflicts of Interest
The authors of this manuscript declare no conflict of interests.
References
- 1. Guarente L. Mitochondria--a nexus for aging, calorie restriction, and sirtuins? Cell. 2008; 132: 171 -176. [PubMed] .
- 2. Lopez-Lluch G, Hunt N, Jones B, Zhu M, Jamieson H, Hilmer S, Cascajo MV, Allard J, Ingram DK, Navas P, De Cabo R. Calorie restriction induces mitochondrial biogenesis and bioenergetic efficiency. Proc Natl Acad Sci USA. 2006; 103: 1768 -1773. [PubMed] .
- 3. Nisoli E, Tonello C, Cardile A, Cozzi V, Bracale R, Tedesco L, Falcone S, Valerio A, Cantoni O, Clementi E, Moncada S, Carruba MO. Calorie restriction promotes mitochondrial biogenesis by inducing the expression of eNOS. Science. 2005; 310: 314 -317. [PubMed] .
- 4. Wallace DC. A mitochondrial paradigm of metabolic and degenerative diseases, aging, and cancer: a dawn for evolutionary medicine. Annu Rev Genet. 2005; 39: 359 -407. [PubMed] .
- 5. Choi NH, Kim JH, Yang DJ, Kim YS, Yoo MA. Age-related changes in Drosophila midgut are associated with PVF2, a PDGF/VEGF-like growth factor. Aging. 2008; Cell 7: 318 -334. .
- 6. Neretti N, Wang PY, Brodsky AS, Nyguyen HH, White KP, Rogina B, Helfand SL. Long-lived Indy induces reduced mitochondrial reactive oxygen species production and oxidative damage. Proc Natl Acad Sci USA. 2009; 106: 2277 -2282. [PubMed] .
- 7. Birkenfeld AL, Lee HY, Guebre-Egziabher F, Alves TC, Jurczak MJ, Jornayvaz FR, Zhang D, Hsiao JJ, Martin-Montalvo A, Fischer-Rosinsky A, Spranger J, Pfeiffer AF, Jordan J, et al. Deletion of the mammalian INDY homolog mimics aspects of dietary restriction and protects against adiposity and insulin resistance in mice. Cell Metab. 2011; 14: 184 -195. [PubMed] .
- 8. Fei YJ, Inoue K, Ganapathy V. Structural and functional characteristics of two sodium-coupled dicarboxylate transporters (ceNaDC1 and ceNaDC2) from Caenorhabditis elegans and their relevance to life span. J Biol Chem. 2003; 278: 6136 -6144. [PubMed] .
- 9. Knauf F, Mohebbi N, Teichert C, Herold D, Rogina B, Helfand S, Gollash M, Luft FC, Aronson PS. The life-extending gene Indy encodes an exchanger for Krebs-cycle intermediates. Biochem J. 2006; 387: 25 -29. [PubMed] .
- 10. Knauf F, Rogina B, Jiang Z, Aronson PS, Helfand SL. Functional characterization and immunolocalization of the transporter encoded by the life-extending gene Indy. Proc Natl Acad Sci USA. 2002; 99: 14315 -14319. [PubMed] .
- 11. Fei JY, Liu JC, Inoue K, Zhuang L, Miyake K, Miyauchi S, Ganapathy V. Relevance of NAC-2 and NA+-coupled citrate transporter, to lifespan, body size and fat content in Caenorhabditis elegans. Biochem J. 2004; 379: 191 -198. [PubMed] .
- 12. Rogina B and Helfand SL. Indy mutations and Drosophila longevity. Front Genet. 2013; 4: doi: 10.3389/fgene.2013.00047 .
- 13. Rogina B, Reenan RA, Nilsen S, Helfand SL. Extended life-span conferred by cotransporter gene mutations in Drosophila. Science. 2000; 290: 2137 -2140. [PubMed] .
- 14. Wang PY, Neretti N, Whitaker R, Hosier S, Chang C, Lu D, Rogina B, Helfand SL. Long-lived Indy and calorie restriction interact to extend life span. Proc Natl Acad Sci USA. 2009; 106: 9262 -9267. [PubMed] .
- 15. Gershman B, Puig O, Hang L, Peitzch RM, Tatar M, Garofalo RS. High-resolution dynamics of the transcriptional response to nutrition in Drosophila: a key role for dFOXO. Physiol. Genomics. 2007; 29: 24 -34. [PubMed] .
- 16. Puigserver P and Spiegelman BM. Peroxisome proliferator-activated receptor-gamma coactivator 1alpha (PGC-1alpha): transcriptional coactivator and metabolic regulator. Endocr Rev. 2003; 24: 78 -90. [PubMed] .
- 17. Rera M, Bahadorani S, Cho J, Koehler CL, Ulgherait M, Hur JH, Ansari WS, Lo TJr, Jones DL, Walker DW. Modulation of longevity and tissue homeostasis by the Drosophila PGC-1 homolog. Cell Metab. 2011; 14: 623 -634. [PubMed] .
- 18. Hochmuth CE, Biteau B, Bohmann D, Jasper H. Redox regulation by Keap1 and Nrf2 controls intestinal stem cell proliferation in Drosophila. Cell Stem Cell. 2011; 8: 188 -199. [PubMed] .
- 19. Jasper H and Jones DL. Metabolic regulation of stem cell behavior and implications for aging. Cell Metab. 2010; 12: 561 -565. [PubMed] .
- 20. Micchelli CA and Perrimon N. Evidence that ste cells reside in the adult Drosophila midgut epithelium. Nature. 2006; 439: 475 -479. [PubMed] .
- 21. Ohlstein B and Spradling A. The adult Drosophila posterior midgut is maintained by pluripotent stem cells. Nature. 2006; 439: 470 -474. [PubMed] .
- 22. Ohlstein B and Spradling A. Multipotent Drosophila intestinal stem cells specify daughter cell fates by differential notch signaling. Science. 2007; 315: 988 -992. [PubMed] .
- 23. Hwang AB, Jeong DE, Lee SJ. Mitochondria and organismal longevity. Curr Genomics. 2012; 13: 519 -532. [PubMed] .
- 24. St-Pierre J, Drori S, Uldry M, Silvaggi JM, Rhee J, Jager S, Handschin C, Zheng K, Lin J, Yang W, Simon DK, Bachoo R, Spiegelman BM. Suppression of reactive oxygen species and neurodegeneration by the PGC-1 transcriptional coactivators. Cell. 2006; 127: 397 -408. [PubMed] .
- 25. Biteau B, Karpac J, Supoyo S, DeGennaro M, Lehmann R, Jasper H. Lifespan extension by preserving proliferative homeostasis in Drosophila. PLoS Genet. 2010; 6: e1001159 [PubMed] .
- 26. Quinones-Coello AT, Petrella LN, Ayers K, Melillo A, Mazzalupo S, Hudson AM, Wang S, Castiblanco C, Buszczak M, Hoskins RA, Cooley L. Exploring strategies for protein trapping in Drosophila. Genetics. 2007; 175: 1089 -1104. [PubMed] .
- 27. Hans F and Dimitrov FH. Histone H3 phosphorylation and cell division. Oncogene. 2001; 20: 3021 -3027. [PubMed] .
- 28. Brand AH and Perrimon N. Targeted gene expression as a mean of altering cell fates and generating dominant phenotypes. Development. 1993; 118: 401 -415. [PubMed] .
- 29. Frankel S and Rogina B. Indy mutants: live long and prosper. Front Genet. 2012; 3: 13 doi: 10.3389/fgene.2012.00013 [PubMed] .
- 30. Toivonen JM, Walker GA, Martinez-Diaz P, Bjedov I, Driege Y, Jacobs HT, Gems D, Partridge L. No influence of Indy on lifespan in Drosophila after correction for genetic and cytoplasmic background effects. PLoS Genet. 2007; 3: e95 [PubMed] .
- 31. Panopoulos AD, Yanes O, Ruiz S, Kida YS, Diep D, Tautenhahn R, Herrerias A, Batchelder EM, Plongthongkum N, Lutz M, Berggren WT, Zhanf K, Evans RM, et al. The metabolome of induced pluripotent stem cells reveals metabolic changes occuring in somatic cell reprogramming. Cell Res. 2012; 22: 168 -177. [PubMed] .
- 32. Zhang J, Nuebel E, Daley GQ, Koehler CM, Teiteli MA. Metabolic regulation in pluripotent stem cells during reprogramming and self-renewal. Cell Stem Cells. 2012; 11: 589 -595. .
- 33. O'Brien LE, Soliman SS, Li X, Bilder D. Altered modes of stem cell division drive adaptive intestinal growth. Cell. 2011; 147: 603 -614. [PubMed] .
- 34. Biteau B, Hochmuth CE, Jasper H. JNK activity in somatic stem cells causes loss of tissue homeostasis in the aging Drosophila gut. Cell Stem Cell. 2008; 3: 442 -455. [PubMed] .
- 35. Biteau B, Hochmuth CE, Jasper H. Maintaining tissue homeostasis: dynamic control of somatic stem cell activity. Cell Stem Cell. 2011; 9: 402 -411. [PubMed] .
- 36. Finley LWS, Lee J, Souza A, Desquiret-Dumas V, Bullock K, Rowe GC, Procaccio V, Clish CB, Arany Z, Haigis M. Skeletal muscle transcriptional coactivator PGC-1a mediates mitochondrial, but not metabolic, changes during caloric restriction. Proc. Natl. Acad. Sci. USA. 2012; 109: 2931 -2936. [PubMed] .
- 37. Choi NH, Lucchetta E, Ohlstein B. Nonautonomous regulation of Drosophila midgut stem cell proliferation by the insulin-signaling pathway. Proc. Natl. Aca. Sci. USA. 2011; 108: 18702 -18707. .
- 38. Boynton S and Tully T. latheo, a new gene involved in associative learning and memory in Drosophila melanogaster identified from P element mutagenesis. Genetics. 1992; 131: 655 -672. [PubMed] .
- 39. Dietzl G, Chen D, Schnorrer F, Su KC, Barinova Y, Fellner M, Gasser B, Kinsey K, Oppel S, Scheiblauer S, Couto A, Marra V, Keleman K, Dickson BJ. A genome-wide transgenic RNAi library for conditional gene inactivation in Drosophila. Nature. 2007; 448: 442 -447. .