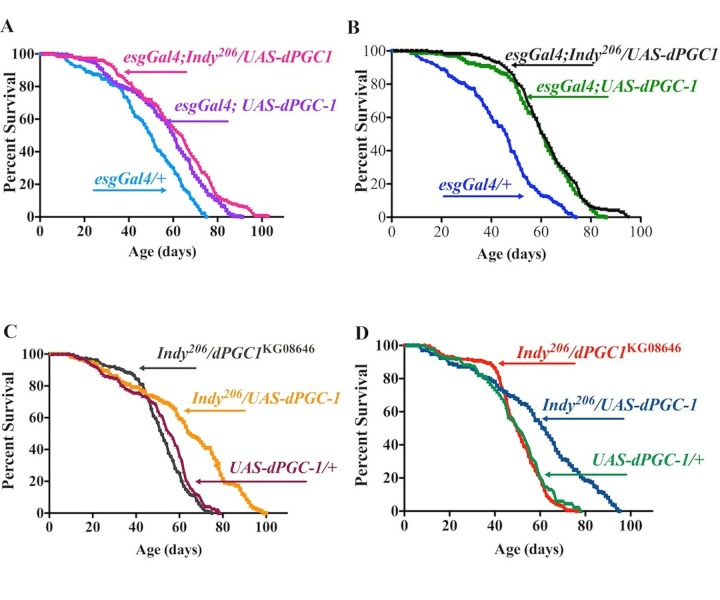
Figure 5.Indy and dPGC-1 longevity pathways overlap. (A) Lifespan curves of female esgGal4;Indy206/UAS-dPGC1 (magenta), esgGal4;UAS-dPGC-1 (purple) and genetic controls (esgGal4/+) (blue) flies. esgGal4;UAS-dPGC-1 females overexpressing dPGC-1 in esg-positive cells, and Indy mutant females with dPGC-1 overexpression in the esg-positive cells have 19.9%, and 27.7% increase in median longevity compared to genetic controls (esgGal4/+) flies, respectively. (B) Lifespan curves of male esgGal4;Indy206/UAS-dPGC1 (black), esgGal4;UAS-dPGC-1 (green) and genetic controls (esgGal4/+) (blue). esgGal4;UAS-dPGC-1 males overexpressing dPGC-1 in esg-positive cells, and Indy mutant male with dPGC-1 overexpression in the esg-positive cells have 35.1% and 40.6% increase in median longevity compared to genetic controls (esgGal4/+), respectively. (C) Lifespan curves of female Indy206 mutants with a hypomorphic allele for dPGC-1 (esgGal4;Indy206/UAS-dPGC1) (gray), Indy mutant flies with one copy of the dPGC-1UAS construct (esgGal4;Indy206/UAS-dPGC1) (yellow) and genetic controls (UAS-dPGC1/+) (maroon). esgGal4;Indy206/UAS-dPGC1 flies show similar longevity compared to controls and esgGal4;Indy206/UAS-dPGC1 females show 22.5% median longevity extension. (D) Lifespan curves of male Indy206 mutant with a hypomorphic allele for dPGC-1 (esgGal4;Indy206/UAS-dPGC1) (red), Indy mutant flies with one copy of the dPGC-1UAS construct (esgGal4;Indy206/UAS-dPGC1) (blue) and genetic controls (UAS-dPGC1/+) (green). esgGal4;Indy206/UAS-dPGC1 flies show similar longevity compared to controls and esgGal4;Indy206/UAS-dPGC1 males show 23.5% median longevity extension. See Figure S6, Table 3. n>170 for all lifespan studies.
Figure 5 — Increased mitochondrial biogenesis preserves intestinal stem cell homeostasis and contributes to longevity in Indy mutant flies | Aging