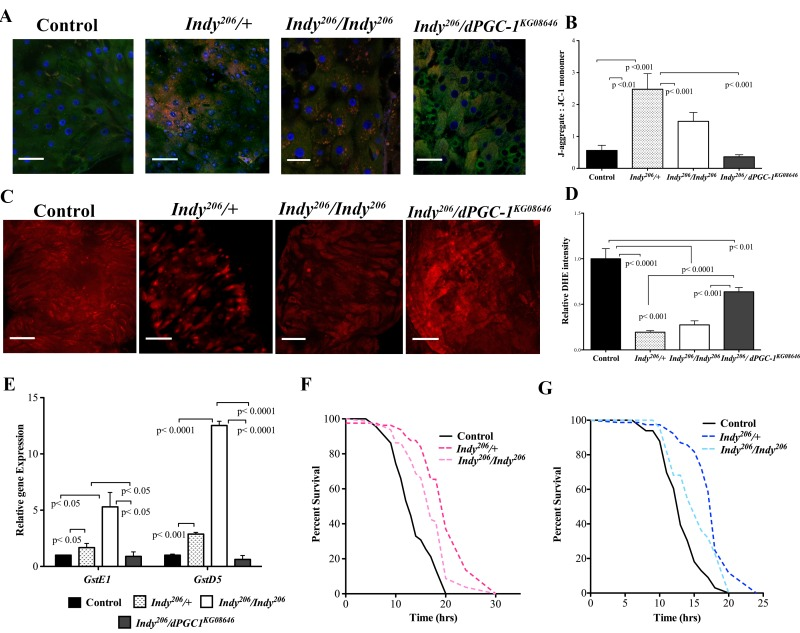
Figure 2.Indy mutants have reduced ROS levels and increased oxidative stress resistance. (A) Visualization of JC-1 dye in female yw control, Indy206/+, Indy206/Indy206 and Indy206/dPGC-1KG08646 mutant flies at 40 days. Indy mutant flies show increased mitochondrial membrane potential compared to controls and Indy206/dPGC-1KG08646 mutants. Scale bar represents 1μm (B) Ratio of red JC-aggregates to green JC-1 monomer. Indy206/+ and Indy206/Indy206 mutant flies have increased mitochondrial membrane potential shown by increased red:green JC-1 ratiocompared to control and Indy206/dPGC-1KG08646 mutants (p<0.01, p<0.001, n>10 guts per genotype, compared by Mann-Whitney U test) (C) Positive DHE staining for ROS in compressed Z-stack of female control, Indy206/+, Indy206/Indy206 and Indy206/dPGC-1KG08646 mutant midgut flies at 40 days. Scale bar represents 1μm. (D) Mean DHE intensity in compressed Z-stack of female control, Indy206/+, Indy206/Indy206 and Indy206/dPGC-1KG08646 mutant midguts at 40 days. (p<0.001, p<0.0001, n>15 guts per genotype; Scale bar represents 1μm). (E) Levels of GstE1 and GstD5 mRNA in female yw control, Indy206/+, Indy206/Indy206 and Indy206/dPGC-1KG08646 mutant midgut tissue determined by qPCR. There is a significant increase (p<0.05, p<0.001, p< 0001 n=3, 25 guts per replicate) in levels of both gene mRNA levels in Indy206 mutant midgut tissue at 20 days compared to control and Indy206/dPGC-1KG08646. Survival curves for female (F) and male (G) yw control, Indy206/+ and Indy206/Indy206 flies on 20mM paraquat. Indy206 mutants have increased resistance to oxidative stress compared to control.