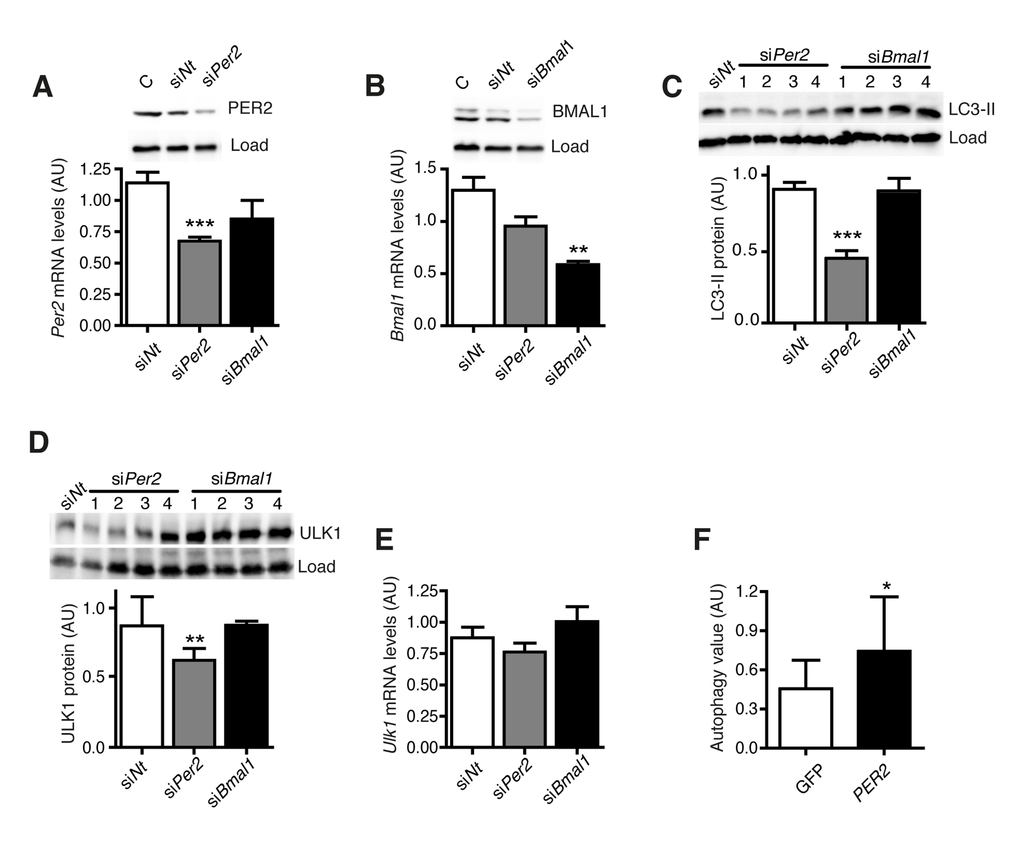
Figure 5.PER2 regulates autophagy. (A) Per2 mRNA and protein levels after transfection with Per2-or Bmal1-specific siRNA or an equivalent dose of non-target siRNA. C: untransfected control sample. (B)Bmal1 mRNA and protein levels. (C) LC3-II protein levels. (D) ULK1 protein levels. (E)Ulk1 mRNA levels. All data are shown as mean values ± SEM, n=4. Asterisks designate statistically significant differences of specific siRNA treatment versus control treatment with siNt (unpaired t-test, two-tailed). (F) Autophagy value (LC3-II in inhibitor treated cells – LC3-II in untreated cells) in two different cell lines from donors aged 60-70 years expressing only GFP (white) or PER2-GFP (black). Asterisks designate statistically significant differences of PER2-GFP versus GFP expression (unpaired t-test, two-tailed), n=3.