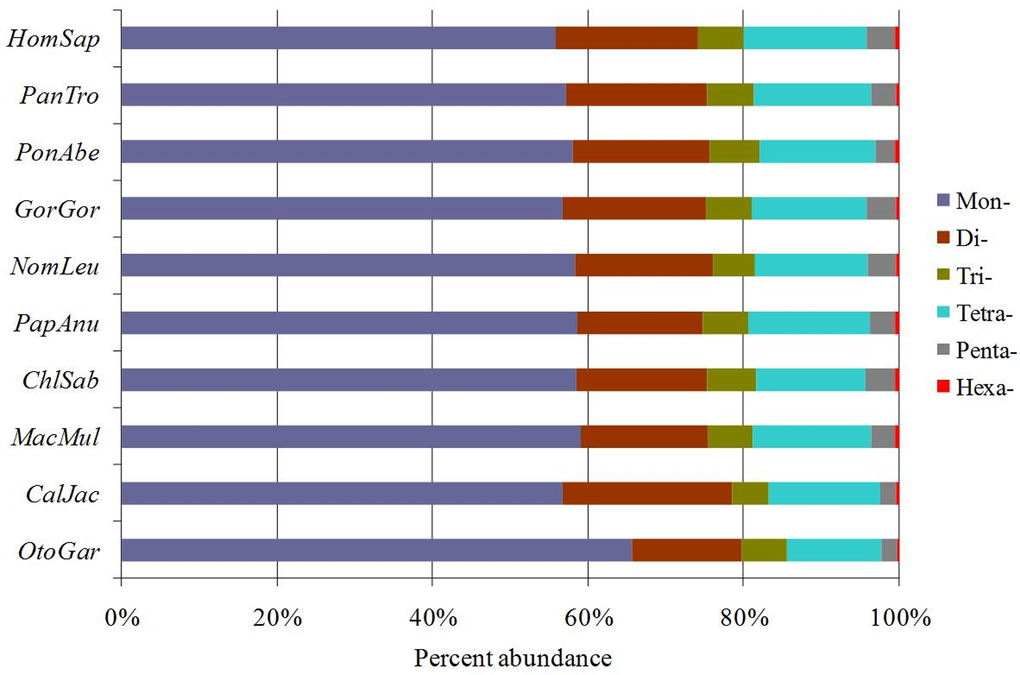
Figure 2.The distribution of SSRs in ten primate genomes. Percentages were calculated according to the total number of each SSR category divided by the total number of SSRs for that organism.
Figure 2 — Distinct patterns of simple sequence repeats and GC distribution in intragenic and intergenic regions of primate genomes | Aging