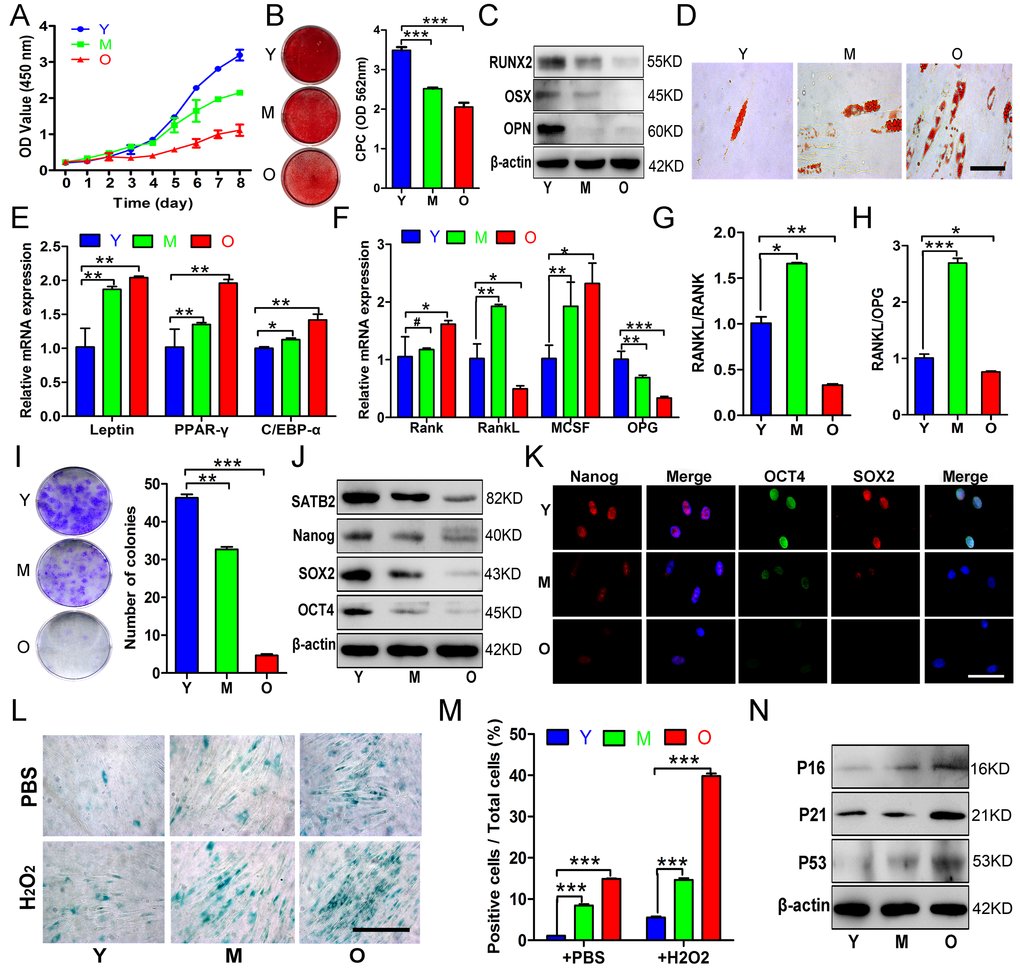
Figure 2.Age-related properties of AB-BMSCs. (A) Decreased proliferation rates of BMSCs in group O as compared with Y, M groups was detected using CCK8 assay. (B, C) Decreased osteogenic differentiation of AB-BMSCs in M and O group in relative to Y group was observed by Alizarin red staining and osteogenic markers expression at day 14 after induction. (D, E) Enhanced adipogentic ability of AB-BMSCs associated with age as detected by oil red staining and higher mRNA levels of adipogenic markers at day 14 after induction. (F, G, H) The expression of RANK, RANKL, M-CSF and OPG, and the ratios of RANKL/RANK and RANKL/OPG were measured in different groups of AB-BMSCs as indicated. (I) More colony-forming units were observed in BMSCs from Y group than M and O group. (J, K) Western blot and immunofluorescence assays revealed decreased SATB2, Nanog, SOX2 and OCT4 protein expression associated with ages in different groups of AB-BMSCs as indicated. (L, M) SA-β-Gal staining revealed more senescent AB-BMSCs and the cells were easier to induce senescence under oxidative stress in M and O groups. (N) Western blot results showed higher P16, P21 and P53 expression in M and O groups compared to Y group. #p> 0.05, *p< 0.05, **p< 0.01, ***p< 0.001. Scale bar = 100 μm in K and Scale bar = 50 μm in D and L.