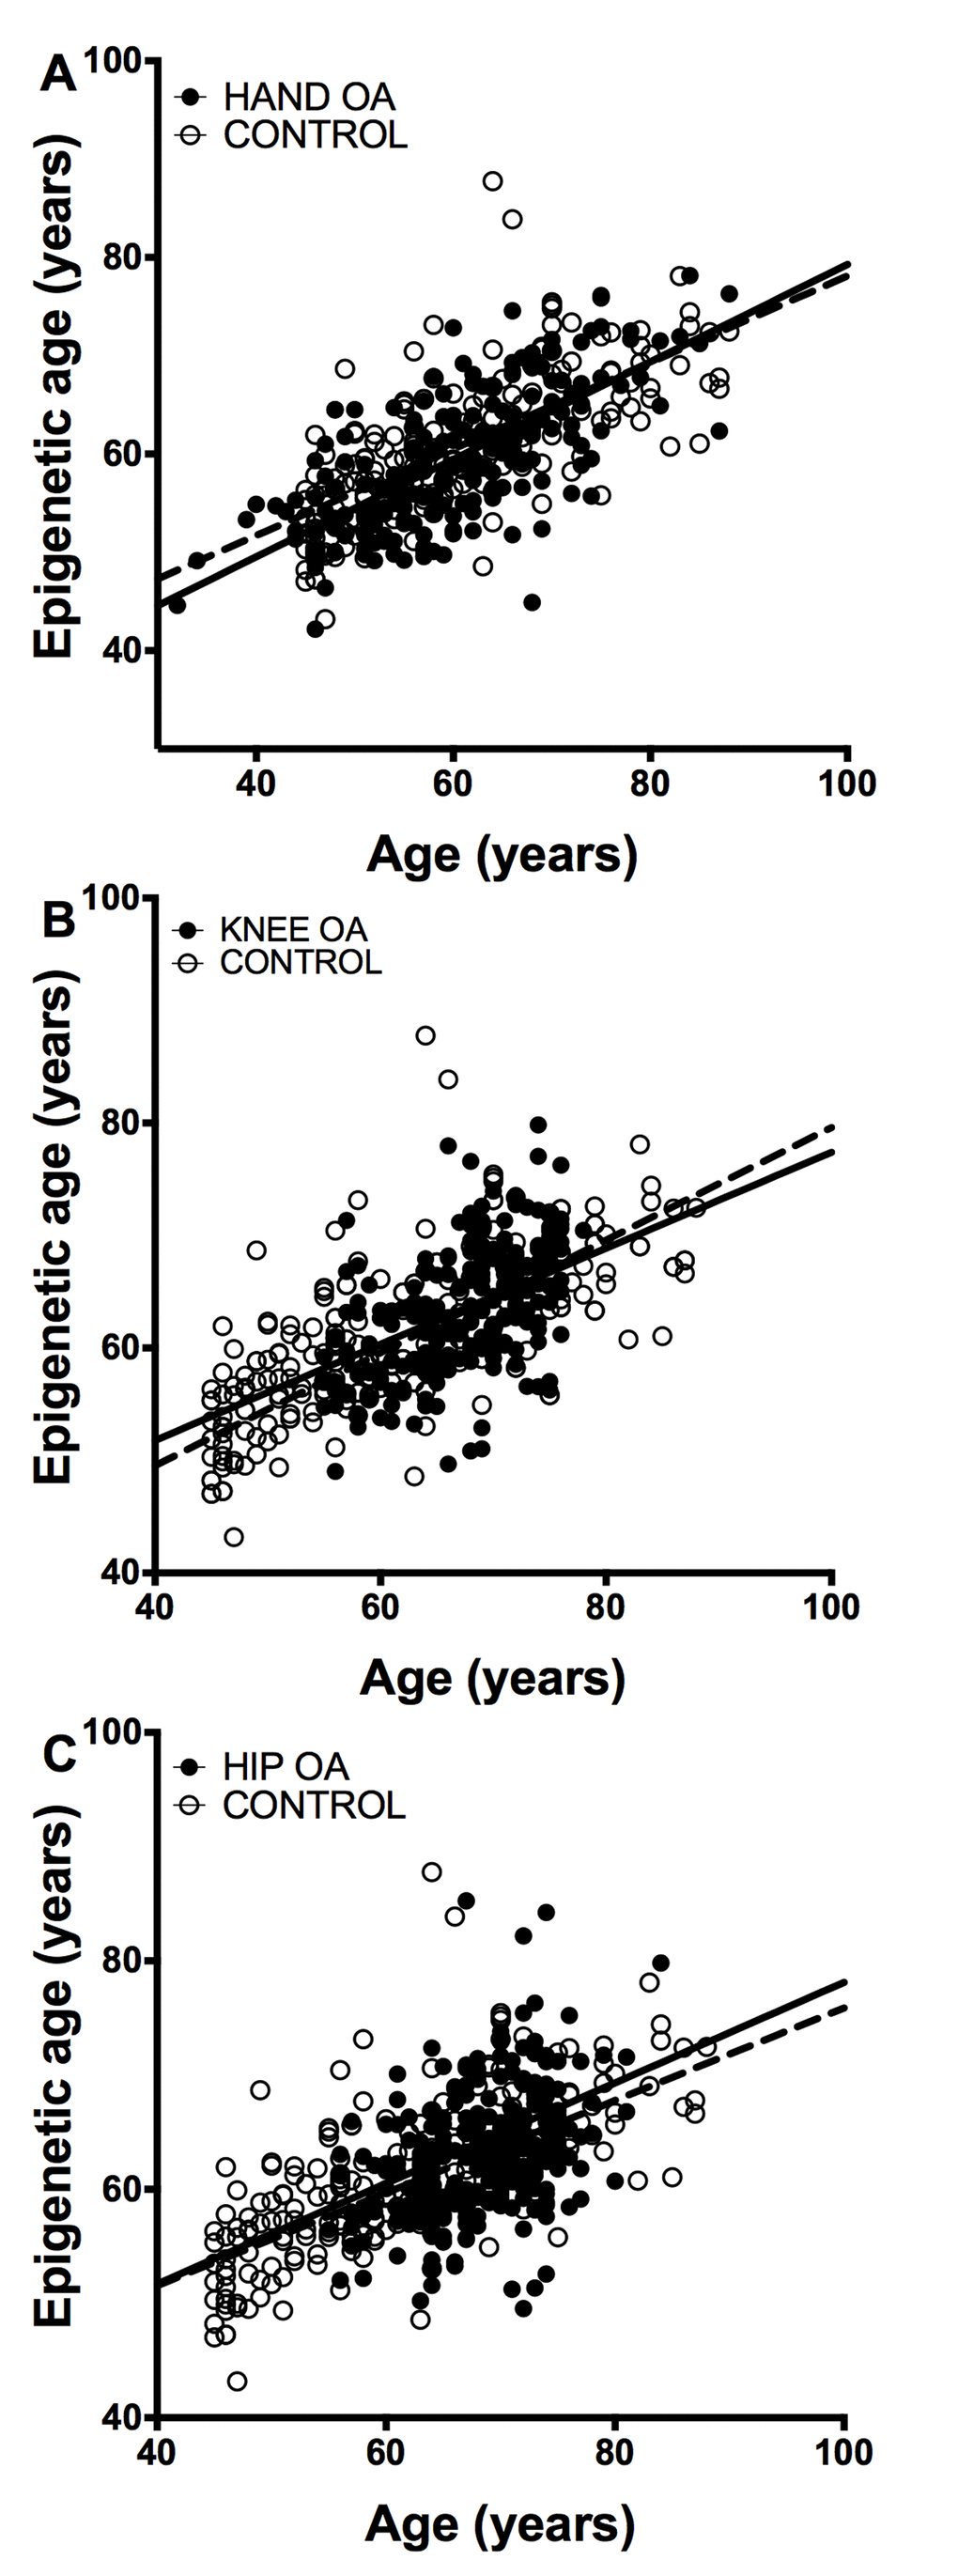
Figure 2.Lack of accelerated epigenetic aging in blood cells of OA patients. The scatterplots represent age in the horizontal axis against epigenetic age in the vertical axis from the controls without OA (empty circles, n =182) together with (A) the hand OA (n = 206), (B) the knee OA (n = 229), and (C) the hip OA (n = 273) patients (filled circles). Straight lines represent least squares regression fit to the data.