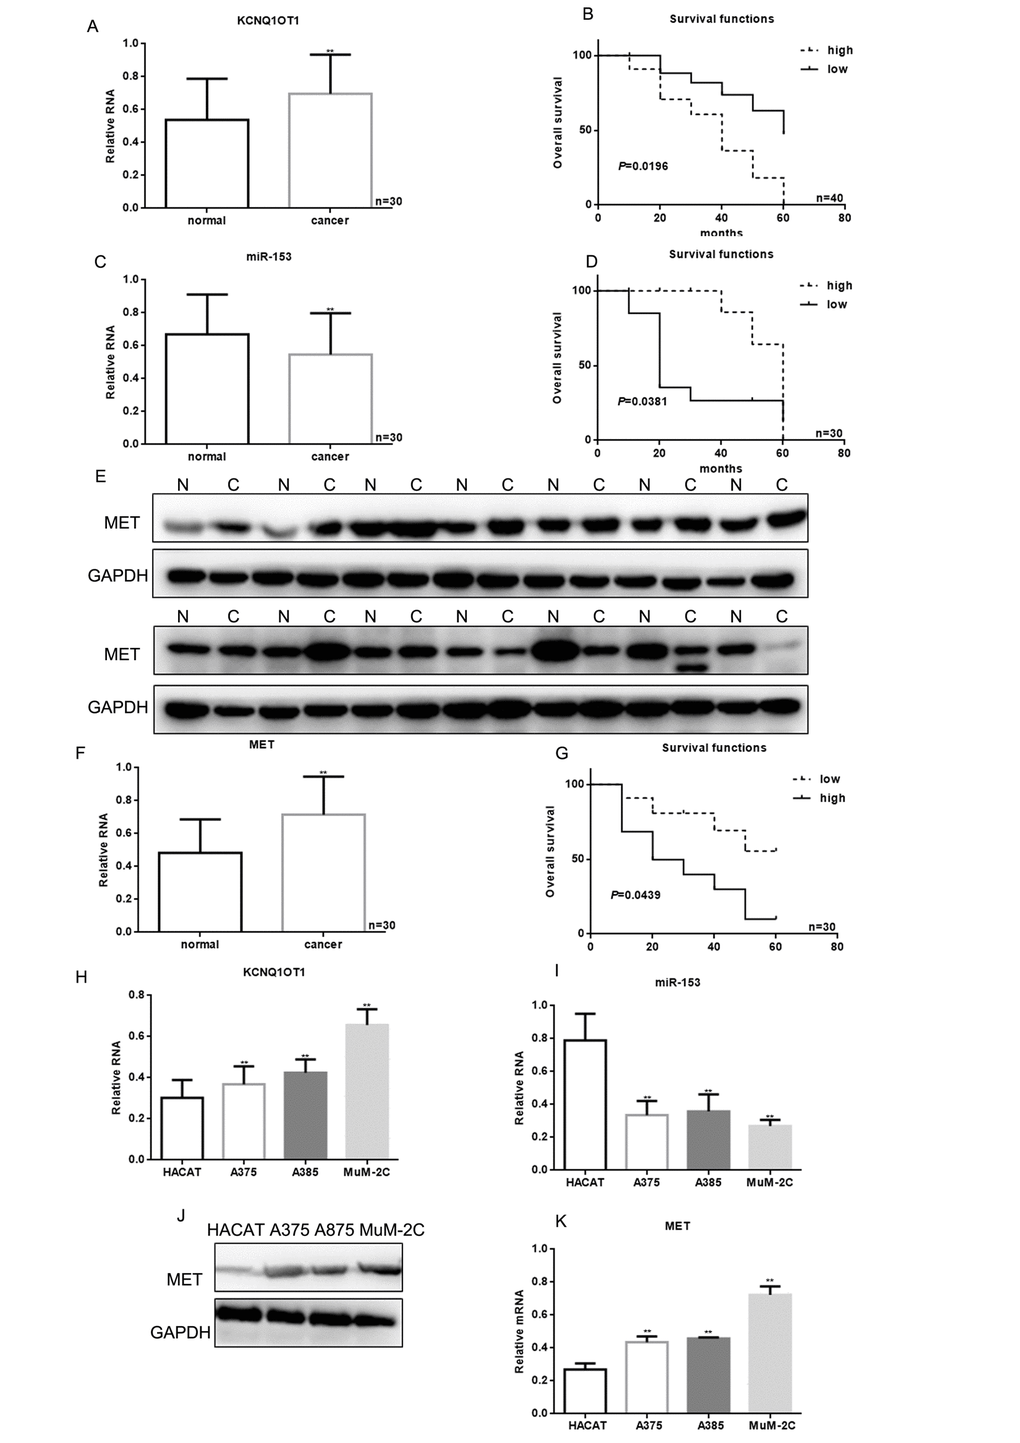
Figure 1.KCNQ1OT1, miR-153, and MET correlation with melanoma. (A) KCNQ1OT1 levels detected by real time PCR in 30 samples of melanoma and adjacent tissues. Data are presented as means ± SEM. ** P < 0.01 for comparison of tumor vs. adjacent tissues groups. (B) The relationship between KCNQ1OT1 expression and patient survival. (C) The levels of miR-153 were detected by real time PCR in 30 samples of melanoma and adjacent tissues. Data are presented as means ± SEM. ** P < 0.01 for comparison of tumor vs. adjacent tissues groups. (D) Relationship between miR-153 expression and patient survival. Patients with high expression of miR-153 showed longer survival (E) MET levels were detected by western blot in melanoma and adjacent tissues. Data are presented as means ± SEM. ** P < 0.01 for comparison of tumor vs. adjacent tissues groups. (F) MET levels were detected by real time PCR in 30 samples of melanoma and adjacent tissues. Data are presented as means ± SEM. ** P < 0.01 for comparison of tumor vs. adjacent tissues groups. (G) The relationship between MET expression and patient survival. (H) KCNQ1OT1 expression in HACAT, A375, A875 and MuM-2C cells was measured by real time PCR. Data are shown as mean ± SEM. ** P< 0.01 vs. HACAT (I) MiR-153 expression in HACAT, A375, A875 and MuM-2C cells. Data are shown as mean ± SEM. ** P< 0.01 vs. HACAT (J, K) MET expression in HACAT, A375, A875 and MuM-2C cells. Data are shown as mean ± SEM. ** P< 0.01 vs. HACAT.