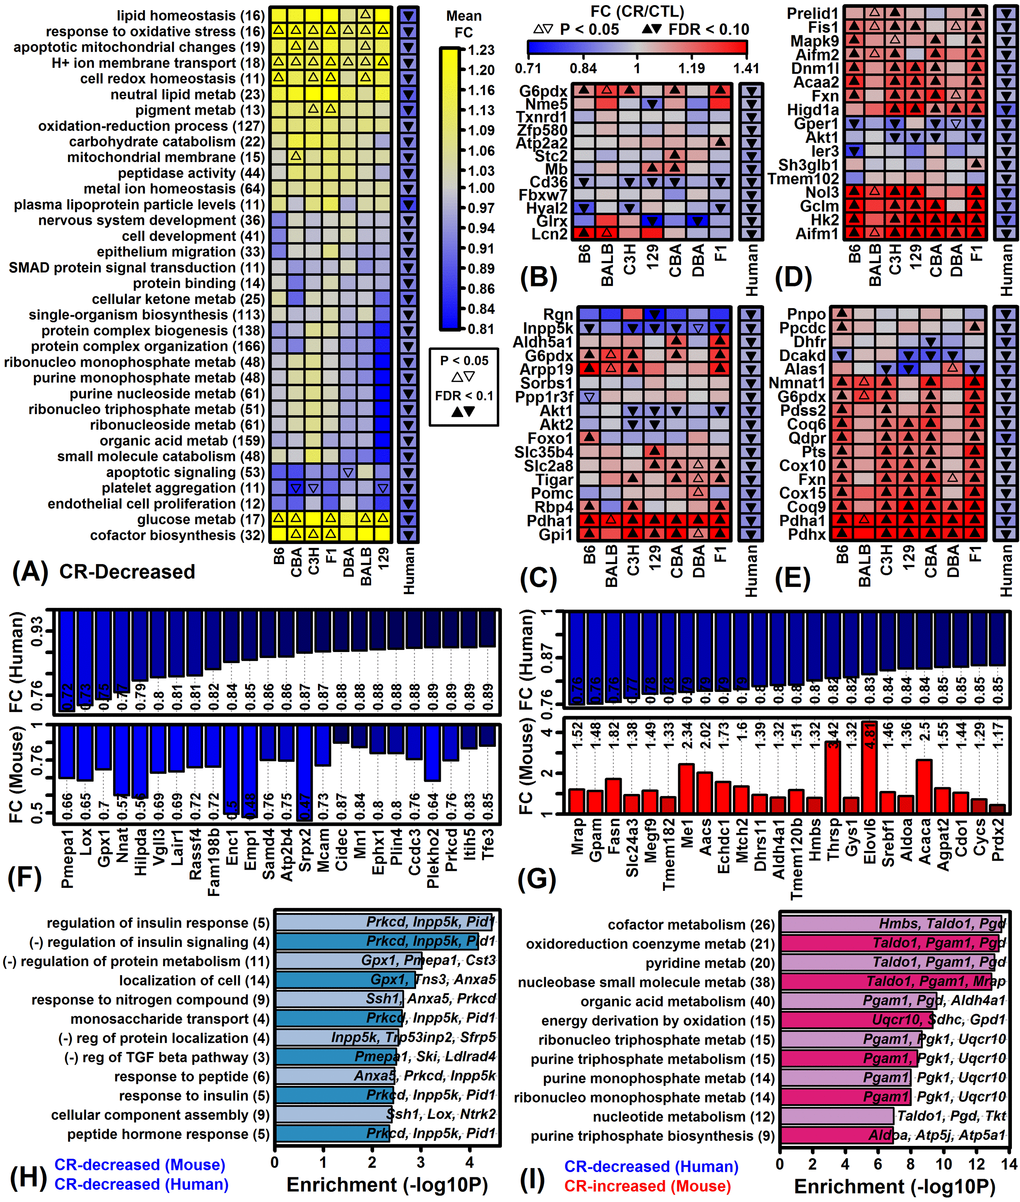
Figure 8.Genes decreased by CR in humans and Gene Ontology-based mouse comparison. (A) GO BP terms most strongly enriched among genes decreased by CR across 28 human experiments. (B) Genes associated with response to oxidative stress (GO:0006979). (C) Genes associated with glucose metabolic process (GO:0006006). (D) Genes associated with apoptotic mitochondrial changes (GO:0008637). (E) Genes associated with cofactor biosynthesis (GO:0051188). (F) Genes most strongly decreased by CR in humans and mice. (G) Genes decreased by CR in humans but increased in mice. In (F) and (G), color-coded bars show average FC estimates in humans (top) and mice (bottom). Average FC estimates are listed within each figure. (H) GO BP terms enriched among 74 genes decreased by CR in humans and mice. Genes were decreased by 5% on average in humans (FDR < 0.10) and decreased by CR with respect to at least 6 of 7 mouse strains (P < 0.05 per strain). (I) GO BP terms enriched among 233 genes decreased by CR in humans but increased by CR in mice. Genes were decreased by 5% on average in humans (FDR < 0.10) and increased by CR with respect to at least 6 of 7 mouse strains (P < 0.05 per strain). In (H) and (I), the number of genes associated with each GO BP term is listed in parentheses (left margin) and example genes are listed within the figure.