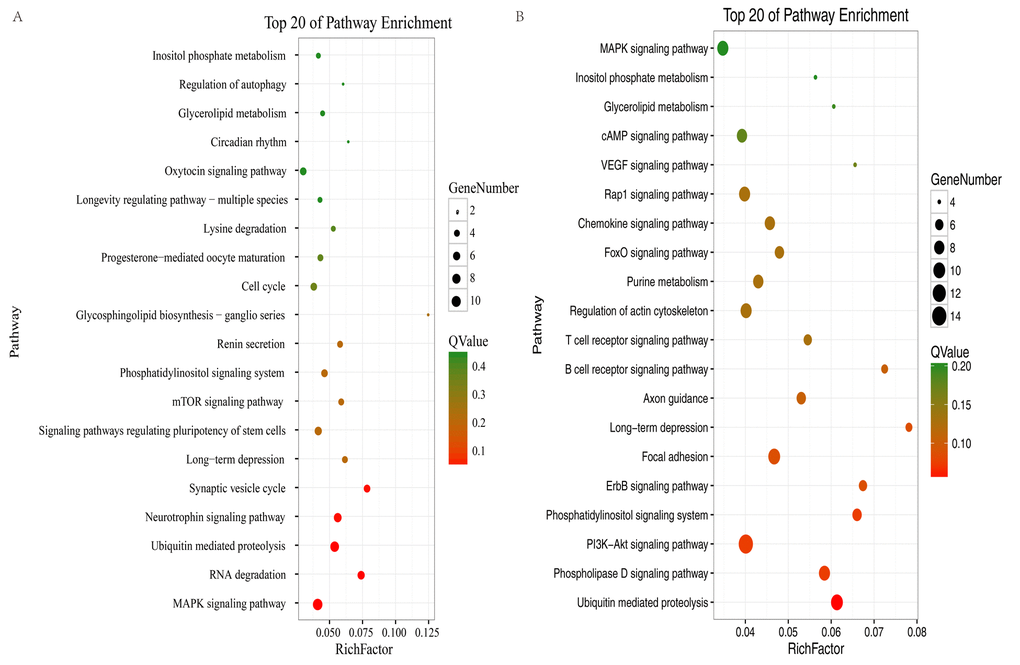
Figure 5.KEGG analysis of profile 0 in the hippocampus and cerebellum. The bubble chart shows enriched differentially expressed genes in signaling pathways. (A) Bubble chart of the top 20 pathways in the hippocampus. (B) Bubble chart of the top 20 pathways in the cerebellum. The Y-axis label represents the pathway and the X-axis label represents the rich factor (rich factor = amount of differentially expressed genes enriched in the pathway/amount of all genes in background gene set). The color and size of the bubble represent enrichment significance and the amount of differentially expressed genes enriched in the pathway, respectively.